Setting the boundaries for social LCA in comparison with environmental LCA, Environmental & Integrated Assessment of Complex Systems
•
1 gostou•1,149 visualizações


Recomendados
Mais conteúdo relacionado
Mais procurados
Mais procurados (19)
Semelhante a Setting the boundaries for social LCA in comparison with environmental LCA, Environmental & Integrated Assessment of Complex Systems
Semelhante a Setting the boundaries for social LCA in comparison with environmental LCA, Environmental & Integrated Assessment of Complex Systems (20)
Último
Último (20)
Setting the boundaries for social LCA in comparison with environmental LCA, Environmental & Integrated Assessment of Complex Systems
- 1. Taking into account the social effects of competition between products Vincent Lagarde1, Catherine Macombe2 1 CREOP, Institut d’Administration des Entreprises, Limoges (France) 2 Joint Unit ITAP- Cemagref- ELSA, Montpellier (France) Because it enables us comparing the social impacts of different products’ life cycles, social LCA can help decision makers to perform choices among several likely technical and economic options. The purpose of the life cycle is a service (captured in LCA by the notion of « functional unit »), which can be got either from several variants of the same industry (competing together directly and indirectly), or from substitutable industries (product substitutes, ersatz). During social LCA studies, researchers explore the relevant product system(s), and spot the leading firm. Around this firm, what are the organisations whose social effects must be taken into account? The issue is how to mark the boundaries of the study perimeter? Picturing the follow-up of the different steps of the life cycle by the « value chain »1, in use in industrial economics, is not enough. Indeed, the chain is linked to the rest of the World thanks to its suppliers, themselves being linked to other suppliers and so on. Moreover, it may happen than one product entails huge and unexpected social affects, because it moves (positively or negatively) for instance the market of another product, more or less directly. To take into account these affects, we suggest using the concept of strategic arena, combined with a cut-off criteria. Making compatible the industrial approach (M.E. Porter) and study by industry, the strategic arena enables us to bring together -in the same analysis- competitors, suppliers, customers and substitutes who contribute to the satisfaction of the same elementary need (Rothschild, 1984). Thanks to the competitive dynamic trend (Smith, Gannon & Grimm, 1992), we can describe the strategic consequences of actions and reactions of interdependent firms, within more and more competitive surrounding conditions (D'Aveni, 1994). So, the model of value creation (Brandenburger et Nalebuff, 1996) enables us identifying the winning strategies which provide economic value for the leading firm. In addition to the suppliers and customers, this model considers competitors and « complementors » who co-build the offer of the leading firm. We suggest using this model to check the creation and destruction of social value for stakeholders, especially for workers. The cut-off criteria is based on the dependency of all the identified organisations (whatever suppliers, complementors and so on) to the leading firm. In a first step, in order to test these proposals, we exemplify them by one case study. It is an assessment of the number of jobs of rural workers2 (within a context where those jobs are scarce) likely created/destroyed by the firm’s growth. The Brandenburger’s and Nalebuff’s model enables us to mark the boundary of the group of organisations involved, whatever the impacts to be assessed. The purpose of this exploratory work is to let us take into account the indirect social affects caused by products3, beyond the obvious affects, at suppliers’ for instance. 1 If we add a fictive organisation standing for « users », and another for « end of life ». Of course, “number of jobs” in itself is not a social impact, but an intermediate step to calculate social impacts. 3 “Product” means here changes in the product policies, changes in delivered quantities, or intrusion of a new product into a social space. 2
- 2. Baum J.A.C., Korn H.J. (1996) “Competitive dynamics of interfirm rivalry”, Academy of Management Journal, vol 39, n°2, p255-291. Brandenburger A.M. and Nalebuff B.J. (1996) Co-Opetition, Currency United States, ISBN 9780385479509. D'Aveni R.A. (1994), Hypercompetition : Managing the Dynamics of Strategic Maneuvering, Free Press, 448 pages, ISBN 978-0029069387. Rothschild W.E. (1984), How to gain (and maintain) the competitive advantage in business, McGraw-Hill Companies, New-York, 256 p., ISBN 978-0070540316 Smith G.K, Gannon M.J, Grimm C.M (1992), Dynamic of Competitive Strategy, Sage Publication Inc, 232p, ISBN-13: 978-0803943711.
- 3. TAKING INTO ACCOUNT THE SOCIAL EFFECTS OF COMPETITION BETWEEN PRODUCTS Example of Croatian pig industries Vincent Lagarde, Catherine Macombe CREOP, Institut d’Administration des Entreprises, Limoges (France) Joint Unit ITAP- Cemagref- ELSA, Montpellier (France) Social LCA seminar 5th 6th May 2011- Montpellier
- 4. What is the issue? • Very often, the functioning of one product chain causes important remote effects through other product chains • because both chains are competing or working in synergy Sources: fotosearch
- 5. What is the issue? • Is there a conceptual model to design the Boundaries for social LCA studies, if willing to capture this phenomena ? • What are Economics and Management sciences (strategy) supplying us to design competitive boundaries of SLCA ? Strategy is interested in values generated by firms (among them is the social value). Strategy keeps tools to define the boundaries of firms activities Are they useful in SLCA?
- 6. I- DESIGN of the PERIMETER What is fair perimeter to analyse social effects of competition between products/ firms ? ° - WIDTH OF THE FIELD 11 From macro to firm : Find the good level of analysis of the environment - GENERAL ENVIRONMENT (Pestel) - Too much broad, too far - Affects company, but neither direct exchanges nor reciprocity. - COMPETITIVE ENVIRONMENT - Industry (sector) Firms using similar technology of production : products narrowly substitutable But not always in competition on the same markets Strategy (Porter) chooses this level of analysis to study interactions between firms
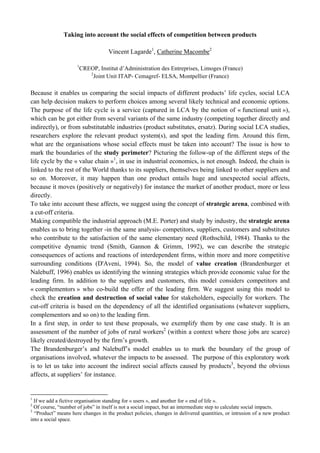
- 7. Traditional model for industry analysis PORTER'S 5 FORCES (1980) Competitive context of an activity or product (SBU) “Five Forces” is a framework for industry analysis and business strategy development : - Analyses competitive structure of one given industry : identify actors Threat Substitutes Buyers Bargaining power Rivalry among competitors - Defines the attractiveness of sector and intensity between firms : - 3 forces 'horizontal' competition: established rivals, substitute products, new entrants; - 2 forces 'vertical' competition: bargaining power of suppliers and bargaining power of customers. Suppliers Bargaining power Threat new Entrants
- 8. • Substitute : products outside the industry (sector), which becomes a competitor in certain circumstances (price, shortage,...) • Entry of new competitors : Profitable markets attract new firms (creation, diversification...) Limits 5 forces model : - sectors are tight, supposed not to cross. - model is static, does not integrate movement and changes in relationships. - connections are limited to competition (# collaboration). - It is not possible to identify layers of performance and value in new environments in networks (Lecocq and Yami, 2005).
- 9. ° - DEPTH OF THE FIELD : VALUE CHAIN 12 • Porter specifies analysis of connections between firms by integrating the relationships of interdependence, generated upstream and downstream, by the value creation (vertical). “Value Chain” (1985) • Value chain describes the full range of activities which are required to bring a product or service from conception, through the different phases of production (combination of physical transformation and inputs from various producer services), delivery to final consumers, and final disposal after use.
- 10. MARGIN Value Chain cuts out (separates) activity of firm in sequences of elementary operations to identify sources (origins) of value creation (and also costs) which create the competitive advantage (Stratégor, 1993)
- 11. USEFULNESS • Seeks where value is created in the firm. • Benchmark: compares with value chain of other firms. • Extend value-chain beyond individual firms : - Locates value chain of one firm in the global value chain of the product, - Applies to whole supply chains and distribution networks (intégrating value created by suppliers and customers) = VALUE SYSTEM (/ added value chain)
- 12. Industry wide synchronized interactions of local value chains create an extended value chain (even through countries) : GLOBAL VALUE CHAIN Gereffi, Humphrey and Sturgeon (2005) study hierarchical relationships and power in Global value chains. They highlight central firms which “control” the rest of the chain by imposing conditions of production (price, quantity, quality). 2 forms frequently met: “buyer driven” chain or “producer driven” chain. • Value chain approach (/ global value chain) is often used in LCA (Life Cycle Assessment).
- 13. LIMITS of VALUE CHAINS : Only linear and vertical relations are taken into account - Focus on circulation of good or service from producer to consumer, and on vertical relations between purchasers and suppliers - Undervalues forms of competition (competitors, substitutes) and collaboration on the same segment (level) of the chain, which are, however, important. (Ponte and Gibon, 2005)
- 14. - The (French) FILIERE • Approaches developed by French institutions of research for the analysis of distribution systems for the agricultural goods. • Present succession of operations which, leaving upstream raw material (or intermediate product) leads downstream, after several stages of transformation/valorization to one or more end products on the level of the consumer : Economic agents units which contribute directly to the development of a finished product. • French economists have built their model on the basis of creative process of the added-value, described by American research, and adapted to the vertical integration of French agriculture (Kaplinsky and Morris, 2000) • This approach insists on flows between companies and on the relationships of dependences and predominance among the various actors of the chain.
- 15. Rice Filière in Thailand (Tallec and Bockel, 2005, FAO) - Producers - traders - mills - transformation industry - wholesalers - consuming retailers and exporters
- 16. °USEFULNESS - Includes concepts value chains and global value chains (and links to Global Commodity Chain) - Particularly recommended for agricultural analysis - Compares respective competitiveness of filières (comparison margins/value) and strategies of the actors (competitors) - Cross several analyses (agents, flows, values, modelled calculations) °Limits - Static - Not broad enough (still vertical analysis, competitors included but without links) - No substitutes
- 17. °13- CROSSING WIDTH AND DEPTH: the STRATEGIC ARENA Concept first proposed by Rotchild (1984), and Bidault (1988) France Arena is the most extensive design of the competing field, namely the unit of the filière (industry) substitutable and complementary which contributes to satisfy the same elementary need. Concept proposed in order to comprehend the elements which are likely, beyond the competitors, to have influences on the behaviours of the company (Bidault, 1988). Arena about food, data processing, transport, energy… Arena allows to identify together, in a relatively exhaustive way, companies and sectors which are in direct competition or indirect competition with various degrees, or likely to become competitors.
- 18. STRATEGIC ARENA Building arena requires to answer 3 key questions: Filière Filière competitor Filière competitor End users 1- Which basic need do the activities (products and services) of the Firm meet ? Customers Competitors 2- Which are the substitutes being able to fulfil this basic need? 3- Which are the filières which correspond to these products and services substitutes? Substitut Substitut Firm Suppliers Industry (Porter) Raw materials Strategic Arena Value chains (activities) Rotchild (1984), Bidault (1988)
- 19. • USEFULNESS Combines advantages of : - value chains - competitive environment (Porter’s Forces model) it is possible to extend the usual comparison between firms (direct competitors) - chains in competition or collaboration (value chains, within filière), with the indirectly concurrent filières by substitutes. Main limits : - Static - Links are simple (# networks)
- 20. II- THE ACTUATION OF THE FIELD: COMPETITIVE DYNAMICS New research school (1990) tries to explain actual competitive context and strategic movements (and interactions ) (Grimm et Smith, 1992 -1997) New competitive landscape results in an increased competition, characterized by speed, flexibility and innovation in reaction to the fast changes of the environment. (Bettis et Hitt, 1995) Strategies are dynamics : actions reactions competitors (Hoskisson et al. 1999)
- 21. • Competitive advantage (Porter) is only temporary (Langley 1997) • “Hypercompétition” (D' Aveni, 1995) : Autodestructive competition, where strategy is a perpetual race towards next source of temporary competitive advantage. • Competitive interaction (interdependence) : - Dyadic Competitive Interaction : action/reaction - Multimarket competition / Multipoint Rivalry suicide war or collusive behaviour (or coopetition)
- 22. • - COOPETITION (coopertition) Neologism coined to describe cooperative-competition Coopetition occurs when competitors companies work together for some parts of their business where they think they have no competitive advantage and where they believe they can share common costs. J-V PSA -Toyota sharing components for city car (Peugeot 107, Toyota Aygo, Citroën C1). Companies save money on shared costs while remaining fiercely competitive in other areas.
- 23. Co-opetition Model : the VALUE NET (Brandenburger et Nalebuff 1996) • Co-opetition model provides a framework to identify and explain the underlying mechanisms in a firm’s environment, and how these mechanisms can be changed to the firm’s advantage. Brandenburg and Nalebuff identified 4 types of players that any company faces:
- 24. Main academic contribution : identification and justification of the role played by COMPLEMENTORS. Business makes more than competing for market share in the current market. “A player is a complementor if customers value your products more when they have that player’s product, than when they have your product alone” (Brandenburger and Nalebuff 1996) Other firms independently make products or services that increase your offerings’ value to mutual customers Most companies benefit from complementors : - Nitendo’s domination in video games industry in 90’s/ complementors = games developers. - Digital-camera / home photo printers - Microsoft /McCaffy - Intel / Inside ! A single player can have more than one role simultaneously. A player can even be both competitor and complementor at the same time.
- 25. Value-net link between filières (value chain) ? Our proposal Boundaries ? to take into account social effects of competition between products : Filière Filière Filière (value chain) the COMPETITIVE PERIMETER of SLCA
- 26. Competitive perimeter of SLCA Main Filière Filière Competitor Other Filière End users Customers Value Net Company Substitut Suppliers Industry Strategic Arena width Complementor depth
- 27. TAKING INTO ACCOUNT THE SOCIAL EFFECTS OF COMPETITION BETWEEN PRODUCTS III- EXAMPLE OF CROATIAN PIG INDUSTRIES
- 28. Agriculture in Croatia 4 400 000 inhabitants Process of integration to EU going on 45% population lives in rural areas Agriculture plays an important role in economy (about 7 % of Croatian GDP) and above all in employment: 100 000 persons are officially employed in agro-food sector. 449 896 holdings (average 2,4 ha) in 2003, among them 300 000 units < 2 ha 190 672 registred farms (average 5,28 ha) in 2009
- 29. The five counties with pigs farms Long tradition in pig farming : 33% in livestock production 31 845 small producing units 76% of pigs are kept on small family properties 75% family farms keep up to 5 sows Croatia imports piglets and pork meat County with high Pig production Main city in the North Source: Wikipedia The counties of Croatia
- 30. Characteristics of the three Croatian pig systems Part-time family farms N=7 Full-time family farms N=6 Number of breeding sows on farm 2.0 +- 1.7 43.2+-32.1 100 and 1350 Number of pigs on farm (excluding piglets) 1 to 8 12 to 590 100 to 12 000 Farm size 4.3 +-5.2 42.2+-44.3 Not relevant Number of labour units (full time equivalent) 3.0 +-2.2 3.0+-0.8 7.0+-5.5 14 71 15 83 17 0 50 25 25 Feed origin (%) -on farm -off farm/purchased -unknown Source: from Wellbrock et al. (2009, page 29) Farm enterprises N= 4
- 31. 3 Photos: The PigSite News Desk, 26/02/2008 Photo: Animal Friends Croatia Pig Farm Zdravko Skarec’s new 1,120-pig finishing farm at Polonje, Croatia. It complies with EU specifications for pig production. Photo: USAID/anne Marie DiNardo Anton Hetmanek at his pig farm in Croatia, 11/05/2009 www.usaid.gov/stories/croatia/fp_croatia_pig.html - Each new building has 16 pens. They are environmentally controlled and use the PigNic automatic feeding system
- 32. A possibility ? To comply with EU production (economic, ecologic) standards X 19 nucleus farms « Pig Production Development programme » (2005) Best than current pig farming situation from economical and ecological points of view 250 new pig farms (150 sows each) Expected social effects: « pigs smallholders would disappear… affected farmers could switch to other Activities such as ecological production or fruit production » (from Wellbrock et al., 2010) 73 fattening units
- 33. Why assessing the number of rural jobs involved in the change ? Unemployment remains one of the key economic problems : est. 17,6% in 2011 ( from CIA World Factbook) and especially in rural areas. Rural people are poorer, older, and more often women than urban people. « The significant decline in agricultural employment is due to increasing rural-urban migration and declining labour opportunities in the sector » (Arcotrass, 2006) Modifying sectors on societal level, which has an influence on how unemployment impacts the individual, and state for Croatian society Modifying factor identifiable on societal level Level unemployment society of in State of the factor for Croatian society as a whole State of the factor for the rural areas Key economic problem Declining labour opportunities in agriculture Health and pension system 31 099 unpaid family workers have been accounted for (2001). Labour market programmes Benefit system for official workers Against discrimination (2010) Benefit system for official workers Not for unpaid family workers Level of social security to increase income Social assistance up to subsistance level per family Social inclusion programme (2011) Jobs are gaining more and more social value, especially in rural areas.. Smallholders can receive income support, and apply for rural development schemes. Level of security social Source of modifying factors: from Jorgensen et al., 2010, page 381
- 34. Our aim is assessing the gain/loss of rural jobs by functional unit, if the Pig Production Development programme was implemented. The functional unit = pig meat delivered by one new farm of 150 sows. Photos: Fotosearch
- 35. Two different ways to set the border of the system The 250 new pig farms stands for the principal firm leading the system There is no « consumer stage » nor « end-of-life » assessment. 19 nucleus farms 250 new farms 73 fattening units System 1 slaughterhouses -One classical way is picturing the social life cycle like the « value chain » lead by the 250 new firms Meat processing retailers -Another way is picturing the « Competitive perimeter » around the 250 new firms customers competitors 250 new complementors farms System 2 suppliers
- 36. Using the value-chain to describe the organisations linked by « services » State Banks Extension services 250 new pig farms 73 fattening units Energy supplier Foreign breeders Import companies Feed stuff suppliers (Additives) Foreign machinery and equipment Import companies slaughterhouses 19 nucleus farms mastering subsidies Meat processing retailers Supermarkets hypermarkets Short term trade input companies System 1
- 37. Calculating the rural jobs gain of system 1 Organisations included in the Plan chain Comments Implementation of the cut-off criteria and number of rural jobs created/functional unit State services Subsidies (direct payments, to investments and rural development), veterinary services, Extension services As the main issue is European compliance of slaughterhouses, the State services are not depending on the Plan farms. 9 Croatian Banks They would likely provide funding for new units It is a very new field for Croatian banks, as they don’t really fund agriculture to date. They don’t depend on the Plan farms. Equipment (troughs, water places…) and farm machinery (tractors…) suppliers All the facilities would be imported Not dependent of the plan Energy supplier National operator electricity (HEP) One supplier of gas (INA) Not dependent of the Plan Short-term trade input companies They would provide “additives” to plan farms, and short-term leans. They are delivering feedstuffs for rabbits and poultry also, and are in synergy with the Plan. Feedstuff inputs They are included in the farms works, except additives. For poultry also, not dependent of the plan 19 Nucleus farms supplying breed sows and boards Created from nothing Depending of the plan 0,15 qualified rural jb/fu 250 new farms (rearing piglets) and Creating from nothing Depending on the plan 1,65 qualified rural job/fu 73 fattening units (for pigs) Creating from nothing Depending on the plan Jobs Included above Slaughterhouses and processing meat facilities 196 slaughterhouses and 800 meat processors to date. Depending on the Plan. The equivalent of 120 slaughterhouses and 480 meat processors would increase their capacity 11 jobs/fu Removing unit of the corps of animals Only one for whole Croatia Plan farms would manage it by their own Supermarket and hypermarket They move their capacity according to their customers, not regarding the meat supply. Not dependent of the Plan. 13 qualified rural jobs gain/one new farm (250 sows) System 1
- 38. Using Competitive perimeter to describe organisations linked by services +complementors /competitors Competitors filières Pig Meat import companies customers Supermarkets hypermarkets Complementors filières Meat processing slaughterhouses Pig part-time family farms Pig Full time family farms and Entreprise farms Poultry Industry Red meat industry Tourism industry Pig Entreprise farms 73 fattening units Foreign pig units Poultry entreprises Industry 250 new pig farms Banks Foreign machinery and equipment Import companies 19 nucleus farms Energy supplier Feed stuff suppliers (Additives) Foreign breeders Import companies Short term trade input companies System 2
- 39. Calculating the rural jobs gain/loss of system 2 The dominant effect is competition between the Plan and the pig full-time family farms ! Current full time family farm pig industry Planned pig industry The set up of one new enterprise farm of 150 sows would destroy: The set up of one new enterprise farm of 150 sows would create: In average Within the farm enterprise farm or In average jobs of people working on 3,5 family farms (42 sows, fattening and crops) 10,5+-2,8 labour units (full time equivalent) Create Feed supply Jobs of people linked with purchased feedstuff Not relevant Jobs linked with purchased feedstuff Not relevant Breeding sows and boards supply Jobs linked with purchased animals Not relevant, exchanges between farms. Jobs created in the nucleus farm for 150 sows Need 37,5 new sow/year, so 37,5/493 sows produced in one nucleus farm, so 37,5/493 x 2 jobs = 0,152 jobs. Slaughterhouses and meat processors Jobs linked to overcapacity because seasonality 1 job X ½ slaughterhouse + 1/2 job X 2 meat processors. Jobs linked with 2 400 non seasonal replacing seasonal heads. No new job created + 1,8 skilled rural jobs gain/one new farm (250 sows) - 12 rural jobs (whose some unpaid workers) jobs of people working on the enterprise farm (including crops and fattening units) 1,65 jobs System 2
- 40. Calculation of thresholds • Is there a threshold in the number of full-time family farm pig activities being replaced by the Plan? • The capacity of the Plan is 150 farms x 250 sows x 16 pigs/sow/year = 600 000 pigs/year • The capacity of the pig full time family farms is 1 095 farms x 42 sows x 15 pigs/sow/year = 689 850 pigs/year
- 41. Conclusion • Crossing strategic arena and Value Net for the representation of the competitive perimeter in social LCA delivers useful insights about all the organisations cooperating or competing with the main firm’s filière. • It helps setting bounderies of the relevant system to put under scrutiny when: – Competing/coopering chains of products are at stake – The indirect effects of the chain are more (or as much) important than the direct ones
- 42. REFERENCES • • • • • • • • • • • • • • • • BETTIS R., HITT M.A., 1995, « The New Competitive Landscape », Strategic Management Journal, vol. 16 (Summer Special issue), p7-19. BIDAULT F., 1988, Le Champ stratégique de l'entreprise - Paris, Economica, 365p. CHEN M.J., SMITH K.G. & GRIMM C.M., 1992, « Action Caracteristics as Predictors of Competitive Responses », Management Science, vol. 38, n° 439-453. 3: D’AVENI R.A., 1994, Hypercompetition, Free Press; 1 edition (March), 448p GEREFFI G., HUMPHREY J., STURGEON T., 2005, “The Governance of Global Value Chains”, Review of International Political Economy, 12 (1): 78-104. GRIMM C.M., SMITH K.G., 1997, Strategy as Action, South-Western College Publishing. HOSKISSON R.E., HITT M.A., Wan W.P. & Yiu D., 1999, « Theory and Research in Strategic Management », Journal of Management, vol. 25, n°3: 417-456. KAPLINSKY, R. and MORRIS, M., 2000, ‘A Handbook for Value Chain Research’, prepared for the IDRC, Institute of Development Studies: Sussex, 113p LANGLEY A., 1997, « L’étude des processus stratégiques : défis conceptuels et analytiques », Management International, vol. 2, n°1 37-50 LECOCQ X., YAMI S, « L'analyse stratégique et la configuration de valeur », Revue française de gestion, 2004/5 no 152, p. 45-65. DOI : 10.3166/rfg.152.45-66. NALEBUFF B., BRANDENBURGER A., 1997, “Co-opetition: Competitive and Cooperative Business Strategies for the Digital Economy”, Strategy & Leadership, 25 (6): 28-35. PONTE S., GIBON P., 2005, “Quality Standards conventions and the governance of global value chains”, Economy and Society, 34 (1): 1-31. PORTER, M., Competitive Strategy , Free Press, New York, 1985. PORTER, M.E., 1979, How Competitive Forces Shape Strategy, Harvard business Review, March/April. ROTHSCHILD W.E., 1984, How to gain (and maintain) the competitive advantage in business. Mc Graw Hill, NewYork, 227p. TALLEC F, L BOCKEL, 2005, L’approche filière : Analyse fonctionnelle et identification des flux, FAO, EasyPol module 043, www.fao.org/tc/easypol, 24p