SlideShare uma empresa Scribd logo
1 de 20
Baixar para ler offline
Burke-Leslie Professional                                                                                  407-562-1861
Asset Management, LLC.                                                                                     jleslie@burke-leslie.com
801 International Parkway                                                                                  wburke@burke-leslie.com
Lake Mary, FL 32746


                                     A PRIL M ARKET N OTES


JOHN LESLIE’S BRIEF MARKET ANALYSIS                                                                                      April 2011


            U.S. Economy and Markets Move Ahead                                                         I NSIDE THIS ISSUE :

       After a rough start, March               prices. U.S. Consumer Confi-                            B ULL —B EAR           2
Madness prevailed as the major                  dence fell slightly in March ac-
                                                                                                        M ARKET D ATA          4
indexes closed the quarter with                 cording to the Conference Board
the strongest gains in more than                as did the Michigan Sentiment                           C ALENDAR              5
10 years. The economy contin-                   index. Housing continues to lag
ues to show steady improve-                     other sectors as Construction                           M AJOR M KTS           6
ment with the notable exception                 spending fell again in February
                                                                                                        S ECTOR P ERF          11
of housing. Nonfarm payrolls                    to the lowest level since 1999.
came in above expectations at                   New Home sales fell 16.9% to                            F IXED I NCOME         14
216,000. The unemployment                       the lowest level on record
rate fell again for the fourth                  (1963) while sales of existing                          C OMMODITIES           17

straight month to 8.8%. That’s                  homes showed a similar decline
the lowest level in two years.                  (9.6%). But both of these indi-
These numbers can be a little                   cators can be quite volatile and
confusing as fewer workers are                  subject to revision.                                    Market Trends
reentering the job market sug-                                                                          Short Term MTI
                                                Global markets rebounded in
gesting they don’t see much                                                                             Bearish
promise of jobs. But the trend                  March suggesting a continuation
                                                                                                        Intermediate Trend
is clearly positive. The manu-                  of the global recovery. April and                       Bullish
facturing sector continued to                   May are seasonally favorable                            Long Term Trend
show strength as the Institute                  months for the equities markets.                        Bullish
of Supply Management (ISM)                      There are still clouds on the ho-
index declined in March to 61.4.                rizon, but the market has been
(A reading above 50 indicates
                                                climbing the wall of worry thus
expansion, below 42 reces-
sions). Manufactures drew                       far. Both the Bulls and the
down inventories as all 18 in-                  Bears state their case on page
dustries reported paying higher                 2. And yes, it is Tax Time!


        April Notes are offered for information purposes only and do not constitute any offer to buy or sell any securities.
THE BULL AND BEAR STORY

Every time someone buys a stock, someone else is selling it. It’s safe to assume that
what one investor views as an new opportunity, another views as quiet differently. This
is what makes an auction market. Viewing the same economic data, analysts and inves-
tors often come to very different conclusions. That’s never more apparent than now
when the major market averages have essentially doubled from the March 2009 low.
So where are you, bullish or bearish?


                                 The Bulls view the economic environment as very positive. Af-
                                 ter all, interest rates are still very low. The 2 year T-Notes
                                 are yielding only .8%, the 10 year is 3.45% and the 30 year T-
                                 Bond is 4.48%.
                                 The unemployment rate is falling, now 8.8% and the econ-
                                 omy is finally creating new jobs.
                                 The Purchasing Manager’s Index (PMI) points to an expansion
                                 of manufacturing. And retail sales continue to improve.


Corporate earnings are expected to come in strong for 2011. The estimated price
earnings ratio (P/E) for stocks are estimated (by Bank of America analysts) to come in
at 14 for 2011 and 13 for 2012. From a historical perspective, the market is not over-
valued.
The Federal Reserve is clearly in an accommodative mood. Even though QE II ends in
June, the FED is committed to economic growth and a higher inflation rate.
The bulls view this data as very encouraging, and believe the stock market has lots of
room to go higher from here. Cash then, is trash.


     April Notes are offered for information purposes only and do not constitute any offer to buy or sell any securities.
THE BULL AND BEAR STORY —P ART 2


The Bears have a different take on the data. The unem-
ployment trend is down, but the real unemployment
rate is much higher than 8.8%. According to the Wall
St. Journal, “There are still 13.5 million people who
would like to work, but can’t get a job.” The broader U-
6 unemployment rate includes those who are marginally
attached to the labor force. That number continued to
decline but still remains at 15.7%.
They question what will happen when the FED stops
flooding the economy with money (quantitative easing)
in June.
Bears worry about the current political unrest in the Mid-
dle East and North Africa (MENA), the sovereign debt cri-
sis in European Union, and the fallout from the natural disasters in Japan.
They are concerned about the growing federal debt service obligation, and the current
focus on cutting government spending. What will the fallout be on the economy?
They are concerned about the ramifications of the large budget deficits, and the sliding
U.S. dollar. If the dollar falls so low that it is no longer the global currency, what hap-
pens to the cost of doing business in the global economy?
Commodity prices continue to climb, in part because of the falling dollar. Will higher
prices be inflationary pushing up the cost of retail goods? Will the FED be forced to
raise interest rates? How will the housing market respond to higher interest rates? Is
there a possibility of a double dip in housing prices?
“The Bears acknowledge that Bull markets climb a wall of worry … but today’s wall of
worry is one of the highest and most daunting in years” according to Mark Huard. The
Bears conclude that lower prices are around the corner.


     April Notes are offered for information purposes only and do not constitute any offer to buy or sell any securities.
Market Data


April Notes are offered for information purposes only and do not constitute any offer to buy or sell any securities.
Economic Calendar


______________________________________________________________________________________


                                                                                SEASONALITY
                                                          For the past 10 years, April has been a sea-
                                                          sonally favorable month for the Dow Jones
                                                          Industrial average. The index has been up
                                                          almost 67% of the time with an average gain
                                                          of 2.1%.


    April Notes are offered for information purposes only and do not constitute any offer to buy or sell any securities.
Major Market Indexes
The S&P and DJI indexes remain in bullish                        main in positive longer term trends.
trends, albeit bearish wedge patterns. Last
                                                                 Given the strong price performance since last
week’s Mid-East turmoil pushed energy prices
                                                                 August, a pull-back or “correction” would be
higher, and the indexes lower but they did
                                                                 both expected and healthy. In our opinion,
NOT break below support.
                                                                 we have completed two of an anticipated
The NASDAQ Composite and Transportation                          three wave cyclical bull market.
Indexes have broken below the prior pivot
                                                                 Given the current geopolitical events, we are
low, so price is below the Trend Bar (black
                                                                 alert to the possibility of increased volatility.
line) and now negative on an intermediate
                                                                 However, news does not normal affect the
term. The Transportation companies have
                                                                 longer term price trends. Ultimately, price is
been hurt by rising energy and commodity
                                                                 the best “indicator” and we monitor those
prices. Both of these indexes, however, re-
                                                                 trends daily. Don’t ever panic.


       April Notes are offered for information purposes only and do not constitute any offer to buy or sell any securities.
Major Market Indexes


The major indexes traded lower in early March in what appeared to be the beginning of a
correction. But price reversed mid month to rally an impressive 700 Dow points.
The S&P has rallied to within a few points of its bull market high. Seasonality factors favor a
continuation of the positive trend. Momentum indicators are bullish on both daily and
weekly time frames. Viewing 10 color coded technical indicators, green for positive/red for
negative signals, the index turned bullish the week of September 13th.


       April Notes are offered for information purposes only and do not constitute any offer to buy or sell any securities.
Major Market Indexes
The bearish “wedge” pattern broke down in February taking price to the 1250 area. The re-
versal off 1250 created the support trend line. The Index is now in a positive channel with
an up-side target above 1400. There is no assurance it will reach that technical target, but
the trend is clear.


The same pattern is manifest in the Dow Jones Industrial Average. The trend line resistance
is in the range of 13000.


       April Notes are offered for information purposes only and do not constitute any offer to buy or sell any securities.
Major Market Indexes


Market Breadth Indicators are positive including:


                                                                                        New York Stock Exchange
                                                                                        Advance vs. Declining Issues.
                                                                                        (More stocks are advancing
                                                                                        than are declining.)


                                                                                        New York Stock Exchange
                                                                                        New Highs vs. New Low
                                                                                        (There are many more stocks
                                                                                        making new highs than are
                                                                                        making new lows.)


       April Notes are offered for information purposes only and do not constitute any offer to buy or sell any securities.
Major Market Indexes


The New York Stock Exchange Bullish Percent Index records the number of stocks with bull-
ish “point and figure” buy signals. The indicator has confirmed the new bullish trend in Sep-
tember, the correction in February, and the resurgence of positive price movement in late
March.
The near term sentiment, momentum, and price patterns are in positive trends. But with the
many unresolved global challenges, it’s important to avoid complacency.


                                                                                        Negative crossing


                                                                                                        Positive crossing


        April Notes are offered for information purposes only and do not constitute any offer to buy or sell any securities.
SECTOR PERFORMANCE


April Notes are offered for information purposes only and do not constitute any offer to buy or sell any securities.
SECTOR ETFs
Relative strength is a measure of the relationship of price performance between a
stock/ETF and another stock/ETF in the same category, against an index or against the
broad market. For our Sector ETF analysis, we are measuring strength between the
Sector ETF and the S&P 500.
Robert Colby’s long term relative strength ratings are listed in descending order of
strength:
   Energy — Bullish: relative strength further above 2 year highs.
       Limited storage issues may push oil futures lower in the near term as trades can-
       not accept delivery. But the continued instability in MENA (Mid-east, north Af-
       rica), the global economic recovery and growing demand point to higher prices
       in the intermediate term.
   Industrials—Bullish: relative strength back above 12 year highs.
       Manufacturing is improving according to the latest ISM data, and growth could
       actually be stronger than anticipated. But the overall view is neutral due to fiscal
       restraints, Asian monetary policy, and a rollover of the orders/inventory ratio
   Materials— Bullish: relative strength rose above 6 week highs
       Materials continues to move with the overall market with a positive trend.
       Higher commodity prices can put a damper on growth however.
   Consumer Discretionary—Neutral: relative strength in trading range.
       As we enter the later stages of the economic expansion, this sector become more
       vulnerable to pricing pressure. With limited pricing power to offset costs, the
       sector remains a neutral.
   Technology—Bearish: 50 period moving average of relative strength crossed below
   the 200 moving average. Absolute price is neutral.
       Still recovering from the market correction, an improving economy will boost
       tech sales and bottom line. Financials are solid and the sector is rated neutral.
   Health Care— Neutral: relative strength back up to neutral
       This beaten down group has climbed back into the neutral area. There are still
       issues with health care reform which could limit profits. But low valuations re-
       main attractive.
   Financial—Bearish: relative strength fell below three month lows. Absolute price
   broke down below 10 week lows.
       Housing, the related mortgage market and new capital requirements will create a
       drag for this sector, while higher interest rates and the ability to begin or in-
       crease dividends point to stronger performance. Still a market performer, but an
       improving sector.
   Consumer Staples— Neutral: relative strength neutral but weakening
           While traditionally a defensive sector, prices are improving with the economic
           recovery. But rising commodity costs are putting a ceiling on margins. The
           sector remains a weak neutral rating.


     April Notes are offered for information purposes only and do not constitute any offer to buy or sell any securities.
Utilities— Bearish: relative strength fell below prior 2 week.                             Absolute price is neutral.
While relative performance puts utilities at the lowest range of the sectors, low bond yields
and high utility stock dividends have attracted buyers. The potential fallout from the Japa-
nese nuclear incidents and the risk of additional regulatory response keeps a cloud over this
sector. It’s neutral now, but vulnerable to a further downgrade.


     Absolute price performance for major sectors, for both 1 month and
                                 3 months


       April Notes are offered for information purposes only and do not constitute any offer to buy or sell any securities.
FIXED INCOME

Both the 10 and 30 year Treasury’s rallied in February to challenge resistance. Both were
turned back. Inflation and interest rate fears are pushing yields higher and bond prices
lower. There is great uncertainty on the horizon as Congress has yet to resolve the debt
ceiling. House Speaker Boehner is quoted as saying that “any increase in the debt ceiling
cannot and should not pass without spending cuts and reforms.” According to JP Morgan
analysts, “while it’s almost certain the Congress will eventually raise the debt ceiling in
tome for Treasury to avoid a default, a game of chicken that delays this decision in to June
is a clear negative for Treasuries.”
Walmart CEO Bill Simon recently announced that inflation “is going to be serious. We’re
seeing cost increases starting to come through at a pretty rapid pace.” Because of their
fixed payouts, bond prices do not perform well in times of increased inflation.
Bonds, like the U.S. equities markets, are at a critical point. If price breaks below the sup-
port levels (below), it would suggest that the bond market has a growing anticipation of
higher inflation (and interest rates). Both have negative implications for any fixed income
investments.


      April Notes are offered for information purposes only and do not constitute any offer to buy or sell any securities.
INTERMARKET RELATIONSHIPS
   The relationship between bonds, commodities, the U.S. dollar and the stock market


       Intermarket relationships are key to understanding economic cycles. Generally
       speaking:

           Bond prices and commodities trend in opposite directions;
           Bonds usually trend in the same direction as stocks. Any significant divergence
           warns of a possible reversal in stocks.
           A falling dollar will eventually cause commodity prices to rally which in turn will
           have bearish implications for bonds and stocks.
       Falling interest rates pull the dollar lower. With the falling dollar, we initially have fal-
       ling commodity prices. As interest rates are falling, bond prices and later stock prices
       rally. [There are periods of time when these relationships are in transition, and even
       occasionally, reverse]. Eventually, the falling dollar pushes commodity prices higher.
       Rising commodity prices pull interest rates higher and bond prices lower. The lower
       bond market eventually pulls the stock prices lower. Rising interest rates start to pull
       the dollar higher, and the bullish cycle starts all over again.1


Intermarket Technical Analysis, John J. Murphy, 1991

        April Notes are offered for information purposes only and do not constitute any offer to buy or sell any securities.
The U S Bond ETF ($USB) follows the U S dollar in the below chart.


Stock and commodity prices are currently moving together. Here is a comparative
view of the Commodity Research Bureau (CRB) index and the S&P 500 ($SPX).


Do you notice anything funny about the relationship between the CRB and the broad
stock market?
Remember our initial tenet: commodities and stocks should not be moving in the
same direction. This suggests an unhealthy market. It is impossible to know which
market will change to reestablish the normal relationships, or even when. But clearly,
caution is advised.


April Notes are offered for information purposes only and do not constitute any offer to buy or sell any securities.
COMMODITY MARKETS
The dollar traded down to support at $76 and bounced briefly. Momentum indicators are
still negative suggesting the dollar might retest the 75.81 lows in the near term. There is a
great deal of technical support just beneath the current price. If that support is broken, the
dollar is vulnerable to much lower prices.


     WEEKLY CHART


      DAILY CHART


       April Notes are offered for information purposes only and do not constitute any offer to buy or sell any securities.
Gold remains in a bullish trend, but as yet unable to break through resistance at $1450.
Support is the lower trend line. While the consensus is that gold will move up from this
range and perhaps challenge the $ 2000 level. However, until the resistance level is vio-
lated, gold may continue to consolidate around 1430


Copper prices broke above resistance near the 4.70 target, but quickly fell back down into
the trading range. Price broke below the intermediate term trend line, and has made a se-
ries of lower highs and lower lows. Trend is now negative in this economic bell weather.


        April Notes are offered for information purposes only and do not constitute any offer to buy or sell any securities.
Crude oil prices briefly dropped below the intermediate trend line, but quickly rallied to
close the week at 107.07. The trend remains bullish while crude oil inventories are quite
high. The March 30th EIA (Energy Information Administration) inventory report shows
Cushing storage at a record 41.9 million barrels. The maximum capacity is 44 million. U.S.
supplies overall rose to 355.7 million.


There is an increased focus on Natural Gas as an alternative to nuclear energy. But large
inventories continue to hold price down. The trend is positive, but within a larger price
range (consolidation). Until price moves above the prior price high (pivot), NG is neutral.


       April Notes are offered for information purposes only and do not constitute any offer to buy or sell any securities.
DEBT CLOCK


Burke -Leslie, LLC, is a registered investment advisor (RIA) with the SEC. The information contained within is neither a solici-
tation nor an advertisement for any investment. The articles and information provided are for the benefit of our clients and are
not an offer to purchase or solicit any mentioned investment. Opinions expressed about any security mentioned in this newslet-
ter may change at any time and Burke-Leslie, LLC maintains no duty or obligation to update information as changes occur.
While every effort is made to ensure accuracy of the articles published herein, we are not liable for any inaccuracies.


          April Notes are offered for information purposes only and do not constitute any offer to buy or sell any securities.

Mais conteúdo relacionado

Mais procurados

World Wealth Report 2008
World Wealth Report 2008World Wealth Report 2008
World Wealth Report 2008Claudio Diniz
 
ATM summer (May) 2006
ATM summer (May) 2006ATM summer (May) 2006
ATM summer (May) 2006Greg Meier
 
Weekly Market Commentary June 1, 2010
Weekly Market Commentary June 1, 2010Weekly Market Commentary June 1, 2010
Weekly Market Commentary June 1, 2010melaniebroad
 
November 2012 Commentary
November 2012 CommentaryNovember 2012 Commentary
November 2012 CommentaryMartin Leduc
 
Finlight Research - Market Perspectives - Oct 2014
Finlight Research - Market Perspectives - Oct 2014Finlight Research - Market Perspectives - Oct 2014
Finlight Research - Market Perspectives - Oct 2014Zouheir Ben Tamarout
 
The IBR India Newsletter
The IBR India NewsletterThe IBR India Newsletter
The IBR India NewsletterIBR_India
 
Update October 2010
Update October 2010Update October 2010
Update October 2010Martin Leduc
 
Business Week Online
Business Week OnlineBusiness Week Online
Business Week OnlineCourtneyJSK
 
Putnam Fixed Income Outlook q313
Putnam Fixed Income Outlook q313Putnam Fixed Income Outlook q313
Putnam Fixed Income Outlook q313Putnam Investments
 
The Global Economy No. 5 - August 7, 2012
The Global Economy No. 5 -  August 7, 2012The Global Economy No. 5 -  August 7, 2012
The Global Economy No. 5 - August 7, 2012Swedbank
 
BlackRock: 2014 Outlook The List - What to Know, What to Do
BlackRock: 2014 Outlook The List - What to Know, What to DoBlackRock: 2014 Outlook The List - What to Know, What to Do
BlackRock: 2014 Outlook The List - What to Know, What to DoEcon Matters
 
The Global Economy – No. 8/2010
The Global Economy – No. 8/2010The Global Economy – No. 8/2010
The Global Economy – No. 8/2010Swedbank
 

Mais procurados (16)

World Wealth Report 2008
World Wealth Report 2008World Wealth Report 2008
World Wealth Report 2008
 
October Newsletter
October NewsletterOctober Newsletter
October Newsletter
 
ATM summer (May) 2006
ATM summer (May) 2006ATM summer (May) 2006
ATM summer (May) 2006
 
Weekly Market Commentary June 1, 2010
Weekly Market Commentary June 1, 2010Weekly Market Commentary June 1, 2010
Weekly Market Commentary June 1, 2010
 
May en lvrec
May en lvrecMay en lvrec
May en lvrec
 
November 2012 Commentary
November 2012 CommentaryNovember 2012 Commentary
November 2012 Commentary
 
Finlight Research - Market Perspectives - Oct 2014
Finlight Research - Market Perspectives - Oct 2014Finlight Research - Market Perspectives - Oct 2014
Finlight Research - Market Perspectives - Oct 2014
 
The IBR India Newsletter
The IBR India NewsletterThe IBR India Newsletter
The IBR India Newsletter
 
Update October 2010
Update October 2010Update October 2010
Update October 2010
 
Business Week Online
Business Week OnlineBusiness Week Online
Business Week Online
 
Putnam Fixed Income Outlook q313
Putnam Fixed Income Outlook q313Putnam Fixed Income Outlook q313
Putnam Fixed Income Outlook q313
 
Jan 2012
Jan 2012Jan 2012
Jan 2012
 
The Global Economy No. 5 - August 7, 2012
The Global Economy No. 5 -  August 7, 2012The Global Economy No. 5 -  August 7, 2012
The Global Economy No. 5 - August 7, 2012
 
BlackRock: 2014 Outlook The List - What to Know, What to Do
BlackRock: 2014 Outlook The List - What to Know, What to DoBlackRock: 2014 Outlook The List - What to Know, What to Do
BlackRock: 2014 Outlook The List - What to Know, What to Do
 
The Global Economy – No. 8/2010
The Global Economy – No. 8/2010The Global Economy – No. 8/2010
The Global Economy – No. 8/2010
 
Putnam Outlook Q3 2013
Putnam Outlook Q3 2013Putnam Outlook Q3 2013
Putnam Outlook Q3 2013
 

Destaque

Carlos Chica. Agua y Energía
Carlos Chica. Agua y EnergíaCarlos Chica. Agua y Energía
Carlos Chica. Agua y EnergíaiAgua .es
 
USA Today 2012 Group Presentation
USA Today 2012 Group PresentationUSA Today 2012 Group Presentation
USA Today 2012 Group Presentationmduthie
 
Αξιολόγηση Ελληνικών Πανεπιστημιακών Τμημάτων Εκπαίδευσης με τη Χρήση του Goo...
Αξιολόγηση Ελληνικών Πανεπιστημιακών Τμημάτων Εκπαίδευσης με τη Χρήση του Goo...Αξιολόγηση Ελληνικών Πανεπιστημιακών Τμημάτων Εκπαίδευσης με τη Χρήση του Goo...
Αξιολόγηση Ελληνικών Πανεπιστημιακών Τμημάτων Εκπαίδευσης με τη Χρήση του Goo...Panagiota Altanopoulou
 
Opinion essay unit4 [e doc_find.com]
Opinion essay unit4 [e doc_find.com]Opinion essay unit4 [e doc_find.com]
Opinion essay unit4 [e doc_find.com]berkeleynec
 
Oportunidades de negocio en el sector agua
Oportunidades de negocio en el sector aguaOportunidades de negocio en el sector agua
Oportunidades de negocio en el sector aguaiAgua .es
 
Captain vineyards of Moraga
Captain vineyards of Moraga Captain vineyards of Moraga
Captain vineyards of Moraga susancaptain
 
Plan Técnico para el Aprovechamiento de los Recursos Hídricos Alternativos en...
Plan Técnico para el Aprovechamiento de los Recursos Hídricos Alternativos en...Plan Técnico para el Aprovechamiento de los Recursos Hídricos Alternativos en...
Plan Técnico para el Aprovechamiento de los Recursos Hídricos Alternativos en...iAgua .es
 
Ph d progress_1st_year 2012_2013-Wikis in education
Ph d progress_1st_year 2012_2013-Wikis in educationPh d progress_1st_year 2012_2013-Wikis in education
Ph d progress_1st_year 2012_2013-Wikis in educationPanagiota Altanopoulou
 
Silabus elemen mesin_i
Silabus elemen mesin_iSilabus elemen mesin_i
Silabus elemen mesin_iButo Ijo
 
Patricio Andres Gallardo Cortes. Soluciones tecnológicas para la industria mi...
Patricio Andres Gallardo Cortes. Soluciones tecnológicas para la industria mi...Patricio Andres Gallardo Cortes. Soluciones tecnológicas para la industria mi...
Patricio Andres Gallardo Cortes. Soluciones tecnológicas para la industria mi...iAgua .es
 
Miniproject of research by Samuel Rodriguez Perez, from Mexico[1]
Miniproject of research by Samuel Rodriguez Perez, from Mexico[1]Miniproject of research by Samuel Rodriguez Perez, from Mexico[1]
Miniproject of research by Samuel Rodriguez Perez, from Mexico[1]Samuel Rodríguez Pérez
 
Keeping up with_the_yankees
Keeping up with_the_yankeesKeeping up with_the_yankees
Keeping up with_the_yankeesiammkstevens
 
Gestión de recursos hídricos en Brasil
Gestión de recursos hídricos en BrasilGestión de recursos hídricos en Brasil
Gestión de recursos hídricos en BrasiliAgua .es
 
Silabus mata kuliah elemen mesin
Silabus mata kuliah elemen mesinSilabus mata kuliah elemen mesin
Silabus mata kuliah elemen mesinButo Ijo
 
panduan-folio-jahitan
panduan-folio-jahitanpanduan-folio-jahitan
panduan-folio-jahitanolive_alive
 

Destaque (19)

Carlos Chica. Agua y Energía
Carlos Chica. Agua y EnergíaCarlos Chica. Agua y Energía
Carlos Chica. Agua y Energía
 
Unidade c tic - diapositivos - word
Unidade c   tic - diapositivos - wordUnidade c   tic - diapositivos - word
Unidade c tic - diapositivos - word
 
USA Today 2012 Group Presentation
USA Today 2012 Group PresentationUSA Today 2012 Group Presentation
USA Today 2012 Group Presentation
 
Αξιολόγηση Ελληνικών Πανεπιστημιακών Τμημάτων Εκπαίδευσης με τη Χρήση του Goo...
Αξιολόγηση Ελληνικών Πανεπιστημιακών Τμημάτων Εκπαίδευσης με τη Χρήση του Goo...Αξιολόγηση Ελληνικών Πανεπιστημιακών Τμημάτων Εκπαίδευσης με τη Χρήση του Goo...
Αξιολόγηση Ελληνικών Πανεπιστημιακών Τμημάτων Εκπαίδευσης με τη Χρήση του Goo...
 
Opinion essay unit4 [e doc_find.com]
Opinion essay unit4 [e doc_find.com]Opinion essay unit4 [e doc_find.com]
Opinion essay unit4 [e doc_find.com]
 
Oportunidades de negocio en el sector agua
Oportunidades de negocio en el sector aguaOportunidades de negocio en el sector agua
Oportunidades de negocio en el sector agua
 
Captain vineyards of Moraga
Captain vineyards of Moraga Captain vineyards of Moraga
Captain vineyards of Moraga
 
Plan Técnico para el Aprovechamiento de los Recursos Hídricos Alternativos en...
Plan Técnico para el Aprovechamiento de los Recursos Hídricos Alternativos en...Plan Técnico para el Aprovechamiento de los Recursos Hídricos Alternativos en...
Plan Técnico para el Aprovechamiento de los Recursos Hídricos Alternativos en...
 
Life cycle engineering
Life cycle engineeringLife cycle engineering
Life cycle engineering
 
Ph d progress_1st_year 2012_2013-Wikis in education
Ph d progress_1st_year 2012_2013-Wikis in educationPh d progress_1st_year 2012_2013-Wikis in education
Ph d progress_1st_year 2012_2013-Wikis in education
 
Silabus elemen mesin_i
Silabus elemen mesin_iSilabus elemen mesin_i
Silabus elemen mesin_i
 
Patricio Andres Gallardo Cortes. Soluciones tecnológicas para la industria mi...
Patricio Andres Gallardo Cortes. Soluciones tecnológicas para la industria mi...Patricio Andres Gallardo Cortes. Soluciones tecnológicas para la industria mi...
Patricio Andres Gallardo Cortes. Soluciones tecnológicas para la industria mi...
 
Miniproject of research by Samuel Rodriguez Perez, from Mexico[1]
Miniproject of research by Samuel Rodriguez Perez, from Mexico[1]Miniproject of research by Samuel Rodriguez Perez, from Mexico[1]
Miniproject of research by Samuel Rodriguez Perez, from Mexico[1]
 
Keeping up with_the_yankees
Keeping up with_the_yankeesKeeping up with_the_yankees
Keeping up with_the_yankees
 
The Wolf pt 1
The Wolf pt 1The Wolf pt 1
The Wolf pt 1
 
Escuela N° 148. Paso de los Toros.
Escuela N° 148. Paso de los Toros.Escuela N° 148. Paso de los Toros.
Escuela N° 148. Paso de los Toros.
 
Gestión de recursos hídricos en Brasil
Gestión de recursos hídricos en BrasilGestión de recursos hídricos en Brasil
Gestión de recursos hídricos en Brasil
 
Silabus mata kuliah elemen mesin
Silabus mata kuliah elemen mesinSilabus mata kuliah elemen mesin
Silabus mata kuliah elemen mesin
 
panduan-folio-jahitan
panduan-folio-jahitanpanduan-folio-jahitan
panduan-folio-jahitan
 

Semelhante a Burke-Leslie April Market Analysis

2011 Q1 Research
2011 Q1 Research2011 Q1 Research
2011 Q1 Researchtom_graffeo
 
Finlight Research - Market Perspectives - Sep 2016
Finlight Research - Market Perspectives - Sep 2016Finlight Research - Market Perspectives - Sep 2016
Finlight Research - Market Perspectives - Sep 2016FinLight Research
 
FinLight Research - Market Perspectives May 2014
FinLight Research - Market Perspectives May 2014FinLight Research - Market Perspectives May 2014
FinLight Research - Market Perspectives May 2014Zouheir Ben Tamarout
 
FinLight Research - Market perspectives Jun 2014
FinLight Research - Market perspectives Jun 2014FinLight Research - Market perspectives Jun 2014
FinLight Research - Market perspectives Jun 2014Zouheir Ben Tamarout
 
Finlight Research - Market Perspectives - Aug 2015
Finlight Research - Market Perspectives - Aug 2015Finlight Research - Market Perspectives - Aug 2015
Finlight Research - Market Perspectives - Aug 2015FinLight Research
 
Finlight Research - Market Perspectives - Aug 2014
Finlight Research - Market Perspectives - Aug 2014Finlight Research - Market Perspectives - Aug 2014
Finlight Research - Market Perspectives - Aug 2014Zouheir Ben Tamarout
 
Finlight Research - Market Perspectives - May 2016
Finlight Research - Market Perspectives - May 2016Finlight Research - Market Perspectives - May 2016
Finlight Research - Market Perspectives - May 2016FinLight Research
 
FinLight Research - Market Perspectives Apr 2014
FinLight Research - Market Perspectives Apr 2014FinLight Research - Market Perspectives Apr 2014
FinLight Research - Market Perspectives Apr 2014Zouheir Ben Tamarout
 
Residential Sales Report - December 2011
Residential Sales Report - December 2011Residential Sales Report - December 2011
Residential Sales Report - December 2011Team Price Real Estate
 
Finlight Research - Market Perspectives - Aug 2016
Finlight Research - Market Perspectives - Aug 2016Finlight Research - Market Perspectives - Aug 2016
Finlight Research - Market Perspectives - Aug 2016FinLight Research
 
Capital Market 1st Quarter 2010
Capital Market 1st Quarter 2010Capital Market 1st Quarter 2010
Capital Market 1st Quarter 2010pospime
 
Finlight Research - Market Perspectives - Nov 2014
Finlight Research - Market Perspectives - Nov 2014Finlight Research - Market Perspectives - Nov 2014
Finlight Research - Market Perspectives - Nov 2014Zouheir Ben Tamarout
 

Semelhante a Burke-Leslie April Market Analysis (20)

2011 Q1 Research
2011 Q1 Research2011 Q1 Research
2011 Q1 Research
 
2011 Q1 Research
2011 Q1 Research2011 Q1 Research
2011 Q1 Research
 
2011 Q1 Research
2011 Q1 Research2011 Q1 Research
2011 Q1 Research
 
September Mmr
September MmrSeptember Mmr
September Mmr
 
Finlight Research - Market Perspectives - Sep 2016
Finlight Research - Market Perspectives - Sep 2016Finlight Research - Market Perspectives - Sep 2016
Finlight Research - Market Perspectives - Sep 2016
 
Rei0410
Rei0410Rei0410
Rei0410
 
FinLight Research - Market Perspectives May 2014
FinLight Research - Market Perspectives May 2014FinLight Research - Market Perspectives May 2014
FinLight Research - Market Perspectives May 2014
 
FinLight Research - Market perspectives Jun 2014
FinLight Research - Market perspectives Jun 2014FinLight Research - Market perspectives Jun 2014
FinLight Research - Market perspectives Jun 2014
 
April en lvrec
April en lvrecApril en lvrec
April en lvrec
 
Finlight Research - Market Perspectives - Aug 2015
Finlight Research - Market Perspectives - Aug 2015Finlight Research - Market Perspectives - Aug 2015
Finlight Research - Market Perspectives - Aug 2015
 
Market perspectives - July 2014
Market perspectives - July 2014Market perspectives - July 2014
Market perspectives - July 2014
 
Finlight Research - Market Perspectives - Aug 2014
Finlight Research - Market Perspectives - Aug 2014Finlight Research - Market Perspectives - Aug 2014
Finlight Research - Market Perspectives - Aug 2014
 
Finlight Research - Market Perspectives - May 2016
Finlight Research - Market Perspectives - May 2016Finlight Research - Market Perspectives - May 2016
Finlight Research - Market Perspectives - May 2016
 
FinLight Research - Market Perspectives Apr 2014
FinLight Research - Market Perspectives Apr 2014FinLight Research - Market Perspectives Apr 2014
FinLight Research - Market Perspectives Apr 2014
 
Residential Sales Report - December 2011
Residential Sales Report - December 2011Residential Sales Report - December 2011
Residential Sales Report - December 2011
 
Finlight Research - Market Perspectives - Aug 2016
Finlight Research - Market Perspectives - Aug 2016Finlight Research - Market Perspectives - Aug 2016
Finlight Research - Market Perspectives - Aug 2016
 
Capital Market 1st Quarter 2010
Capital Market 1st Quarter 2010Capital Market 1st Quarter 2010
Capital Market 1st Quarter 2010
 
Finlight Research - Market Perspectives - Nov 2014
Finlight Research - Market Perspectives - Nov 2014Finlight Research - Market Perspectives - Nov 2014
Finlight Research - Market Perspectives - Nov 2014
 
May en lvrec
May en lvrecMay en lvrec
May en lvrec
 
May en lvrec
May en lvrecMay en lvrec
May en lvrec
 

Burke-Leslie April Market Analysis

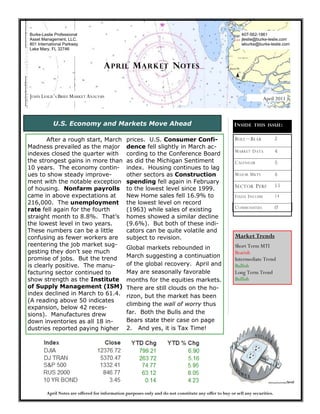
  • 1. Burke-Leslie Professional 407-562-1861 Asset Management, LLC. jleslie@burke-leslie.com 801 International Parkway wburke@burke-leslie.com Lake Mary, FL 32746 A PRIL M ARKET N OTES JOHN LESLIE’S BRIEF MARKET ANALYSIS April 2011 U.S. Economy and Markets Move Ahead I NSIDE THIS ISSUE : After a rough start, March prices. U.S. Consumer Confi- B ULL —B EAR 2 Madness prevailed as the major dence fell slightly in March ac- M ARKET D ATA 4 indexes closed the quarter with cording to the Conference Board the strongest gains in more than as did the Michigan Sentiment C ALENDAR 5 10 years. The economy contin- index. Housing continues to lag ues to show steady improve- other sectors as Construction M AJOR M KTS 6 ment with the notable exception spending fell again in February S ECTOR P ERF 11 of housing. Nonfarm payrolls to the lowest level since 1999. came in above expectations at New Home sales fell 16.9% to F IXED I NCOME 14 216,000. The unemployment the lowest level on record rate fell again for the fourth (1963) while sales of existing C OMMODITIES 17 straight month to 8.8%. That’s homes showed a similar decline the lowest level in two years. (9.6%). But both of these indi- These numbers can be a little cators can be quite volatile and confusing as fewer workers are subject to revision. Market Trends reentering the job market sug- Short Term MTI Global markets rebounded in gesting they don’t see much Bearish promise of jobs. But the trend March suggesting a continuation Intermediate Trend is clearly positive. The manu- of the global recovery. April and Bullish facturing sector continued to May are seasonally favorable Long Term Trend show strength as the Institute months for the equities markets. Bullish of Supply Management (ISM) There are still clouds on the ho- index declined in March to 61.4. rizon, but the market has been (A reading above 50 indicates climbing the wall of worry thus expansion, below 42 reces- sions). Manufactures drew far. Both the Bulls and the down inventories as all 18 in- Bears state their case on page dustries reported paying higher 2. And yes, it is Tax Time! April Notes are offered for information purposes only and do not constitute any offer to buy or sell any securities.
  • 2. THE BULL AND BEAR STORY Every time someone buys a stock, someone else is selling it. It’s safe to assume that what one investor views as an new opportunity, another views as quiet differently. This is what makes an auction market. Viewing the same economic data, analysts and inves- tors often come to very different conclusions. That’s never more apparent than now when the major market averages have essentially doubled from the March 2009 low. So where are you, bullish or bearish? The Bulls view the economic environment as very positive. Af- ter all, interest rates are still very low. The 2 year T-Notes are yielding only .8%, the 10 year is 3.45% and the 30 year T- Bond is 4.48%. The unemployment rate is falling, now 8.8% and the econ- omy is finally creating new jobs. The Purchasing Manager’s Index (PMI) points to an expansion of manufacturing. And retail sales continue to improve. Corporate earnings are expected to come in strong for 2011. The estimated price earnings ratio (P/E) for stocks are estimated (by Bank of America analysts) to come in at 14 for 2011 and 13 for 2012. From a historical perspective, the market is not over- valued. The Federal Reserve is clearly in an accommodative mood. Even though QE II ends in June, the FED is committed to economic growth and a higher inflation rate. The bulls view this data as very encouraging, and believe the stock market has lots of room to go higher from here. Cash then, is trash. April Notes are offered for information purposes only and do not constitute any offer to buy or sell any securities.
  • 3. THE BULL AND BEAR STORY —P ART 2 The Bears have a different take on the data. The unem- ployment trend is down, but the real unemployment rate is much higher than 8.8%. According to the Wall St. Journal, “There are still 13.5 million people who would like to work, but can’t get a job.” The broader U- 6 unemployment rate includes those who are marginally attached to the labor force. That number continued to decline but still remains at 15.7%. They question what will happen when the FED stops flooding the economy with money (quantitative easing) in June. Bears worry about the current political unrest in the Mid- dle East and North Africa (MENA), the sovereign debt cri- sis in European Union, and the fallout from the natural disasters in Japan. They are concerned about the growing federal debt service obligation, and the current focus on cutting government spending. What will the fallout be on the economy? They are concerned about the ramifications of the large budget deficits, and the sliding U.S. dollar. If the dollar falls so low that it is no longer the global currency, what hap- pens to the cost of doing business in the global economy? Commodity prices continue to climb, in part because of the falling dollar. Will higher prices be inflationary pushing up the cost of retail goods? Will the FED be forced to raise interest rates? How will the housing market respond to higher interest rates? Is there a possibility of a double dip in housing prices? “The Bears acknowledge that Bull markets climb a wall of worry … but today’s wall of worry is one of the highest and most daunting in years” according to Mark Huard. The Bears conclude that lower prices are around the corner. April Notes are offered for information purposes only and do not constitute any offer to buy or sell any securities.
  • 4. Market Data April Notes are offered for information purposes only and do not constitute any offer to buy or sell any securities.
  • 5. Economic Calendar ______________________________________________________________________________________ SEASONALITY For the past 10 years, April has been a sea- sonally favorable month for the Dow Jones Industrial average. The index has been up almost 67% of the time with an average gain of 2.1%. April Notes are offered for information purposes only and do not constitute any offer to buy or sell any securities.
  • 6. Major Market Indexes The S&P and DJI indexes remain in bullish main in positive longer term trends. trends, albeit bearish wedge patterns. Last Given the strong price performance since last week’s Mid-East turmoil pushed energy prices August, a pull-back or “correction” would be higher, and the indexes lower but they did both expected and healthy. In our opinion, NOT break below support. we have completed two of an anticipated The NASDAQ Composite and Transportation three wave cyclical bull market. Indexes have broken below the prior pivot Given the current geopolitical events, we are low, so price is below the Trend Bar (black alert to the possibility of increased volatility. line) and now negative on an intermediate However, news does not normal affect the term. The Transportation companies have longer term price trends. Ultimately, price is been hurt by rising energy and commodity the best “indicator” and we monitor those prices. Both of these indexes, however, re- trends daily. Don’t ever panic. April Notes are offered for information purposes only and do not constitute any offer to buy or sell any securities.
  • 7. Major Market Indexes The major indexes traded lower in early March in what appeared to be the beginning of a correction. But price reversed mid month to rally an impressive 700 Dow points. The S&P has rallied to within a few points of its bull market high. Seasonality factors favor a continuation of the positive trend. Momentum indicators are bullish on both daily and weekly time frames. Viewing 10 color coded technical indicators, green for positive/red for negative signals, the index turned bullish the week of September 13th. April Notes are offered for information purposes only and do not constitute any offer to buy or sell any securities.
  • 8. Major Market Indexes The bearish “wedge” pattern broke down in February taking price to the 1250 area. The re- versal off 1250 created the support trend line. The Index is now in a positive channel with an up-side target above 1400. There is no assurance it will reach that technical target, but the trend is clear. The same pattern is manifest in the Dow Jones Industrial Average. The trend line resistance is in the range of 13000. April Notes are offered for information purposes only and do not constitute any offer to buy or sell any securities.
  • 9. Major Market Indexes Market Breadth Indicators are positive including: New York Stock Exchange Advance vs. Declining Issues. (More stocks are advancing than are declining.) New York Stock Exchange New Highs vs. New Low (There are many more stocks making new highs than are making new lows.) April Notes are offered for information purposes only and do not constitute any offer to buy or sell any securities.
  • 10. Major Market Indexes The New York Stock Exchange Bullish Percent Index records the number of stocks with bull- ish “point and figure” buy signals. The indicator has confirmed the new bullish trend in Sep- tember, the correction in February, and the resurgence of positive price movement in late March. The near term sentiment, momentum, and price patterns are in positive trends. But with the many unresolved global challenges, it’s important to avoid complacency. Negative crossing Positive crossing April Notes are offered for information purposes only and do not constitute any offer to buy or sell any securities.
  • 11. SECTOR PERFORMANCE April Notes are offered for information purposes only and do not constitute any offer to buy or sell any securities.
  • 12. SECTOR ETFs Relative strength is a measure of the relationship of price performance between a stock/ETF and another stock/ETF in the same category, against an index or against the broad market. For our Sector ETF analysis, we are measuring strength between the Sector ETF and the S&P 500. Robert Colby’s long term relative strength ratings are listed in descending order of strength: Energy — Bullish: relative strength further above 2 year highs. Limited storage issues may push oil futures lower in the near term as trades can- not accept delivery. But the continued instability in MENA (Mid-east, north Af- rica), the global economic recovery and growing demand point to higher prices in the intermediate term. Industrials—Bullish: relative strength back above 12 year highs. Manufacturing is improving according to the latest ISM data, and growth could actually be stronger than anticipated. But the overall view is neutral due to fiscal restraints, Asian monetary policy, and a rollover of the orders/inventory ratio Materials— Bullish: relative strength rose above 6 week highs Materials continues to move with the overall market with a positive trend. Higher commodity prices can put a damper on growth however. Consumer Discretionary—Neutral: relative strength in trading range. As we enter the later stages of the economic expansion, this sector become more vulnerable to pricing pressure. With limited pricing power to offset costs, the sector remains a neutral. Technology—Bearish: 50 period moving average of relative strength crossed below the 200 moving average. Absolute price is neutral. Still recovering from the market correction, an improving economy will boost tech sales and bottom line. Financials are solid and the sector is rated neutral. Health Care— Neutral: relative strength back up to neutral This beaten down group has climbed back into the neutral area. There are still issues with health care reform which could limit profits. But low valuations re- main attractive. Financial—Bearish: relative strength fell below three month lows. Absolute price broke down below 10 week lows. Housing, the related mortgage market and new capital requirements will create a drag for this sector, while higher interest rates and the ability to begin or in- crease dividends point to stronger performance. Still a market performer, but an improving sector. Consumer Staples— Neutral: relative strength neutral but weakening While traditionally a defensive sector, prices are improving with the economic recovery. But rising commodity costs are putting a ceiling on margins. The sector remains a weak neutral rating. April Notes are offered for information purposes only and do not constitute any offer to buy or sell any securities.
  • 13. Utilities— Bearish: relative strength fell below prior 2 week. Absolute price is neutral. While relative performance puts utilities at the lowest range of the sectors, low bond yields and high utility stock dividends have attracted buyers. The potential fallout from the Japa- nese nuclear incidents and the risk of additional regulatory response keeps a cloud over this sector. It’s neutral now, but vulnerable to a further downgrade. Absolute price performance for major sectors, for both 1 month and 3 months April Notes are offered for information purposes only and do not constitute any offer to buy or sell any securities.
  • 14. FIXED INCOME Both the 10 and 30 year Treasury’s rallied in February to challenge resistance. Both were turned back. Inflation and interest rate fears are pushing yields higher and bond prices lower. There is great uncertainty on the horizon as Congress has yet to resolve the debt ceiling. House Speaker Boehner is quoted as saying that “any increase in the debt ceiling cannot and should not pass without spending cuts and reforms.” According to JP Morgan analysts, “while it’s almost certain the Congress will eventually raise the debt ceiling in tome for Treasury to avoid a default, a game of chicken that delays this decision in to June is a clear negative for Treasuries.” Walmart CEO Bill Simon recently announced that inflation “is going to be serious. We’re seeing cost increases starting to come through at a pretty rapid pace.” Because of their fixed payouts, bond prices do not perform well in times of increased inflation. Bonds, like the U.S. equities markets, are at a critical point. If price breaks below the sup- port levels (below), it would suggest that the bond market has a growing anticipation of higher inflation (and interest rates). Both have negative implications for any fixed income investments. April Notes are offered for information purposes only and do not constitute any offer to buy or sell any securities.
  • 15. INTERMARKET RELATIONSHIPS The relationship between bonds, commodities, the U.S. dollar and the stock market Intermarket relationships are key to understanding economic cycles. Generally speaking: Bond prices and commodities trend in opposite directions; Bonds usually trend in the same direction as stocks. Any significant divergence warns of a possible reversal in stocks. A falling dollar will eventually cause commodity prices to rally which in turn will have bearish implications for bonds and stocks. Falling interest rates pull the dollar lower. With the falling dollar, we initially have fal- ling commodity prices. As interest rates are falling, bond prices and later stock prices rally. [There are periods of time when these relationships are in transition, and even occasionally, reverse]. Eventually, the falling dollar pushes commodity prices higher. Rising commodity prices pull interest rates higher and bond prices lower. The lower bond market eventually pulls the stock prices lower. Rising interest rates start to pull the dollar higher, and the bullish cycle starts all over again.1 Intermarket Technical Analysis, John J. Murphy, 1991 April Notes are offered for information purposes only and do not constitute any offer to buy or sell any securities.
  • 16. The U S Bond ETF ($USB) follows the U S dollar in the below chart. Stock and commodity prices are currently moving together. Here is a comparative view of the Commodity Research Bureau (CRB) index and the S&P 500 ($SPX). Do you notice anything funny about the relationship between the CRB and the broad stock market? Remember our initial tenet: commodities and stocks should not be moving in the same direction. This suggests an unhealthy market. It is impossible to know which market will change to reestablish the normal relationships, or even when. But clearly, caution is advised. April Notes are offered for information purposes only and do not constitute any offer to buy or sell any securities.
  • 17. COMMODITY MARKETS The dollar traded down to support at $76 and bounced briefly. Momentum indicators are still negative suggesting the dollar might retest the 75.81 lows in the near term. There is a great deal of technical support just beneath the current price. If that support is broken, the dollar is vulnerable to much lower prices. WEEKLY CHART DAILY CHART April Notes are offered for information purposes only and do not constitute any offer to buy or sell any securities.
  • 18. Gold remains in a bullish trend, but as yet unable to break through resistance at $1450. Support is the lower trend line. While the consensus is that gold will move up from this range and perhaps challenge the $ 2000 level. However, until the resistance level is vio- lated, gold may continue to consolidate around 1430 Copper prices broke above resistance near the 4.70 target, but quickly fell back down into the trading range. Price broke below the intermediate term trend line, and has made a se- ries of lower highs and lower lows. Trend is now negative in this economic bell weather. April Notes are offered for information purposes only and do not constitute any offer to buy or sell any securities.
  • 19. Crude oil prices briefly dropped below the intermediate trend line, but quickly rallied to close the week at 107.07. The trend remains bullish while crude oil inventories are quite high. The March 30th EIA (Energy Information Administration) inventory report shows Cushing storage at a record 41.9 million barrels. The maximum capacity is 44 million. U.S. supplies overall rose to 355.7 million. There is an increased focus on Natural Gas as an alternative to nuclear energy. But large inventories continue to hold price down. The trend is positive, but within a larger price range (consolidation). Until price moves above the prior price high (pivot), NG is neutral. April Notes are offered for information purposes only and do not constitute any offer to buy or sell any securities.
  • 20. DEBT CLOCK Burke -Leslie, LLC, is a registered investment advisor (RIA) with the SEC. The information contained within is neither a solici- tation nor an advertisement for any investment. The articles and information provided are for the benefit of our clients and are not an offer to purchase or solicit any mentioned investment. Opinions expressed about any security mentioned in this newslet- ter may change at any time and Burke-Leslie, LLC maintains no duty or obligation to update information as changes occur. While every effort is made to ensure accuracy of the articles published herein, we are not liable for any inaccuracies. April Notes are offered for information purposes only and do not constitute any offer to buy or sell any securities.