Recomendados

Recomendados
Mais conteúdo relacionado
Mais procurados
Mais procurados (20)
Destaque
Destaque (13)
Semelhante a AmandaGallagherFinalPoster
Semelhante a AmandaGallagherFinalPoster (20)
AmandaGallagherFinalPoster
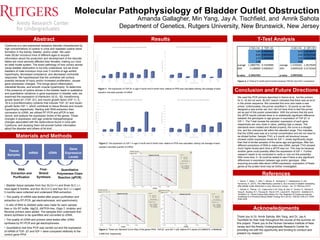
- 1. Abstract Cystinuria is a rare autosomal recessive disorder characterized by high concentrations of cystine in urine and repeated cystine stone formation in the kidney, bladder, and/or ureter. We used male Slc3a1 knockout mice of different ages to acquire information about the production and development of the disorder. Males are more severely affected than females, making our mice an ideal model system. The exact pathology of how urinary stones cause bladder obstruction is not fully understood, but we know bladders of male knockout mice over 3 months of age exhibit hypertrophy, decreased compliance, and decreased contractile responses. We hypothesized that the urothelial cell surface, possibly because of injury and/or increased proliferation, causes gene expression changes. This brings about inflammation, interstitial fibrosis, and smooth muscle hypertrophy. To determine if the presence of cystine stones in the bladder leads to qualitative and quantitative variations in gene expression in bladder cells, we examined the expression of interleukin-1β (IL-1β), transforming growth factor-β1 (TGF- β1), and insulin growth factor (IGF-1). IL- 1β is a proinflammatory cytokine that induces TGF- β1 and insulin growth factor IGF-1, which contribute to tissue fibrosis and muscle hypertrophy respectively. Starting with RNA extraction then conversion to cDNA, we utilized RT-PCR and qPCR to test, record, and analyze the expression levels of the genes. These changes in expression with age underlie histopathological changes associated with the dysfunctions found in mice with Cystinuria, and studying them will provide further information about the disorder and others of its kind. Conclusion and Future Directions Materials and Methods Acknowledgments Results Figure 3: These are Standard Curve Plots of the genes PPIA, TGF-β1, and IGF-1 with relative R^2 values of 0.9962372, 0.9948246, 0.9991222, respectively • Bladder tissue samples from four SLC(+/+) and three SLC (-/- mice aged 8 months, and four SLC(+/+) and four SLC (-/-) aged 5 months were collected and underwent RNA extraction. • The quality of mRNA was tested after proper purification and extraction by RT-PCR, gel electrophoresis, and spectrometry. • A ratio of RNA to distilled water was made for each sample, then a 10x RT buffer, MgCl2, dNTP,R-Hex, Olgio-T, Inhibitor and Reverse primers were added. The samples then underwent first- strand synthesis to be quantified and converted to cDNA. • The quality of cDNA and primers were tested after cDNA synthesis by RT-PCR and gel electrophoresis. • Quantitative real time PCR was carried out and the expression of mRNA of TGF- β1 and IGF-1 were compared relatively to the control gene PPIA. We used the PCR primers described in Kanno et al., but the primers for IL-1β did not work. BLAST search indicated that there was an error in the primer sequence. We corrected this error and made a new primer. Unfortunately, this primer amplified IL-1β poorly so we then designed a new primer set, but I did not have time to test this primer set as part of this poster presentation. With the primers that did work the qPCR results indicate there is no statistically significant difference between the genotypes or age groups in expression of TGF-β1 or IGF-1. The T-test reveals the samples’ expression of each gene respectively are very close in value, yielding high p-values. The standards were created and diluted properly, the curve is a straight line, and the unknowns fall within the standard range. This indicates that the cDNA used was at a normal concentration and did not need to be diluted further. Sample 7743, a 5 month old knockout mouse, showed outlier expression levels for IGF-1, levels significantly larger than that of similar samples of the same age and genotype. After two different extractions of RNA to make new cDNA, sample 7743 showed much higher levels each time a qPCR was run. This may be because another gene could possibly affect the expression of IGF-1. Further research needs to be conducted to verify or rule out this possibility. With more time, IL-1β could be tested to see if there is any significant differences in expression between age and/or genotype. After acquiring accurate data about mRNA expression, expression of these genes at the protein level may be further investigated. Thank you to Dr. Amrik Sahota, Min Yang, and Dr. Jay A. Tischfield for their help throughout the course of the summer on this project. Thank you to the Human Genetics Institute of New Jersey and the Aresty Undergraduate Research Center for providing me with the opportunity and funding to conduct and present my research. References • Kanno, Y., Mitsui, T., Kitta, T., Moriya, K., Tsukiyama, T., Hatakeyama, S. and Nonomura, K. (2015), The inflammatory cytokine IL-1β is involved in bladder remodeling after bladder outlet obstruction in mice. Neurourol. Urodyn.. doi: 10.1002/nau.22721 • Sahota, A., Parihar, J.S., Capaccione, K.M.,Yang, M.,Noll, K., Gordon, D., Reimer,D., Yang,III., Buckley, B.T., Polunas,M., Reuhl, K.R., Lewis,M.R., Ward,M.D., Goldfarb,D.S., Tischfield,J.A. "Novel Cystine Ester Mimics For The Treatment Of Cystinuria-Induced Urolithiasis In A Knockout Mouse Model."Urology 84.5 (2014): 1249.e9-1249.e15. ISSN 0090-4295. Tissue Samples mRNA cDNA Gene Expression Levels RNA Extraction and Purification First- Strand Synthesis Quantitative Polymerase Chain Reaction (qPCR) Molecular Pathophysiology of Bladder Outlet Obstruction Amanda Gallagher, Min Yang, Jay A. Tischfield, and Amrik Sahota Department of Genetics, Rutgers University, New Brunswick, New Jersey Figure 4: A T-test of 5 month and 8 month knockout TGF-β1 and IFG-1 expression Figure 1: The expression of TGF-β1 in age 5 month and 8 month mice relative to PPIA was calculated utilizing the average of each sample’s recorded quantity of mRNA. T-Test Analysis Figure 2: The expression of IGF-1 in age 5 month and 8 month mice relative to PPIA was calculated utilizing the average of each sample’s recorded quantity of mRNA. 0.00 0.50 1.00 1.50 2.00 2.50 3.00 3.50 4.00 4.50 5.00 SLC(+/+) SLC(+/+) SLC(+/+) SLC(+/+) SLC(-/-) SLC(-/-) SLC(-/-) 2024 2025 2026 2027 7610 7611 7600 0.46 0.77 0.15 1.48 0.53 0.06 1.55 RatioofmRNAExpression Sample and Genotype TGF-Beta 1 Relative mRNA Expression in 8 Month Old Mice 0.00 0.50 1.00 1.50 2.00 2.50 3.00 3.50 4.00 4.50 5.00 SLC(+/+) SLC(+/+) SLC(+/+) SLC(+/+) SLC(-/-) SLC(-/-) SLC(-/-) 2024 2025 2026 2027 7610 7611 7600 0.65 0.45 1.41 0.52 1.21 0.92 1.66 RatioofmRNAExpression Sample and Genotype IGF- 1 Relative mRNA Expression in 8 Month Old Mice 0.00 0.50 1.00 1.50 2.00 2.50 3.00 3.50 4.00 4.50 5.00 SLC(+/+) SLC(+/+) SLC(+/+) SLC(+/+) SLC(-/-) SLC(-/-) SLC(-/-) SLC(-/-) 2028 2029 7749 7650 7740 7741 7743 7660 0.40 0.75 1.18 1.06 1.01 0.65 1.75 1.39 RatioofmRNAExpression Sample and Genotype TGF-Beta 1 Relative mRNA Expression in 5 Month Old Mice 0.00 0.50 1.00 1.50 2.00 2.50 3.00 3.50 4.00 4.50 5.00 SLC(+/+) SLC(+/+) SLC(+/+) SLC(+/+) SLC(-/-) SLC(-/-) SLC(-/-) SLC(-/-) 2028 2029 7749 7650 7740 7741 7743 7660 0.30 0.35 1.61 0.58 0.72 0.41 3.35 0.61 RatioofmRNAExpression Samples and Genotype IGF-1 Relative mRNA Expression in 5 Month Old Mice