Security Operational Scorecard EX2
•
1 gostou•190 visualizações

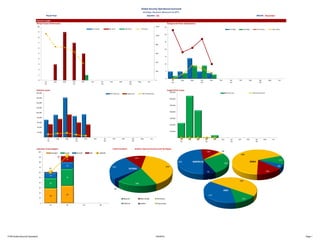
This document provides a quarterly business report for the second quarter of fiscal year 2009. It includes summaries of key performance indicators and metrics in areas such as hiring, background checks, business losses, security operations, investigations and compliance. Charts and graphs display regional and category breakdowns of metrics like incident levels, property losses and recoveries, and emergency response plan deployment.

Recomendados
Recomendados
Mais conteúdo relacionado
Mais procurados
Mais procurados (13)
Destaque
Destaque (9)
Semelhante a Security Operational Scorecard EX2
Semelhante a Security Operational Scorecard EX2 (20)
Security Operational Scorecard EX2
- 1. Fiscal Year: FY09 Quarter: Q2 Month: December Business Insight Hiring Process Performance Background Check Adjudications Business Losses Supply Chain Losses Executive Travel Support Critical Incidents Incident Types & Severity Levels by Region Global Security Operational Scorecard Strategic Business Measures & KPI's 6% 14% 69% 11% EMEA 0 200 400 600 800 1000 1200 0 1 2 3 4 5 6 7 8 9 10 Jul Q1 Aug Sept Oct Q2 Nov Dec Jan Q3 Feb Mar Apr Q4 May Jun No Checks No Hires NH Starts FTE Hires 29 34 20 33 11 13 12 61 92 0 10 20 30 40 50 60 70 80 90 100 Q1 Q2 Q3 Q4 Campus Local ConUS Intl Details 0 5 10 15 20 25 30 35 Jul Q1 Aug Sept Oct Q2 Nov Dec Jan Q3 Feb Mar Apr Q4 May Jun Pre Mtgs Adj Mtgs Pre Letters Adv Letters - 20,000 40,000 60,000 80,000 100,000 120,000 140,000 160,000 180,000 Jul Q1 Aug Sept Oct Q2 Nov Dec Jan Q3 Feb Mar Apr Q4 May Jun MS Prop Loss Laptop Loss MS Prop Recover - 100,000 200,000 300,000 400,000 500,000 600,000 700,000 Jul Q1 Aug Sept Oct Q2 Nov Dec Jan Q3 Feb Mar Apr Q4 May Jun MS Prop Loss MS Prop Recover 48% 14% 3% 28% 7% 0% AMERICAS 37% 0% 50% 13% 0% ASIA 26% 13% 40% 18% 3% GLOBAL Natural Man-made Terrorism Political Health Emp Issues FY09 Global Security Operations 1/24/2015 Page 1
- 2. Fiscal Year: FY09 Quarter: Q2 Month: December Global Security Operational Scorecard Strategic Business Measures & KPI's Business Insight - Revenue Influence Initiative Recorded Revenue Influenced Lead Source Distribution Revenue Influence Initiative Engagements & Opportunities Open vs. Closed Opportunities & Engagements Business Excellence Global Standards & Compliance Emergency Response Plans Incident Management Plans Site Distribution Region Sites ERPs Deployed Exercised ERP Deployment Region Sites IMPs Deployed Exercised IMP Deployment AMERICAS AMERICAS LATAM 33 28 85% 41% LATAM 33 1 3% - NORTH AMERICA 70 53 76% - NORTH AMERICA 70 53 76% - ASIA ASIA APAC/JPN 43 30 70% 77% APAC/JPN 43 3 7% - CHINA 22 10 45% 90% CHINA 22 1 5% - SW ASIA 15 15 100% 100% SW ASIA 15 0 0% - EMEA EMEA W EUROPE 40 30 75% 77% W EUROPE 40 2 5% - SW EUROPE 29 26 90% 38% SW EUROPE 29 4 14% - MEA 40 32 80% 39% MEA 40 2 5% - CEE 57 25 44% 67% CEE 57 4 7% - GLOBAL SUMMARY 349 249 71% 66% GLOBAL SUMMARY 349 70 20% - Lenel Deployment Vendor Compliance Program Region Sites w/ Lenel w/o Lenel Lenel n/a Access Alarm Video Complete AMERICAS LATAM 33 14 11 8 55% 58% 64% 67% NORTH AMERICA 223 180 25 13 86% 86% 82% 82% ASIA APAC/JPN 43 31 5 8 89% 89% 73% 89% CHINA 22 14 0 8 93% 100% 100% 100% Placeholder - Metric for Vendor Compliance to be Defined SW ASIA 12 7 5 0 58% 58% 67% 58% EMEA W EUROPE 38 31 7 0 79% 74% 82% 83% SW EUROPE 29 15 10 4 60% 60% 56% 66% MEA 42 24 13 5 65% 65% 65% 73% CEE 56 18 10 28 64% 61% 64% 79% GLOBAL SUMMARY 498 334 86 74 72% 72% 73% 77% Global Investigations Case Activity Cases by Tier Actual Cases vs. Estimated Activity 52% 16% 32% 25% 75% 97 107 103 99 85 39 39 30 38 29 0 20 40 60 80 100 120 140 160 0 5 10 15 20 25 30 35 INT Internal EPG Customer Loyalty PUB SMSP EPG Sales Opty PUB SMSP Tour Present Collaborate Full GSOC 26 7 77 2 10 2 16 14 0 5 10 15 20 25 30 Tier 1 Tier 2 Tier 3 Completed In Progress Follow-up $- $200,000 $400,000 $600,000 $800,000 $1,000,000 $1,200,000 FY09 MS Rev Partner Rev 0 20 40 60 80 100 120 140 Oct Q2 Nov Dec Jan Q3 Feb Mar Apr Q4 May Jun Jul Q1 Aug Sept Oct Q2 Nov Dec Jan Q3 Feb Mar Apr Q4 May Jun Theft TOV 47% 17% 36% 0% 11% 18% 9% 11% 2% 49% Act Mgrs EBC Lenel Other PPM Security 0% 11% 89% 0% Tier 3 Tier 2 Tier 1 Tier NA FY09 Global Security Operations 1/24/2015 Page 2