A psycho geographic analysis of eateries in ogbomoso, nigeria
•
1 gostou•664 visualizações

The International Institute for Science, Technology and Education (IISTE). All Rights Reserved.

Recomendados
Recomendados
Mais conteúdo relacionado
Mais procurados
Mais procurados (14)
Destaque
Semelhante a A psycho geographic analysis of eateries in ogbomoso, nigeria
Semelhante a A psycho geographic analysis of eateries in ogbomoso, nigeria (20)
Mais de Alexander Decker
Mais de Alexander Decker (20)
Último
Último (20)
A psycho geographic analysis of eateries in ogbomoso, nigeria
- 1. Research on Humanities and Social Sciences ISSN 2222-1719 (Paper) ISSN 2222-2863 (Online) Vol.3, No.22, 2013 www.iiste.org A Psycho-Geographic Analysis of Eateries in Ogbomoso, Nigeria Akindele O. Akin Urban and Regional Planning Department, Ladoke Akintola University of Technology, Ogbomoso. oaakindele37@lautech.edu.ng Abstract. Against the background of incessant proliferation of eateries in our urban centres, the study analyses the psychogeography of eateries in Ogbomoso North Local Government, Nigeria. The study appraises the physical attributes (including the presence and state of facilities), users perception and imageability of the eateries. An empirical measurement was done by administering a questionnaire to 320 respondents across selected eateries from parks nodes, CBD, Institutions and other activity centres. Multi-stage purposive sampling procedure was used. Major activity centres were selected. A centre for each activity centre was determined on the map of the area. All eateries within 200m radius from the centre were sampled. Descriptive and inferential statistics were used. Factor analysis was used to re-summarize the variables describing the physical attributes of eateries on the one hand and the user’s perception on the other. Canonical model was used to explain the causal factors of imageability of the eateries. The study observed a high relationship between the physical attribute of the eateries and both the performance of the eateries and the imageability of the immediate environment. The study thus recommends the imperatives for a careful consideration to planning for such uses like eateries in the broader land use planning. Background to the Study. The exploding urbanization which originated from both the population influx of rural residents and natural growth of urban centres creates a plethora of problems in the city (Egunjobi, 2006). A direct result is the increased demand for spaces to live move and interact (Ogunsanya, 1984). The man-hour and other economic connotations of living and moving in the cities have evolved a pattern of hectic days where places and spaces of satisfying the most necessary physiological needs have almost shifted completely from homes to other places such as the eateries. Urban residents leave home too early and return too late. The blame for this has been mainly on the distance to work and transportation inefficiencies (Ogunsanya, 1993, Aderamo, 1998). A major panacea to avoiding this gross man-hour loss is the trivialization of physiological necessities in homes. Residents thus depend on fast food joints, snack stands, restaurants, cafeterias etc all referred to as eateries in this study. This urbanization induced habit presents with attendant physical social, health and perceptual problems for the urban dwellers. The resultant indiscriminate haphazard proliferation of eateries at awkward places has become disadvantageous to the city imageability. Many of the eateries are best seen as accidental, shanty land uses, against the meaningful placing of objects in the city (Wagner, 2001). Most of the eateries locate on open spaces which may be necessary setbacks, airspaces, utility lines etc, affecting the tonal, textural and other legibility characteristics of the city. They have thus become parasites on other land uses as they lack basic facilities of their own such as: parking, circulation sewerage, waste disposal and airspaces among others. Eateries have almost become indispensable to the proper functioning of the urban system. Eateries play roles beyond food production (Wolf, 2007). Relaxation, sightseeing, entertainments and meeting of people among others are today the reasons for spending time at eateries. The stimuli in eateries consist of food, physical environment and social factors (Oldenburg, 1977, Wakefield and Blodgett, 1996, Wansinu, 2006). Meaningful placing of eateries has therefore gone beyond some answers to ‘where would people rather eat?’ to, where would people rather relax? Where would they meet people? Where would they expend their limited leisure time? Etc. These factors and many other related ones culminate to why an eatery is preferred by an individual compared to others. The proliferation of eateries, which may be parasitic or symbiotic to other land uses, has made its study significant in the study of urban system, morphology and performance. If urban residents would always need eatery, what should be the service radius? should it be part of the commercial, hospitality, public or industrial land uses? What factors should be considered to harmonize it with other land uses around? What are supposed to be the minimum physical attribute that guarantees urban functionality and efficiency? When can we call an eatery good? The question what is a good city and by extension, what is a good eatery is not easily answered (Lynch, 1981). We prefer some places to others most of the time because of the physical attributes of the places (Proshansky, 1978, Williams and Vaske, 2003). The city as well as its components have a lot of subjective characters that though in research may have been oversimplified, but which may have serious effects on the 25
- 2. Research on Humanities and Social Sciences ISSN 2222-1719 (Paper) ISSN 2222-2863 (Online) Vol.3, No.22, 2013 www.iiste.org image, usage and manageability of the total environment. To this end, this study investigates the psychogeography of eateries in Ogbomoso, Nigeria. Method of Study. The study necessarily rely on primary and secondary data. An empirical measurement was done by administering a questionnaire to 320 respondents across selected eateries from parks nodes, CBD, Institutions and other activity centres. Multi-stage purposive sampling procedure was used. Major activity centres were selected. A centre for each activity centre was determined on the map of the area. All eateries within 200m radius from the centre were sampled. Descriptive and inferential statistics were used. Factor analysis was used to re-summarize the variables describing the physical attributes of eateries on the one hand and the user’s perception on the other. Canonical model was used to explain the causal factors of imageability of the eateries. Place, Perception and Consumer Behaviour Psychological and sociological researches independently affirm that there is benefit from nature experiences, although both field of researches rarely intersect (Wolf, 2007). Research have shown that shopping perception are affected by the environmental cues such as light, sound, colour and product placement (Turley and Milliman, 2000). The researches have concentrated on the indoor places of shopping centers to the utter neglect of the outdoor exteriors; which presents initial perceptual cues to the customers. Features such as the facade, entrances, display windows, building architecture, parking lot character etc can create favourable or negative impressions that affects the frequency of return, amount spent during the visit and the time spent at shopping venue. Psycho-geography reviews the problems in the environment and how it affects humans emotionally. It studies the perception of people towards a particular object. It set for itself the study of precise laws and specific effects of the geographic environment, consciously organized or not on the emotions and behaviour of individuals (Debord, 1955). What you know about your environment is tied closely to the way you think and communicate. You don’t gain environmental knowledge passively, it comes through an active process of information passively, It comes through an active process of information gathering, structuring and association. You can better understand this process if you look at the stages involved with emphasis on seeing. (Muehrcke et al 1998). Abstractions can be used in two ways when thinking about the environment: Seeing the environment in holistic spatial terms with everything occurring at once and in complete interrelation; and conceiving the environment in analytical terms, with the whole made up of parts which can be identified, isolated and manipulated separately, This is the view of western scientific thoughts. (Muehrcke et al 1998). Discussion of Findings. For most part in this study, the data was collected in ordinal scale; where respondents had to rank their responses except in cases where direct observations could be taken e. g average time spent in eatery, patronage distance etc. These ordinal data were later transformed into interval through a method reminiscent of the likhert scaling. What obtains on table 1 are sum of weights from the scaled ordinal data. While some of the sums of weights are scalar, some are vector. By scalar is meant that only one variable is involved, while vector means that they are surrogates of a composite of variables. An example is the variable named ‘general sanitation’; which combines variables such as the incidence of littered floor, unkempt lawn, offensive odours and incidence of cobwebs together. Imageability stems from the physical features in the environment. The list of such physical features may be inexhaustible. However, in this study, about 50 of such physical cues which may have direct bearing with a place of eating were highlighted, and are presented on table 1. The materials used for construction were the basis for judging the qualities of wall, roof, ceiling, floor and other aspects of finishing. Relaxation speaks of the comfort given by the furniture, food order, presence and arrangement of utilities etc, entertainment includes music and or television including the connection of such television to DSTV or similar cable network. Scenery is suggestive of the agreement of the structure of the eatery with its immediate environment while ambience is the agreement with the larger environment in which the eatery is placed. The rest variables are self explanatory. A cursory observation gives a description of the areas where the eateries were sampled. ‘Under G’ area was near the University. This suggests why many respondents said it was near workplace (403) if they are staff members and many other observed that it was close home (371) if they are students or just living within the neighbourhood. The eateries here were observed to be close to recreation centres, hotels or guest houses (401). Orita Naira is close to a major node (401), a little close to major markets (334). Taki is the major node (405) and is regarded as the most important central business district (CBD) (405) of the poly-centred city. The seminary area houses a major but residential institution. It is close to the CBD (303) close to a major node (400), close to major markets (378), close to motor parks (313), somewhat close to workplaces (254), homes (256) and also worship centers (298). Aarada is particularly close to a major market (421), while Ahoyaya is close to homes 26
- 3. Research on Humanities and Social Sciences ISSN 2222-1719 (Paper) ISSN 2222-2863 (Online) Vol.3, No.22, 2013 www.iiste.org (356) and motor park (323). This affirms that eateries have spatial connotations and are so perceived. The ones perceived close to those who need it most are perceived to have good quality and vice versa. The fifty seven variables were collapsed into five linear composites namely socio-environmental attribute of eatery index (SEI), physical attribute of eatery index (PAI), eatery performance index (EPI), area imageability index (AII) and the other factor was considered residual because they seem to replicate the first factor but with low eigen values. The list of variables that loads highly under each factor is presented on table 2 with their respective communalities and ranked position (in bracket). Table 1: Perception of Eateries. SN 6 7 8 9 10 11 31 32 42 Mean Variables Nearness to home Nearness to CBD Nearness to workplace Nearness to Motor park Nearness to Recreation Nearness to worship centre Close to Major Node Close to Major market Motorized Accessibility SN Variables 1 2 3 4 5 6 7 8 9 10 11 12 13 14 15 16 17 18 19 20 21 22 23 24 25 26 27 28 Feeling of Privacy Absence of beggars Entertainment Company possibility Waiters carriage Nearness to home Nearness to CBD Nearness to workplace Nearness to Motor park Nearness to Recreation Nearness to worship centre Security of Property Segregated Sitting Open Location Obscure Location Scenery Ambience Incidence of Landscape Parking Road setback Ventilation Lightning Air conditioning Spaciousness Drainage condition Building Design Colour combination Furniture Under ‘G’ 371 189 403 244 401 234 201 276 376 Under ‘G’ 247 239 481 422 383 371 189 403 244 401 234 256 402 399 29 357 311 275 324 345 412 423 416 398 223 304 355 312 Orita Naira 206 227 321 298 219 254 401 334 227 Orita Naira 122 280 112 212 181 206 227 321 298 219 254 189 178 217 128 109 112 089 117 121 192 191 051 120 141 067 101 091 27 Taki 267 405 229 405 129 234 405 398 301 Seminary 256 303 254 313 233 298 400 378 289 Aarada 161 201 202 397 112 132 237 421 279 Ahoyaya 356 238 198 323 198 251 279 299 281 Taki Seminary Aarada Ahoyaya 142 278 122 132 191 267 405 229 405 129 234 122 104 128 129 111 112 87 88 85 201 102 76 99 123 98 98 86 201 298 118 112 179 256 303 254 313 233 298 192 234 278 101 211 211 121 103 128 222 203 98 122 167 134 129 154 102 212 87 111 101 161 201 202 397 112 132 198 78 98 221 78 78 43 45 87 189 187 32 65 132 78 67 77 98 197 34 98 201 356 238 198 323 198 251 203 102 112 288 123 127 102 67 101 134 112 32 132 123 91 101 121
- 4. Research on Humanities and Social Sciences ISSN 2222-1719 (Paper) ISSN 2222-2863 (Online) Vol.3, No.22, 2013 29 30 31 32 33 34 35 36 37 38 39 40 41 42 43 44 45 46 47 48 49 50 51 52 53 54 55 56 57 Relaxation General Sanitation Close to Major Node Close to Major market Sewage Disposal Solid Waste Disposal Power Supply Water Supply Toilet Facility Roof Quality Wall Quality Floor Quality Ceiling Quality Motorized Accessibility Food Quality Average food cost Quality of Service Type of Customer Average Sale per day Daily Patronage Distance of Patronage Returning customer Av Time spent in eatery Incidence of queue Inflated food cost Inflated drink cost Rowdiness Incidence of Smoke Likeness for eatery area Mean Source: Author’s Field Survey, 2013. Table 2: Extracted Factors SN Variables 1 2 3 4 5 6 7 8 9 10 11 12 13 16 17 18 19 23 24 Feeling of Privacy Absence of beggars Entertainment Company possibility Waiters carriage Nearness to home Nearness to CBD Nearness to workplace Nearness to Motor park Nearness to Recreation Nearness to worship centre Security of Property Segregated Sitting Scenery Ambience Incidence of Landscape Parking Air conditioning Spaciousness www.iiste.org 332 333 201 276 201 289 367 387 388 301 302 307 309 376 357 278 332 327 404 421 2.4 339 49 321 208 209 233 334 331 309.99 096 105 401 334 101 98 114 103 48 101 117 111 97 227 289 302 118 288 211 260 0.6 132 17 131 321 391 106 122 221 168.57 Factor 1 (SEI) .884(6) Factor 2 (EPI) 98 101 405 398 112 111 134 195 78 89 94 109 141 301 301 299 203 205 331 311 1.1 241 22 341 208 210 185 176 219 177.9 8 143 156 400 378 123 154 155 165 122 145 122 156 139 289 302 301 212 214 257 298 0.9 234 23 134 240 243 198 168 311 190.25 Factor 3 (PAI) Factor 4 (AII) 953(1) .934(3) .910(2) .973(1) .807(5) .955(2) .979(10) .957(13) .991(3) .983(7) .986(6) .982(8) 28 34 65 237 421 98 72 256 98 34 56 45 54 34 279 198 321 111 198 243 229 0.4 111 15 113 274 397 119 121 209 142.55 106 131 279 299 121 109 125 132 98 76 73 121 169 281 302 311 232 259 268 289 0.7 214 25 127 299 299 219 134 201 181.37
- 5. Research on Humanities and Social Sciences ISSN 2222-1719 (Paper) ISSN 2222-2863 (Online) Vol.3, No.22, 2013 www.iiste.org 25 Drainage condition .951(14) 26 Building Design .992(2) 27 Colour combination .995(1) 28 Furniture .990(4) 30 General Sanitation .992(2) 31 Close to Major Node 32 Close to Major market 33 Sewage Disposal .988(5) 34 Solid Waste Disposal .995(1) 35 Power Supply .764(16) 36 Water Supply .960(12) 37 Toilet Facility .995(1) 38 Roof Quality .981(9) 39 Wall Quality .972(11) 40 Floor Quality .983(7) 41 Ceiling Quality .943(15) 42 Motorized Accessibility .831 (7) 43 Food Quality .811(8) 45 Quality of Service .894(4) 46 Type of Customer .862(4) 47 Average Sale per day .942(4) 48 Daily Patronage .984(2) 49 Distance of Patronage .956(3) 50 Returning customer .986(1) 51 Av Time spent in eatery .926(5) 52 Incidence of queue .814(7) 55 Rowdiness .822(6) 56 Incidence of Smoke 57 Likeness for eatery area .870(3) Source: Author’s Computation, 2013. Socio Environmental Index (SEI) extracts 31.417% of the total variance of the data set. The variables that load highly under it are: waiter’s carriage (.973), segregated sitting (.955), entertainment (.934), Quality of service (.894) etc. Eatery performance index (EPI) extracts 27.42% of the total variance of the data set. The variables involved are: returning customer (.986), Daily Patronage (.984), distance of patronage (.956), average sales per day (.942), average time spent in eatery (.926) etc. Physical attribute index of eateries extracts 25.76% of the total variance of the data set. It involved variables such as: colour combination (.995), toilet facility (.995), solid waste disposal (.995), general sanitation (.992) building design (.992), incidence of landscape (.991), furniture (.990), sewage disposal (.988) etc. Area imageability index (AII), accounts for 31.41% of the total variance of the data set. It involves variables such as: absence of beggars (.953), company possibility (.910), type of customer (.862), security of property (.807), Quality of service (.800) etc. The study therefore used the four indices above to study the relationship between environmental features and eatery performance. The Relationship. This study employs the canonical model to explain the relationships between the linear composites of environmental features and eatery performance. Canonical correlation was performed between a set of environmental features’ linear composites and a set of eatery performance linear composites using the SPSS. The linearity of the relationship between all the variables involved was ascertained and multi-colinearity avoided. This was done through the test of bivariate correlation among all the indices involved and the test of skewness among the composites of environmental features first and then the indices of eatery Performance. There were poor or no correlation among the indices (all correlation coefficients were very close to zero). The skewness for each of the composites set was .015 and . 027 respectively at alpha equal .001. Hence, logarithmic transformation becomes unnecessary. The canonical correlation model is given by: R = R-1yyRyxR-1xxRxy……………………………………………………………………………………………..1 Where: 29
- 6. Research on Humanities and Social Sciences ISSN 2222-1719 (Paper) ISSN 2222-2863 (Online) Vol.3, No.22, 2013 www.iiste.org R = Canonical; Correlation R-1yy = Inverse of the correlation among eatery performance (DV) composites. Ryx /Rxy = Correlation among variables of environmental features/eatery performance. R-1xx = Inverse of the correlation among environmental feature’s (IV) composites The correlations for set 1 (Ryy) comprises the correlations between the indices of eatery performance index (EPI) and area imageability index (AII). All the correlation coefficients are positive. This implies that the correlation is uni-directional, and that the higher the attributes of the composites the higher the scores they obtain. In other words, the higher the positive value of the coefficients of the composites of eatery performance, in this study, the higher their attributes in the model. Among the loadings in set 1 (Eatery Performance), the absolute values of eatery performance index (EPI) is greater (0.6277) than the absolute value of area imageability index (AII) (0.4205). The implication is that, eatery performance index is more important among the indices in the canonical correlation performed. This means that; the relationship between eatery performance and environmental features in this study considers eatery performance index as the prime factor for eatery performance attributes. In other words, eatery performance is first considered to be the incidence of returning customer (.986), Daily Patronage (.984), distance of patronage (.956), average sales per day (.942), average time spent in eatery (.926) etc, above other factors describing eatery performance. The correlation for set 2 (Rxx) comprises the correlation between the indices of socio-environmental attributes (SEI), and physical attribute (PAI). All the coefficients are also positive. Among the loadings for set 2, (environmental features) therefore, the absolute value of physical attribute (PAI) is slightly greater (0.6148) than that of socio-environmental attribute (SEI) (0.5148). Physical attributes is therefore considered more important followed by socio-environmental attributes in the canonical correlation performed. The correlation of the first pair of canonical variate (Root 1) is 0.791. The eigenvalue for the correlation is therefore 0.889. (eigen value is obtained from the square root of the correlation i.e r2ci= λ1). This connotes that the first pair of canonical variate correlate 0.791 and overlap 0.889 or 88.9% in variance. The correlation of the second pair of canonical variate (Root 2) is 0.470. using the same procedure as in root 1 the eigenvalue for root 2 is 0.686. In essence, the second pair of the canonical variate correlates 0.470 and overlap 0.686 or 68.6% in variance. The third root correlates 0.149 but the correlation is ignored. It was ignored because as a rule of thumb, loadings with absolute value less than 0.300 are not considered in the interpretation. The Bartlett test of significance was computed to know if the remaining correlations are truly zero. The X2 for root 1 is 31.965 with P value of .000 ( at alpha equals .001). there is therefore a significant overlap in the variability between the indices of eatery performance and environmental features. In other words, there is reliable relationship between them. The X2 for root 2 is 6.939. This also differs significantly from zero. It indicates that there is significant overlap between the second pair of the canonical variates. In essence, the root 2 canonical correlation is also significant. Table 3: Loading Matrix for Canonical Correlation SETs Canonical Variate Pairs Variable Set FIRST SECOND Eatery performance EPI -.996 -.040 AII -.575 .222 Environmental Cues SEI -.665 .280 PAI -.917 -.670 Source: Author’s Computation, 2013. The correlation of the first pair of the canonical variate (root 1) is the first extract of canonical correlation and thus the strongest to be reckoned with in the interpretation of the model. For the first pair of canonical variate, eatery performance index (EPI) correlates -.996, Area Imageability (AII) correlates -.575. physical attributes (PAI) correlates -.917 while socio-environmental attributes (SEI) correlates -.665. The correlation for the first pair of the canonical variate is unidirectional in that all the coefficients involved carries the same (negative) sign. The figures on table 3 shows that a low attribute of eatery performance index (EPI) first; followed by the low attribute of area imageability (AII) is associated with low attribute of physical attributes (PAI) then by the low attribute of socio environmental attributes (SEI). In other words, eatery performance index (EPI) is stronger than area Imageability (AII) and in this order, they are influenced, first, by the composite of physical attributes (PAI) (-.917) followed by socio-environmental attributes of eatery (SEI) (-.665). 30
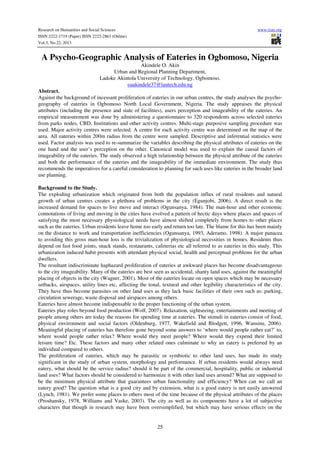
- 7. Research on Humanities and Social Sciences ISSN 2222-1719 (Paper) ISSN 2222-2863 (Online) Vol.3, No.22, 2013 www.iiste.org Figure 1: Loadings and Canonical Correlations for the Canonical Variate Pairs. EPI -.996 AII -.575 -.665 SEI Root 1 EAT PERF Root 1 ENV CUES -.917 PAI Source: Author’s Device, 2013. In the same vein but this time not unidirectional, the correlation for the second pair of the canonical variate shows that eatery performance index (EPI) correlates -.040, area imageability (AII) correlates +.222, socioenvironmental attributes (SEI) correlates +.280, while physical attributes (PAI) correlates -.670. This implies that a very low physical attribute (PAI = -.670) and a relatively high socio environmental attributes (SEI = +280) may produce an area of relatively good imageability (AII = +.222) where eateries may not perform economically (EPI = -.040). The implication of this is that, eatery performance s greatly influenced by both the physical attributes as well as the socio-environmental cues in the order of ranks that they have been listed (on table 2). However, the analysis affirmed that, if a physically poor eatery develops in a beautiful environment, such eatery would not make sales and it may lower the imageability of the entire area. Figure 2: Loadings and Canonical Correlations for the Canonical Variate Pairs. EPI -.040 AII +.222 +.280 SEI Root 2 EAT PERF Root 2 ENV CUES -.670 PAI Source: Author’s Device, 2013. Redundancy Analysis The redundancy analysis became imperative with the desire to know how much variance that is extracted by each of the canonical variates from its own side of the equation as well as from the other side of the equation. Table 4: Proportion of Variance Extracted Canonical Proportion of variance Extracted Proportion of Variance Extracted Variate from Environmental Cues from Eatery Performance Eatery 1. .367 .587 Performance 2. .043 .196 3. .005 .217 Environmental 1. .594 .371 Cues 2. .202 .045 3. .204 .005 Source: Author’s Computation, 2013. It is worthy of note that though the third root (the correlation between the third pair of the canonical variate) of the canonical correlation is not significant, yet it is involved in the analysis of how much variance is extracted from either of the dependent and independent sides of the equation. The reason is that, if the root is removed, the account will be less than one or 100%. Table 4 shows that, the first canonical variate of the dependent composites (Eatery performance), extracts 36.7%; approximately 37% of the variance in the judgement of environmental cues (Independent composites). The second canonical variate of the dependent side extracts 4.3%, while the third at the same side extracts 0.5% of variance. Taken together, the dependent canonical variates extracts 41.5% of the variance in judgement of environmental cues. The first canonical variate from the dependent side (Eatery performance) extract 58.7%, the 31
- 8. Research on Humanities and Social Sciences ISSN 2222-1719 (Paper) ISSN 2222-2863 (Online) Vol.3, No.22, 2013 www.iiste.org second extract 19.6% while the third extract 21.7% (totalling 100%) of the variance in judgement of Eatery Performance. From the independent side (Environmental Cues), the first canonical variate extract 59.4%, the second extracts 20.2% while the third extracts 20.4% (totalling 100%) of the variance in judgement of Environmental Cues. On the other hand, the first canonical variate of the independent side extracts extracts 37.1% the second extracts 4.5% while the third extracts 0.5% of the variance in judgement of Eatery performance. The analysis shows that the relationship between environmental cues and eatery performance is reliable at alpha equals .05. this implies that, when eateries desire to make economic profit, efforts should be made to improve the physical as well as socio environmental cues. Planning Implications and Conclusion Eateries are being proliferated in our urban centers today. These eateries have the propensity to contribute either positively or negatively to city imageability. The study established a reliable relationship first between good environmental cues and economic performance of eateries and between development of eateries and imageability of the larger area. Spatial attributes such as the particular location of eateries in terms of its nearness to homes, CBD, workplace, recreation centres, motor parks, major nodes, major markets, place of worship etc has been observed to positively influence the perception of eateries by users. It is therefore recommended here that major land uses should incorporate the careful planning of eateries so that different types of eateries would not accidentally spring up in awkward places but fit well into such areas to satisfy the physiological needs of urban dwellers with emphasis on functionality and convenience. A careful planning of eateries would not ordinarily help environmental management and city imageability. Planning for uses such as eatery may help enhance a sustainable environment of living, working and playing. Its bearing of sustainability stems from energy conservation where users do not need to make long trips to a far or obscure locations in search of food during important working hours. Inability to plan for eateries which have almost become indispensable to our society may trigger subtle economic losses, environmental problems which inextricably connect to health problems. Eateries, unlike some other land uses require the most hygienic places or spaces. When priority is not given to this important city element, infectious diseases may become pandemic. One important area for further research may be to investigate the proliferation of eateries and its connection with the incidence of diseases such as typhoid, cancer and others which may stem from food. The state of anomie in the city is etched from the low level of social interaction due to the nature of urban lifestyle. Eateries which is now taking care of important physiological needs of urban dwellers also has the ability to congregate people for socialization. Sightseeing, relaxation at the instance of entertainment etc can be additional functions performed by urban eateries. In the corollary, eateries may form defensible spaces; a quasipublic zone where short circuit camera may increase the chances of arresting criminals who are desperate for food. Eateries may therefore be planted by planners in strategic places even for the purpose of city policing and security. When all of these are considered, eateries would not just be a place for selling food, it may become a tangible tool to re-order our cities for efficiency in physical, social, economic and psychological spheres References. Aderamo A. J (1998); ‘Route Forms and Traffic Flows in a Medium Sized City, The Case Study of Ilorin, Nigeria’. Centerpoint 8 (1) 29-44. Aderamo A. J (2002); ‘Transport and the Nigerian Urban Environment’ Paper Delivered at 45th Annual Conference of the Nigerian Geographical Association held at Unversity of Ilorin, 30th June-3rd July, 2002. Bearden W. O and Teel J. E (1983) ‘Selected Determinants of Consumer Satisfaction and Complaints Reports’ Journal of Marketing Research Vol 20 No 1 pp21-28 Bitner M.J (1992); ‘Servicescapes: The Impact of Physical Surroundings on Customers and Employees. Journal of Marketing Vol 56 No5 April 1992 pp57-71 Bitner M. J and Hubert A. R (1994), ‘Encounter Satisfaction versus Overall Satisfaction and Quality’ in Rust R.T and Oliver R.L (eds) Service Quality: New Directions in Theory and Practice. Sage: Thousand Oaks CA pp76-77. Darley J. M and Gilbert D. T (1985); ‘Social Psychological Aspects of Environmental Psychology’ in Lindzey G and Aronson E (eds) Handbook of Social Psychology, 3rd Edition Random House Inc: New York pp79-91. Grewal D Monroe K. B and Krishnan R (1998); The Effects of Price Comparison Advertising and Buyers perception of Acquisitions Value, Transaction Value and behavioural Intentions’ Journal of Marketing, Vol 62 No 2 pp46-59. Hunt K (1979); Conceptualization and Measurement of Consumer Satisfaction and Dissatisfaction. Marketing Science Institute, Cambridge. 32
- 9. Research on Humanities and Social Sciences ISSN 2222-1719 (Paper) ISSN 2222-2863 (Online) Vol.3, No.22, 2013 www.iiste.org Earl M. A (1995); ‘Why Satisfied Customers Defect’ Havard Business Review Vol 73 No 6, pp88-99 Lewis R. C and Shoemaker S (1997) Price Sensitivity Measurement: A Tool for the Hospitality Industry. Cornel Hotel and Restaurant Administration Quarterly Vol 38 April pp44-47. Mehrabian A. And Russell J.A (1974) An Approach to Environmental Psychology. Massachusetts institute of Technology, Cambridge M. A. Ogunsamya A. A (1984); ‘Improving Urban Traffic Flow by restraint of Traffic. The case of Lagos, Nigeria’. Transport 12:184-194. Ogunsanya A. A (1993); ‘Directions in Urban Transport Studies in Nigeria’ in Ikya S. G (ed), Urban Passenger Transportation in Nigeria. Heinemann Educational Books Oliver R. L (1981) ‘Measurement of Evaluation and Satisfaction Process in Retail Settings’ Journal of Retailing, Vol 57, Fall pp25-48. Oliver R. L (1997); Satisfaction: A behavioural perspective on the Consumer. Advances in Consumer Research Vol 14, Association of ConsumerRsearch, Provo U.T pp218-222 Singh J. (1990); A Multifaceted Typology of Patient Satisfaction with a Hospital. Journal of Healthcare Management Vol 10 No 4 pp8-21 Teas K (1993); ‘Expections, Performance Evaluation and Customers’ Perception of Quality’ Journal of Marketing. Vol 57 No 4 pp18-34. Turley L. W and Milliman Ronald E (2000); ‘Atmospheric Effects on Shopping Behaviour: A review of the Experimental Evidence. Journal of Business Research Vol 49 pp193=211 Wolf Kathleen L (2007); ‘The Environmental Psychology of Shopping: Assessing the Value of Trees’. Green Design. Research Review Vol 14, No 3 pp38-43 33
- 10. This academic article was published by The International Institute for Science, Technology and Education (IISTE). The IISTE is a pioneer in the Open Access Publishing service based in the U.S. and Europe. The aim of the institute is Accelerating Global Knowledge Sharing. More information about the publisher can be found in the IISTE’s homepage: http://www.iiste.org CALL FOR JOURNAL PAPERS The IISTE is currently hosting more than 30 peer-reviewed academic journals and collaborating with academic institutions around the world. There’s no deadline for submission. Prospective authors of IISTE journals can find the submission instruction on the following page: http://www.iiste.org/journals/ The IISTE editorial team promises to the review and publish all the qualified submissions in a fast manner. All the journals articles are available online to the readers all over the world without financial, legal, or technical barriers other than those inseparable from gaining access to the internet itself. Printed version of the journals is also available upon request of readers and authors. MORE RESOURCES Book publication information: http://www.iiste.org/book/ Recent conferences: http://www.iiste.org/conference/ IISTE Knowledge Sharing Partners EBSCO, Index Copernicus, Ulrich's Periodicals Directory, JournalTOCS, PKP Open Archives Harvester, Bielefeld Academic Search Engine, Elektronische Zeitschriftenbibliothek EZB, Open J-Gate, OCLC WorldCat, Universe Digtial Library , NewJour, Google Scholar