SlideShare uma empresa Scribd logo
1 de 10
Company Note
 29 November 2011                                                                                           Thailand | Foods & Beverages
                                                                                                                                                                                                                        BUY
 Charoen Pokphand Foods                                                                                                                                                                                      (unchanged)
 SET | Reuters | Bloomberg                              CG Rating 2010                                                                                                   Price (28 November 2011)
 CPF | CPF.BK | CPF TB                                  5 | Excellent                                                                                                                                                               Bt32

 Company Update                                                                                                                                                                        12-month target price

 Acquiring more growth in China and Vietnam                                                                                                                                         Bt37 (+15.6%)

Acquisition of CP Pokphand strengthens CPF’s position in regional food
industry                                                                                                      SHARE SUMMARY
CPF is acquiring a 74.18% stake in C.P. Pokphand (0043.HK), which operates
                                                                                                             Price:
a feed business in China and feed, farm and food businesses in Vietnam. The
deal size is $2,174m and based on our 2012 net profit estimate for 0043.HK                                   52-week high                                                                                                        Bt33.00
the transaction represents a 2012F PER of 14.7x. Though the acquisition may                                  52-week low                                                                                                         Bt21.10
increase CPF’s earnings volatility, the acquisition should also strengthen CPF’s                             52-week average                                                                                                     Bt27.52
position in the global and regional food industry and provide new growth
opportunities. Based on our SOTP valuation, the deal implies upside of 2.7% to                               Stock data:
our target price of Bt37 for CPF. Maintain Buy.
                                                                                                             Issued shares:                                                                                                     7,519.9m
Feed will account for larger proportion of sales                                                             Par value:                                                                                                                   Bt1.0
Both entities in China (CPP) and Vietnam (CPV) have long records of                                          Market capitalization:                                                                                      Bt240.6bn
operations (more than 10 years). While feed accounts for about 95% of CPP’s                                  Market capitalization:                                                                          US$7,680.8m
revenue, it accounts for only 61% of CPV’s revenue. Once these companies                                     Avg. Daily Turnover:                                                                                           Bt831.9m
are fully consolidated, we estimate that feed will account for 79.7% of total                                Avg. Daily Turnover:                                                                                      US$27.4m
sales. We expect CPF to maintain its gross margin at 12-16%.                                                 Foreign Limit:                                                                                                               40.0%
                                                                                                             Foreign Ownership:                                                                                                           23.0%
Tapping into rising demand for meat products in China and Vietnam
                                                                              Free Float:                                                                                                                                                 47.7%
Given rising living standards in China and Vietnam, stronger demand for meat
                                                                              NVDR:                                                                                                                                                       4.49%
products and the Chinese government’s efforts to promote more standardized
and larger–scale farming, we expect 0043.HK to achieve a Cagr for earnings of Beta (3 years)                                                                                                                                              0.65X
 ISIEmergingMarketsPDF us-eyintranet from 123.30.70.126 on 2012-01-15 23:36:03 EST. DownloadPDF.
                                                                              TISCO’s forecast vs. consensus
25.9% in 2011F-2013F.
                                                                                                             EPS (Bt)                                  TISCO Consensus                                                               % Diff.
Deal is value accretive for CPF; maintain BUY with TP of Bt37                                                2011F                                              2.26                                         2.31                           (2.1)
Based on our conservative assumptions, the acquisition of 0043.HK should
                                                                                                             2012F                                              2.60                                         2.56                                   1.4
result in 3.2% and 6.3% earnings accretive to our existing 2012-13F earnings
estimates respectively. We believe this deal will result in fair value accretive of                          Major Shareholders (25/08/11)
2.7% to our 2012TP of Bt37. Key risks include volatility in farm product and raw                             Charoen Pokphand Group Co                                                                                                    25.1%
material prices and the outbreak of animal diseases.                                                         Charoen Pokphand Holding                                                                                                     11.8%
                                                                                                             Charoen Pokphand Foods Plc                                                                                                    6.3%
CONSOLIDATED FINANCIAL SUMMARY                                                                               Thai NVDR Co Ltd                                                                                                             5.2%
Year                                2008    2009    2010  2011F   2012F   2013F                              UBS AG London Branch                                                                                                         3.8%
Sales (Bt, m)                    156,238 165,063 189,049 212,924 218,482 226,440
EBITDA (Bt, m)                     5,818  19,597  21,859  26,732  29,738  33,806                             PRICE / PRICE RELATIVE
Net profit. b/f extra. (Bt, m)     3,046  10,190  12,554  15,928  18,329  21,671
                                                                                                              Bt
Net profit. b/f extra. (YoY%)      364.8   234.5    23.2    26.9    15.1    18.2                              35

Net profit (Bt, m)                 3,128  10,381  13,563  15,928  18,329  21,671                              30

Net profit (YoY%)                  145.3   231.8    30.7    17.4    15.1    18.2                              25

Basic EPS (Bt)                      0.44    1.52    1.92    2.26    2.60    3.07                              20

EPS (YoY%)                         145.3   245.5    26.6    17.4    15.1    18.2                              15

                                                                                                              10
DPS (Bt)                             0.2     0.7     1.0     1.1     1.3     1.5
                                                                                                               5
PER (X)                              7.2     7.4    12.1    14.2    12.3    10.4
                                                                                                               0
PCF (X)                             37.6     4.6    16.3    12.1     9.8     8.6
                                                                                                                   Nov-09


                                                                                                                                                                                  Nov-10


                                                                                                                                                                                                                                                     Nov-11
                                                                                                                            Jan-10


                                                                                                                                                       Jun-10


                                                                                                                                                                                           Jan-11


                                                                                                                                                                                                                       Jun-11
                                                                                                                                     Mar-10

                                                                                                                                              May-10


                                                                                                                                                                Aug-10

                                                                                                                                                                         Oct-10


                                                                                                                                                                                                    Mar-11

                                                                                                                                                                                                              May-11


                                                                                                                                                                                                                                 Aug-11

                                                                                                                                                                                                                                           Oct-11


PBV (X)                              4.1     1.4     2.5     3.1     2.7     2.4
EV/EBITDA (X)                       39.9     5.9     8.9     9.8     8.6     7.3                             Source: Reuters
DPS (Bt)                             0.2     0.7     1.0     1.1     1.3     1.5                             Performance (%)                                                      -1m                          -3m                          -12m
Yield (%)                            6.0     6.5     4.5     3.5     4.1     4.8                             CPF                                                                  5.79                         4.92                        30.08
ROE (%)                              7.1    20.7    23.4    23.8    23.6    24.7                             SET                                                                  0.97                       (5.11)                        (0.76)
D/E (x)                              1.4     1.1     1.1     0.8     0.6     0.5
Source: DB TISCO                                  Note : use average price for historical PER, PBV, Yield


 TISCO Research
 (66) 2633 6999
 tiscoresearch@tisco.co.th

 Downloaded by us-eyintranet from 123.30.70.126 at 2012-01-15 23:36:03 EST. ISI Emerging Markets. Unauthorized Distribution Prohibited.
Company Note – CPF


                                    CPF to acquire 74.18% stake in 43.HK
                                    On Friday CPF announced that its board of directors had approved the acquisition of a
                                    74.18% stake in C.P. Pokphand (43.HK), an operator of a feed business in China (CPP)
                                    and feed, farm and food businesses in Vietnam (CPV). The deal size is USD2,174m
                                    (Bt66,307m). CPF will pay for the acquisition by issuing 694m of its own shares to the CP
                                    Group (31.4% of the deal value at Bt30/share with a total value of USD683m or Bt20.8bn).
                                    The remainder (USD1,491m or Bt45,475m) will be paid by cash which may come from
                                    internal cash flow and debt. After the acquisition, CPF will hold a 74.18% stake in 43.HK
                                    (CPF does not have to make a tender offer for the rest of 43.HK shares, according to
                                    Hong Kong Stock Exchange rules) and 100% in CPV (CPF already has a 29.18% holding
                                    in CPV). Meanwhile the CP Group’s stake in CPF will increase to 49.9% from 42.15% pre-
                                    acquisition (see details in Figs. 1-3).

                                     Figure 1. Details of the transaction
                                                            C.P. Pokphand (Hang Seng ticker: 43), an operator of feed businesses in China and
                                     Target
                                                            Vietnam
                                                            USD2,174m or Bt66,307m: CPF is buying at HKD0.9 per share and will pay by issuing
                                     Deal value             694m CPF shares (at Bt30/share or a total of USD683m or Bt20.8bn) and cash of
                                                            USD1,491m or Bt45.5bn
                                                            CPF to buy 74.18% of 43.HK shares from CP Group. After the transaction, CPF will hold
                                     Deal structure
                                                            a 74.18% stake in 43.HK while CP Group will hold a 49.9% holding in CPF.
                                     Advisor                UBS
                                     Source: Company data


 Figure 2. Shareholding structure
                                 Pre-acquisition                                                          Post-acquisition

      Public            CPG & related parties           CPIH            Public                   Public        CPG & related parties

                              70.22%         3.96%                        50.10%           49.90%
ISIEmergingMarketsPDF us-eyintranet from 123.30.70.126 on 2012-01-15 23:36:03 EST. DownloadPDF.
                  42.15%
        57.85%         CPF              CPP      25.82%                           CPF
                     (CPF TB)          (43 HK)                                  (CPF TB)
                           29.18%                            70.82%
                                                                                                                   74.18%
                                          CPV-                                                                 CPP
                                        Vietnam                                                               (43 HK)


                                                                                                                   70.82%
                                                                                               29.18%          CPV-
                                                                                                             Vietnam

 Source: Company data


                                     Figure 3. Indicative timeline
                                     BoD's approval                                November 25, 2011
                                     Book closure                                  December 21, 2011
                                     Record date                                   December 22, 2011
                                     EGM                                           January 18, 2012
                                     Source: Company data


2
29 November 2011

Downloaded by us-eyintranet from 123.30.70.126 at 2012-01-15 23:36:03 EST. ISI Emerging Markets. Unauthorized Distribution Prohibited.
Company Note – CPF

                                 Adding to feed business profile
                                 43.HK comprises two main entities: 1) C.P. Pokphand (CPP) which operates a feed
                                 business in China. This was acquired by 43.HK in November 2009 and consolidated into
                                 the company in February 2010; and 2) C.P. Vietnam (CPV) which operates feed, farm and
                                 food businesses in Vietnam. The entity was acquired in early 2011 and has been fully
                                 consolidated since July 2011. Both companies have a long track record (more than 10
                                 years) in their respective markets. While feed accounts for about 95% of CPP’s revenue,
                                 it accounts for just 61% of CPV’s revenue (farm and food operations account for 34%).
                                 Once they are fully consolidated, we estimate that feed will account for 79.7% of CPF’s
                                 total sales. We believe it is likely that CPF’s earnings may experience with more volatility
                                 as a result of the increased contribution of feed business into its business profiles
                                 (revenue contribution from feed may increase from approximately 40% to now a little bit
                                 over 50%.)

Figure 4. 43.HK’s revenue structure
                 1H11 Revenue structure by business                                     2011F Revenue contribution by entity

                                                                                                                     CPV
                                                                                                                     38%
                                              Others
                                               5%


                       Feed                                                                                              Others
                       95%                                                                                                4%
                                                                                             CPP
                                                                                             58%

Source: Company data


                                 Expect strong earnings growth by 43.HK
ISIEmergingMarketsPDF us-eyintranet from 123.30.70.126 on 2012-01-15 23:36:03 EST. DownloadPDF.meat
                         Given rising living standards in China and Vietnam, stronger demand for                products
                                 and the Chinese government’s efforts to promote more standardized and larger–scale
                                 farming (partly to avoid the food scares of recent years), we believe that CPP and CPV
                                 should achieve moderate to high earnings growth over the next few years (see Fig. 5).
                                 The feed business is operated on a cost-plus basis (historical data shows that gross
                                 margins range from 12-16%, with lower raw material prices normally resulting in higher
                                 margins). There is also room for value-added innovations (with R&D and quality feed,
                                 farm yields can be improved). For our earnings estimates, we used the following
                                 assumptions:

                                 1) Raw materials: these account for 85% of total production costs of which corn and
                                    soybean meal accounts for almost 70%. Therefore, we used corn and soybean meal
                                    price movements as the main benchmark in calculating sales prices and gross
                                    margin.

                                 2) Sales volume: based on the consumption outlook, historical performance and level of
                                    competition, we expect sales volume growth of 10% for CPP and 8-15% for CPV.


                                                                                                                                         3
                                                                                                                        29 November 2011

Downloaded by us-eyintranet from 123.30.70.126 at 2012-01-15 23:36:03 EST. ISI Emerging Markets. Unauthorized Distribution Prohibited.
Company Note – CPF


                                   Figure 5. Assumptions and earnings estimates of 0043.HK
                           43.HK                          2009        2010      2011F      2012F                                           2013F
                           Main assumptions
                           Corn (US$/ ton)                  147         169        237        225                                            217
                           Change (%)                    (15.2)         1.2       27.4       (6.7)                                          (1.6)
                           Soybean meal (US$/ ton)          326         301        349        320                                            322
                           Change (%)                     (2.2)       (7.8)       16.2       (8.3)                                            0.6
                           Sales volume assumptions
                           Livestock feed (‘000 tons)
                           China                         3,584       3,058       3,364      3,700                                          4,070
                           Growth (%)                                (14.7)       10.0       10.0                                           10.0
                           Vietnam                          892      1,022       1,060      1,210                                          1,404
                           Growth (%)                                  14.7        3.7       14.1                                           16.1
                           Aquaculture feed (‘000 tons)
                           China                            422         365        402        442                                            486
                           Growth (%)                                (13.5)       10.0       10.0                                           10.0
                           Vietnam                          271         237        275        302                                            329
                           Growth (%)                                (12.6)       15.8         9.8                                           9.0
                           43.HK
                           Revenue (US$, m)                  74      1,951       2,780      3,897                                          4,323
                           EBIT (US$, m)                     10         198        282        373                                            411
                           Net profit (US$, m)                9         133        180        242                                            266
                           Revenue growth (%)              15.1        50.2       15.0       15.0                                           15.0
                           Net profit growth (%)         187.1     1,453.0        35.4       34.7                                           10.0
                           Gross margin (%)                12.8        15.9       17.5       16.6                                           16.5
                           EBIT margin (%)                 14.0        10.1       10.1         9.6                                           9.5
                           CPP
                           Revenue (US$, m)              1,948       1,839       2,112      2,279                                          2,487
                           EBIT (US$, m)                    102         186        223        240                                            258
                           Net profit (US$, m)               53         125        145        156                                            168
                           Revenue growth (%)               0.2       (5.6)       14.8
ISIEmergingMarketsPDF us-eyintranet from 123.30.70.126 on 2012-01-15 23:36:03 EST. DownloadPDF.7.9                                           9.1
                           Net profit growth (%)           60.0      135.1        16.0         7.8                                           7.5
                           Gross margin (%)                13.4        15.9       17.6       17.6                                           17.4
                           EBIT margin (%)                  5.2        10.1       10.6       10.5                                           10.4
                           CPV
                           Revenue (US$, m)                 869      1,046       1,297      1,471                                          1,667
                           EBIT (US$, m)                     61          63         84        100                                            115
                           Net profit (US$, m)               17          11         26          32                                            37
                           Revenue growth (%)               4.1        20.4       23.9       13.4                                           13.3
                           Net profit growth (%)           12.7      (35.7)      135.4       22.6                                           15.7
                           Gross margin (%)                14.6        12.6       13.1       13.4                                           13.5
                           EBIT margin (%)                  7.0         6.1        6.5         6.8                                           6.9
                                   Source: Company data, Deutsche Bank


 Figure 6. China’s feed and meat consumption outlook
                        China's Feed volume                                       Pork and poultry consuption per capita in China
     Tons, m                                                                kg
                            CAGR = 7.8%
    160                                                       139
                                                                            70       Pork     Poultry
                                             137
    140                      123                                            60
    120          111                                                                                                                11.7
                                                                            50                                          10.7
    100                                                                              9.7        10.1        10.3
                                                                            40
     80
                                                                            30
     60                                                                                                                             47.8
                                                                            20      38.2        39.3        40.3        42.6
     40
     20                                                                     10
      0                                                                      0
                2006        2007            2008             2009                  2011F       2012F       2013F       2015F       2020F

 Source: Company data


4
29 November 2011

Downloaded by us-eyintranet from 123.30.70.126 at 2012-01-15 23:36:03 EST. ISI Emerging Markets. Unauthorized Distribution Prohibited.
Company Note – CPF


                                   Figure 7. Vietnam livestock feed outlook
                                                                         V iet na m 's liv es t oc k f eed pr oduc t ion

                                      Tons, m
                                      25                    Commercial Feed          Home mix

                                      20
                                                                                                                                  4.0
                                      15
                                                                                                              6.3
                                                                                    6.5
                                                           7.3
                                      10
                                                                                                                                  16.0
                                        5                                           9.2                       10.5
                                                           7.5
                                        0
                                                       2009                        2010                      2011F               2015F

                                   Source: Company data, Deutsche Bank


                                 Slightly positive to CPF’s earnings outlook in 2012-13 due to higher debt burden
                                 We expect the acquisition of 0043.HK to result in a sharp rise in interest costs for CPF for
                                 the first few years. Although we estimate it will boost CPF’s revenue by 43.8% and 56.3%
                                 respectively in 2012-13, the deal will increase its debt burden. We believe CPF may need
                                 to issue debentures worth Bt40bn to finance this deal next year. This would result in
                                 additional interest expenses of Bt1.8bn and Bt2.8bn in 2012-13F (based on an effective
                                 interest rate of 4.5%). We expect CPF’s D/E and D/EBITDA to increase from 0.6x and
                                 1.3x to 1.2x and 2.3x respectively. However, with a projected rise in its EBITDA to
                                 Bt38.8bn and Bt48.4bn for these two years, we believe CPF’s cash flow should remain
                                 solid.

                                   Figure 8. Estimated impact to CPF’s revenue, earnings and debt levels
                                                                      2011F            2012F                                              2013F
                           Revenue (Bt, m)
ISIEmergingMarketsPDF us-eyintranet from 123.30.70.126 on 2012-01-15 212,924
                           Pre-acquisition                                           218,482
                                                                     23:36:03 EST. DownloadPDF.                                          226,440
                           Post-acquisition                          212,924         314,218                                             353,878
                           % change                                       0.0            43.8                                               56.3
                           EBITDA (Bt, m)
                           Pre-acquisition                            26,737          29,714                                              33,772
                           Post-acquisition                           26,737          38,797                                              48,397
                           % change                                       0.0            30.6                                               43.3
                           Interest expense (Bt, m)
                           Pre-acquisition                             1,463            1,236                                                895
                           Post-acquisition                            1,463            3,084                                              3,684
                           % change                                       0.0           149.5                                              311.8
                           Net profit (Bt, m)
                           Pre-acquisition                            15,928          18,329                                              21,671
                           Post-acquisition                           15,932          20,762                                              25,263
                           % change                                     (0.0)          (11.7)                                              (14.2)
                           EPS-fully diluted (Bt)
                           Pre-acquisition                                2.3             2.6                                                3.1
                           Post-acquisition                               2.3             2.7                                                3.3
                           % change                                       0.0             3.2                                                6.3
                           Interest bearing debt (Bt, m)
                           Pre-acquisition                            44,496          37,459                                              29,974
                           Post-acquisition                           44,496          89,117                                              89,206
                           % change                                       0.0           137.9                                              197.6
                           Interest bearing debt/ EBITDA (x)
                           Pre-acquisition                                1.7             1.3                                                0.9
                           Post-acquisition                               1.7             2.3                                                1.8
                           Debt to equity (x)
                           Pre-acquisition                                0.8             0.6                                                0.5
                           Post-acquisition                               0.8             1.2                                                1.1
                                   Source: Deutsche Bank


                                                                                                                                               5
                                                                                                                             29 November 2011

Downloaded by us-eyintranet from 123.30.70.126 at 2012-01-15 23:36:03 EST. ISI Emerging Markets. Unauthorized Distribution Prohibited.
Company Note – CPF

                                 Deal to create another 2.7% accretive value to our current TP
                                 We tried to gauge the accretive value of the deal to CPF by using SOTP and applied
                                 same multiples that we used with valuation of our current CPF’s 2012TP of Bt37 (we used
                                 12.5x 2012PER for core business, DCF for contribution from CPALL and 10.7x 2012PER
                                 for feed business). For the purposes of our valuation we split its business into three parts:
                                 1) domestic and exports sales, with contributions from overseas subsidiaries. We still
                                 value this core business as a food company which is striving to increase value-added
                                 products (domestic and regional food stocks are trading on an average PER of 12.5x for
                                 2012F), 2) CPALL—as of 9M11, CPF holds a 30% stake in CPALL. We valued CPALL’s
                                 contribution to CPF based on our TP of Bt54/share and; 3) 0043.HK—as almost all of
                                 0043.HK’s revenue comes from its feed business, we valued the company based on a
                                 conservative 2012F PER of 10.5x (which is in line with the average Thai and regional
                                 multiple for such businesses (as shown in Fig. 9). Based on the assumptions listed above,
                                 CPF’s fair value post acquisition would increase to Bt38, implying upside of 2.7% to our
                                 current TP of Bt37. This would also put the stock on a 2012F PER of 14.6x.

                                   Figure 9. CPF’s fair value after acquisition of Bt38 is not expensive
                                   even when compared with other feed manufacturers
                                   Company                       Country                Mkt Cap          PER (x)                  PBV (x)                ROE (%)
                                                                                       (US$, m)       2011F 2012F              2011F 2012F            2011F 2012F
                           C.P. Food
                                                Thailand                                 46,936.9         14.4       12.3          3.1         2.7       23.8   23.6
                           Pre- acquisition
                           C.P. Food
                                                Thailand                                                  14.2       11.9          3.1         2.6       23.8   24.8
                           Post- acquisition
                           Sichuan New Hope     China                                    34,093.1         15.9       16.3          3.4         0.0       24.1    na.
                           C.P. Indonesia       Indonesia                                26,409.5         15.2       16.9          6.6         6.4       51.8   38.7
                           Sinofert Holding     Hong Kong                                12,342.0         17.8       11.5          1.0         0.9        5.5    9.7
                           Jiangxi Zhengvang
                                                China                                     4,457.1         36.7       31.0          4.3         3.8       11.8   16.3
                           Tech –A
                           Global Bio-Chem
                                                Hong Kong                                 4,186.7          5.9         4.3         0.6         0.4       10.3   12.8
                           Technology
                           Xinjiang Tiankang
                                                China                                     3,454.6         31.3       22.1          3.0         3.0       10.1   14.3
                           Animal-AA
ISIEmergingMarketsPDF us-eyintranet from 123.30.70.126 on
                           Dachan Food Asia     Hong Kong                                2012-01-15 10.7
                                                                                          1,175.3    23:36:03 EST. DownloadPDF.
                                                                                                            n.a.    0.7    0.0                            7.0   n.a.
                           Lee Feed Mill        Thailand                                    458.2    7.7    n.a.    1.1    0.0                           14.0   n.a.
                           Weighted average (pre-acquisition)                                       15.7    15.2    3.9    2.7                           27.3   18.7
                                   Source: Company data, Deutsche Bank, Bloomberg Finance LP; based on closing date price of November 28th, 2011.


                                   Figure 10. Based on our post-acquisition assumptions, CPF’’s fair
                                   value is Bt38.0/share
                                                                               Base (Bt/share)                   Value (Bt/share)               Target multiple (x)
                                   Sum-of-the-part valuation                 Pre-acq       Post-acq          Pre-acq         Post-acq          Pre-acq      Post-acq
                                   Core Business                                   2.0              1.7            25.4              20.9            12.5       12.5
                                   CPALL                                                                     DCF: 9.4 (Based on
                                                                                                            CPALL's DB TP of Bt54
                                                                                   9.9              9.4                                                  n.a.
                                                                                                             and CPF's holding in
                                                                                                               CPALL of 30%)
                                   43.HK                                          0.16            0.68               1.8              7.3            10.7       10.7
                                   Rounding                                                                          0.3              0.3
                                   CPF's 2012 TP (Bt/ share)                                                       37.0              38.0
                                   % change                                                                                         2.7%
                                   Source: Deutsche Bank


6
29 November 2011

Downloaded by us-eyintranet from 123.30.70.126 at 2012-01-15 23:36:03 EST. ISI Emerging Markets. Unauthorized Distribution Prohibited.
Company Note – CPF

                                 Risk factors and concerns
                                 Volatility in farm commodity prices
                                 Volatility in prices of commodities such as pork, chicken, corn and soybean meal can
                                 have a major impact on CPF’s gross margin and profitability. CPF’s share price usually
                                 comes under downward pressure when prices of raw materials such as corn and soybean
                                 meal rise. On the other hand, its share price tends to increase when pork and chicken
                                 prices are strong. Although concerns about higher raw material costs may pressure CPF’s
                                 share price in the short term, the company has mitigated the risk by buying forward
                                 contracts for its major raw material and has also built up corn stockpiles.

                                 Outbreak of disease in pigs and poultry
                                 Another key risk for CPF is outbreaks of disease in pigs and poultry which can lead to a
                                 dramatic decline in the consumption of meat products. During the bird flu outbreak in 2004
                                 many Thais stopped eating chicken while several countries banned the import of poultry
                                 from Thailand. As a result, domestic chicken prices collapsed and CPF posted an
                                 earnings loss during one quarter.

                                 Commerce Ministry price control
                                 Government intervention to control food prices can also put pressure on CPF’s margins.
                                 During periods when producers plan to raise the price of basic necessities at the same
                                 time, the Commerce Ministry may take several months to approve price increases in order
                                 to lessen the impact on consumers. Accordingly, this may harm the company’s ability to
                                 pass on the increased costs of products and erode its margins. We believe that one
                                 product particularly vulnerable to price controls is feed.


ISIEmergingMarketsPDF us-eyintranet from 123.30.70.126 on 2012-01-15 23:36:03 EST. DownloadPDF.


                                                                                                                                         7
                                                                                                                        29 November 2011

Downloaded by us-eyintranet from 123.30.70.126 at 2012-01-15 23:36:03 EST. ISI Emerging Markets. Unauthorized Distribution Prohibited.
Company Note – CPF


    CONSOLIDATED INCOME STATEMENT (Bt, m)                                                 CONSOLIDATED CASHFLOW STATEMENT (Bt, m)

                                                   Year Ended December 31,                                                                      Year Ended December 31,
                                           2009      2010     2011F    2012F     2013F                                             2009              2010         2011F      2012F     2013F


    Sales                                165,063 189,049     212,924 218,482    226,440   Cash Flows from Operations (CFO)
    Cost of Goods Sold                   135,871 156,351     173,148 176,021    180,015   Net Profit                              10,381         13,563           15,928     18,329    21,671
    Gross Profit                          29,192   32,698     39,776   42,462    46,426   Adjusting Items Not Affecting Cash
    S&A Expense                           18,142   20,632     23,422   24,033    24,908     Depreciation and Amortization          4,719             4,798         5,032      5,216     5,379
    Interest Expense                       1,949    1,824      1,463    1,236      894      Unrealized FX Loss (Gain)              (191)                0             0           0         0
    Other Income                           2,237    2,484      2,030    2,087     2,163     Others                               (1,391)                0           325         374       442
    Net Profit before Tax                 12,929   15,238     20,237   23,287    27,533     + (-) in Working Capital               3,702        (9,999)       (2,688)         (831)    (1,189)
    Income Tax                             2,539    2,388      3,984    4,584     5,420   Net CFO                                 17,220             9,286        18,597     23,087    26,304
    Net Profit before M.I.                10,390   12,850     16,253   18,703    22,113   Cash Flows from Investing Activities (CFI)
    Net (Profit) Loss of M.I.              (200)     (296)     (325)    (374)     (442)     - (+) in Short-term Investment             (37)     (3,726)               0           0         0
    Net Profit before Extra. Items        10,190   12,554     15,928   18,329    21,671     - (+) in Investment in Affiliates            0              0             0           0         0
    FX Gain (Loss) (Net of Tax)             191     1,009         0        0         0      - (+) in Fixed Assets                (6,434)        (6,285)       (7,395)        (6,508)   (7,229)
    Other Gain (Loss)                         0         0         0        0         0    Net CFI                                (4,951)        (7,995)       (7,705)        (6,334)   (7,285)
    Net Profit                            10,381   13,563     15,928   18,329    21,671   Cash Flows from Financing Activities (CFF)
                                                                                            + (-) in Debt Financing              (3,856)             (927)    (5,686)        (7,041)   (7,491)
                                                                                            + (-) in Minority Interest                 200              0           325         374       442
                                                                                            + (-) in Share Capital and Premium   (1,074)             3,500            0           0         0
                                                                                            + (-) in Warrant                             0              0             0           0         0
    Revenue Growth (%)                       5.6     14.5       12.6      2.6       3.6     + (-) in Equity Adjustment             2,397              (87)         3,514      (325)     (374)
    Gross Margin (%)                        17.7     17.3       18.7     19.4      20.5     - Cash Dividend Paid                 (2,329)        (6,884)       (7,964)        (9,164) (10,836)
    Net Profit Margin (%)                    6.3       7.2       7.5      8.4       9.6   Net CFF                                (4,862)        (4,399) (10,137) (16,531) (18,700)
    Net Profit Growth (%)                  231.8     30.7       17.4     15.1      18.2   Net Cash Increase (Decrease)             7,070        (2,762)             756         222       318


    CONSOLIDATED QUARTERLY RESULTS (Bt, m)                                                 CONSOLIDATED BALANCE SHEET (Bt, m)

                                           3Q10      4Q10      1Q11     2Q11      3Q11                                                                  As of December 31,
    Sales Revenue                         50,296   47,282     45,744   53,230    54,446                                                   2009          2010        2011F     2012F    2013F
    Cost of Sales                         41,056   41,095     38,357   43,578    44,708   Current Assets                                53,434        58,971       62,551     63,845   65,692
    Gross Profit                           9,239    6,186      7,387    9,652     9,739   Current Liabilities                           29,637        32,827       30,772     26,388   24,322
    S&A Expenses                           5,064    5,879      4,581    4,444     4,585   Total Assets                                 115,698 126,320 132,572 134,985 138,737
    Interest Expense                        400       477       448      499       400    Total Liabilities                             60,719        65,217       59,667     52,866   45,715
ISIEmergingMarketsPDF us-eyintranet from 123.30.70.126 on 2012-01-15 23:36:03 EST. DownloadPDF.
    Other Income                            514     1,243       311      308       313    Minority Interest                              3,095          3,088        4,285     4,334    4,402
    Net Profit before Tax                  4,926    1,735      3,426    5,981     5,938   Total Equity                                  51,885        58,015       68,621     77,785   88,621
    Income Tax from Operations              778      (180)      623     1,042     1,043   Paid-up Capital                                7,520          7,520        7,520     7,520    7,520
    Net Profit before M.I.                 4,148    1,915      2,803    4,940     4,894
    Net (Profit) Loss of M.I.               (88)      (99)      (40)     (40)       (3)
    Net Profit before Extra. Items         4,060    1,816      2,763    4,899     4,891
    FX Gain (Loss) (Net of Tax)             223       236        23      (30)       21
    Gain (Loss) from Asset Write-down         0         0         0        0         0
    Other Gain (Loss)                         0         0       693        0       168
    Net Profit                             4,284    2,052      3,479    4,869     5,083


                                                                                                                                                                     3Q11
    Revenue Growth (YoY %)                  14.3       3.6       4.9     11.2       8.3   Market Cap (Bt, m)                                                      240,637
    Gross Margin (%)                        18.4     13.1       16.1     18.1      17.9   Cash&cash equivalent (Bt, m)                                               8,704
    Net Profit Margin (%)                    8.5       4.3       7.6      9.1       9.3   Borrowings (Bt, m)                                                       51,922
    Net Profit Growth (YoY %)                4.1     (2.8)       7.9     21.7      18.7   Gearing (X)                                                                  0.4


    KEY FINANCIAL RATIOS                                                                  FORECAST ASSUMPTIONS

                                           2009      2010     2011F    2012F     2013F                                                    2009          2010        2011F     2012F    2013F
    Other Incomes to Total Revenue (%)       1.4       1.3       1.0      1.0       1.0   Total Production ('000 Tons/year)
    S&A Expenses to Sales (%)               11.0     10.9       11.0     11.0      11.0   - Shrimp Feed                                       519        638          808        808      808
    Current (Times)                          1.8       1.8       2.0      2.4       2.7   - Animal Feed                                  2,058          2,040        2,040     2,210    2,295
    Quick (Times)                            0.9       0.8       0.9      1.1       1.3   - Pork                                              377        396          404        412      420
    A/R Turnover (Days)                     31.5     28.7       28.2     29.6      29.5   - Chicken                                           370        388          404        412      420
    Inventory Turnover (Days)               72.8     70.2       71.3     70.6      70.3    - Shrimp                                            64            80       100        105      111
    A/P Turnover (Days)                     22.4     22.0       21.0     21.3      21.2   Domestic Price
    Debt to Equity (Times)                   1.1       1.1       0.8      0.6       0.5   - Pork                                              57.0       58.7         58.2      57.0     57.0
    Net Debt to Equity (Times)               0.5       0.6       0.5      0.5       0.4   - Chicken                                           37.3       40.0         40.8      37.6     37.6
    Gearing (Times)                          0.4       0.4       0.3      0.3       0.2   - Shrimp                                       139.0          144.7        152.1     138.9    138.9
    Interest Coverage (Times)               10.1     12.0       18.3     24.1      37.8   Avg. Exchange Rate (Bt : US$1)                      34.2       31.8         29.5      29.5     29.5
    Return on Avg. Assets (%)                9.3     11.2       12.3     13.7      15.8   Ending Exchange Rate (Bt : US$1)                    32.8       31.5         31.5      29.5     29.5
    Return on Avg. Equity (%)               21.4     24.7       25.2     25.0      26.0


8
29 November 2011

Downloaded by us-eyintranet from 123.30.70.126 at 2012-01-15 23:36:03 EST. ISI Emerging Markets. Unauthorized Distribution Prohibited.
Company Note – CPF


 Net profit                                                                                                              PE Band

  Bt, m                                                                                                        %         Bt
 25,000                                                                                                        250        60
                                                                                                               200        50
 20,000
                                                                                                               150        40
 15,000                                                                                                        100        30
 10,000                                                                                                        50
                                                                                                                          20
                                                                                                               0
   5,000                                                                                                                  10
                                                                                                               (50)
                                                                                                                           0
          0                                                                                                    (100)


                                                                                                                               Jan-06


                                                                                                                                         Jan-07


                                                                                                                                                  Jan-08


                                                                                                                                                                 Jan-09


                                                                                                                                                                          Jan-10


                                                                                                                                                                                        Jan-11


                                                                                                                                                                                                   Jan-12


                                                                                                                                                                                                            Jan-13
                      2006


                                    2007


                                                  2008


                                                           2009


                                                                  2010


                                                                         2011F


                                                                                   2012F

                             Profit (Bt, m)                        Net Profit Growth (%)       2013F                                    20X                16X              12X                   8X                 4X
 Sources : Company data, TISCO Research                                                                                  Sources : Company data, TISCO Research


 ROAA, ROAE                                                                                                              PBV Band

  %                                                                                                                 %     Bt
  18                                                                                                                30   70
  15                                                                                                                25   60
                                                                                                                         50
  12                                                                                                                20
                                                                                                                         40
   9                                                                                                                15   30
   6                                                                                                                10   20
   3                                                                                                                5    10
                                                                                                                           0
   0                                                                                                                0
                                                                                                                               Jan-06


                                                                                                                                         Jan-07


                                                                                                                                                  Jan-08


                                                                                                                                                                 Jan-09


                                                                                                                                                                          Jan-10


                                                                                                                                                                                        Jan-11


                                                                                                                                                                                                   Jan-12


                                                                                                                                                                                                            Jan-13
              2006


                             2007


                                           2008


                                                         2009


                                                                  2010


                                                                          2011F


                                                                                       2012F


                                                                                                       2013F


ISIEmergingMarketsPDF us-eyintranet from 123.30.70.126 on 2012-01-15 23:36:03 EST. 3X
            ROAA (LHS)          ROAE (RHS)                      5X        4X                2X
                                                                                   DownloadPDF.                                                                                                                      1X
 Sources : Company data, TISCO Research                                                                                  Sources : Company data, TISCO Research


 Profit margin                                                                                                           EV/EBITDA Band
  %                                                                                                                 %     Bt

  25                                                                                                                12   70
                                                                                                                         60
  20                                                                                                                10
                                                                                                                         50
                                                                                                                    8
  15                                                                                                                     40
                                                                                                                    6    30
  10
                                                                                                                    4    20
   5                                                                                                                     10
                                                                                                                    2
                                                                                                                           0
   0                                                                                                                0
                                                                                                                               Jan-06


                                                                                                                                         Jan-07


                                                                                                                                                  Jan-08


                                                                                                                                                                 Jan-09


                                                                                                                                                                          Jan-10


                                                                                                                                                                                        Jan-11


                                                                                                                                                                                                   Jan-12


                                                                                                                                                                                                            Jan-13
              2006


                             2007


                                           2008


                                                         2009


                                                                  2010


                                                                           2011F


                                                                                       2012F


                                                                                                       2013F


                     Gross Margin (LHS)                             Net Profit Margin (RHS)                                              15X                12X                    9X             6X                 3X
 Sources : Company data, TISCO Research                                                                                  Sources : Company data, TISCO Research


                                                                                                                                                                                                                          9
                                                                                                                                                                                                 29 November 2011

Downloaded by us-eyintranet from 123.30.70.126 at 2012-01-15 23:36:03 EST. ISI Emerging Markets. Unauthorized Distribution Prohibited.
Company Note – CPF

                                TISCO Securities Company Limited
                                                                        www.tiscosec.com
                                                                                        Bangkok
                               48/8 TISCO Tower 4th Floor, North Sathorn Road, Bangkok 10500, Thailand
                                       Tel : (66) 2633 6999 Fax : (66) 2633 6490, (66) 2633 6660

                                                                               Esplanade Branch
     99 Esplanade Shopping Center, Room 202-2, 2nd Floor, Ratchadapisek Road, Din Daeng, Bangkok 10400
                          Tel : (66) 2641 3251, (66) 2641 3252 Fax : (66) 2641 3253

                                                                                      Chiang Mai
                     275/4, 2nd Floor, Chang Phuak Road, Chang Phuak, Muang District, Chiang Mai 50300
                                              Tel. 0 5322 4722 Fax. 0 5322 4711

                                                                                 Nakhon Pathom
                             386, 388 Petchkasem Road, Prapatone, Muang District, Nakhon Pathom 73000
                                                Tel: 0 3421 1812 Fax: 0 3425 1676

                                                                              Nakhon Ratchasima
             Tesco Lotus Korat, 719/5 Mittraphap Road, Naimuang, Muang District, Nakhon Ratchasima 30000
                                            Tel: 0 4425 7752 Fax: 0 4425 3752

                                                                                     Udon Thani
                                227/21 2nd Floor, Udondussadee Road, Muang District, Udon Thani 41000
                                                   Tel: 0 4224 6888 Fax: 0 4224 5793
ISIEmergingMarketsPDF us-eyintranet from 123.30.70.126 on 2012-01-15 23:36:03 EST. DownloadPDF.


                                                                   Score Range                                        Level                                   Description
                                                                     90 - 100                                           5                                       Excellent
                                                                     80 - 89                                            4                                      Very Good
                                                                     70 - 79                                            3                                         Good
        Corporate Governance Report                                  60 - 69                                            2                                      Satisfactory
        of Thai Listed Companies 2010                                50 - 59                                            1                                         Pass
                                                                 < 50 or not rated                                     n.a.                                        n.a.

     Disclaimer
     The disclosure of the survey result of the Thai Institute of Directors Association (“IOD”) regarding corporate governance is made pursuant to the policy of
     the Office of lthe Securities and Exchange Commission. The survey of the IOD is based on the information of a company listed on the Stock Exchange of
     Thailand and the Market for Alternative Investment disclosed to the public and able to be accessed by a general public investor. The result, therefore, is
     from the perspective of a third party. It is not an evaluation of operation and is not based on inside information. (In order to recognize well performed
     companies, companies classified into the three highest score groups (Good, Very Good, and Excellent) will be announced to the public).
     The survey result is as of the date appearing in the Corporate Governance Report of Thai Listed Companies. As a result, the survey result may be
     changed after that date. TISCO Securities Company Limited does not confirm nor certify the accuracy of such survey result.


     The information, statements, forecasts and projections contained herein, including any expression of opinion, are based upon sources believed to be reliable but their accuracy
     completeness or correctness are not guaranteed. Expressions of opinion herein were arrived at after due and careful consideration and they were based upon the best information
     then known to us, and in our opinion are fair and reasonable in the circumstances prevailing at the time. Expressions of opinion contained herein are subject to change without
     notice. This document is not, and should not be construed as, an offer or the solicitation of an offer to buy or sell any securities. TISCO and other companies in the TISCO Group
     and/or their officers, directors and employees may have positions and may affect transactions in securities of companies mentioned herein and may also perform or seek to perform
     investment banking services for these companies. No person is authorized to give any information or to make any representation not contained in this document and any information
     or representation not contained in this document must not be relied upon as having been authorized by or on behalf of TISCO. This document is for private circulation only and is
     not for publication in the press or elsewhere. TISCO accepts no liability whatsoever for any direct or consequential loss arising from any use of this document or its content. The use
     of any information, statements forecasts and projections contained herein shall be at the sole discretion and risk of the user.

     Important Notice : This Document may only be issued or passed on to any person in the United Kingdom if that person is of a kind described in Article 11 of the Financial Services
     1986 (Investment advertisements) Exemptions Order 1996 or otherwise pursuant to exemptions to Section 57 of the Financial Services Act 1986. In addition, no person who is an
10   Authorised Person may issue or pass on this Document, or otherwise promote the Company, to any person in the United Kingdom other than under the rules of self-regulatory
     organisations or the Financial Services Authority applicable to such Authorised Persons. This Document is confidential and is intended solely for the use of its recipient. Any
29 November 2011
     duplication or redistribution of this Document is prohibited.


Downloaded by us-eyintranet from 123.30.70.126 at 2012-01-15 23:36:03 EST. ISI Emerging Markets. Unauthorized Distribution Prohibited.

Mais conteúdo relacionado

Mais procurados

Biocon Q4_FY12_Media Presentation
Biocon Q4_FY12_Media PresentationBiocon Q4_FY12_Media Presentation
Biocon Q4_FY12_Media PresentationBiocon
 
Pembina Corporate Presentation
Pembina Corporate PresentationPembina Corporate Presentation
Pembina Corporate PresentationCompany Spotlight
 
home depot Bank of America 38th Annual Investment Conference
home depot Bank of America 38th Annual Investment Conferencehome depot Bank of America 38th Annual Investment Conference
home depot Bank of America 38th Annual Investment Conferencefinance2
 
GCPL event update - 120510
GCPL event update - 120510GCPL event update - 120510
GCPL event update - 120510Angel Broking
 
Bharat forge ru4 qfy2010-210510
Bharat forge ru4 qfy2010-210510Bharat forge ru4 qfy2010-210510
Bharat forge ru4 qfy2010-210510Angel Broking
 
Indiabulls Zee Ent 15 May09
Indiabulls Zee Ent 15 May09Indiabulls Zee Ent 15 May09
Indiabulls Zee Ent 15 May09Harsh Arun
 
BASF Polyurethanes Division: Driving efficiency, comfort and sustainability
BASF Polyurethanes Division: Driving efficiency, comfort and sustainabilityBASF Polyurethanes Division: Driving efficiency, comfort and sustainability
BASF Polyurethanes Division: Driving efficiency, comfort and sustainabilityBASF
 
Slide presentation 1 q08
Slide presentation 1 q08Slide presentation 1 q08
Slide presentation 1 q08Cia Hering RI
 
Bajaj electricals ru4-qfy2010-280510
Bajaj electricals ru4-qfy2010-280510Bajaj electricals ru4-qfy2010-280510
Bajaj electricals ru4-qfy2010-280510Angel Broking
 
Polyplex Corporation
Polyplex CorporationPolyplex Corporation
Polyplex CorporationAngel Broking
 
Gsb 621 Return Driven Execution Presentation On Johnson &amp; Johnson And Abb...
Gsb 621 Return Driven Execution Presentation On Johnson &amp; Johnson And Abb...Gsb 621 Return Driven Execution Presentation On Johnson &amp; Johnson And Abb...
Gsb 621 Return Driven Execution Presentation On Johnson &amp; Johnson And Abb...wunder26kj
 
Merrill Lynch Global Power & Gas Leaders Presentation
Merrill Lynch Global Power & Gas Leaders PresentationMerrill Lynch Global Power & Gas Leaders Presentation
Merrill Lynch Global Power & Gas Leaders Presentationfinance14
 
Biocon Q4FY12_Investor Presentation_April_2012
Biocon Q4FY12_Investor Presentation_April_2012Biocon Q4FY12_Investor Presentation_April_2012
Biocon Q4FY12_Investor Presentation_April_2012Biocon
 
Apresentação teleconferência Aquisição Tamoio
Apresentação teleconferência Aquisição TamoioApresentação teleconferência Aquisição Tamoio
Apresentação teleconferência Aquisição TamoioProfarma
 
Institutional presentation march 2010
Institutional presentation march 2010Institutional presentation march 2010
Institutional presentation march 2010Suzano Pulp and Paper
 
Biocon Investor Presentation_March_2012_9M
Biocon Investor Presentation_March_2012_9MBiocon Investor Presentation_March_2012_9M
Biocon Investor Presentation_March_2012_9MBiocon
 
ICICI Direct aurobindo_pharma_initiating coverage March 2011
ICICI Direct aurobindo_pharma_initiating coverage March 2011ICICI Direct aurobindo_pharma_initiating coverage March 2011
ICICI Direct aurobindo_pharma_initiating coverage March 2011MasterSun Goldbird
 
Nestle ru2 qcy2010-02-08-10
Nestle  ru2 qcy2010-02-08-10Nestle  ru2 qcy2010-02-08-10
Nestle ru2 qcy2010-02-08-10Angel Broking
 
Accenture hpb consumer_healthcare_po_v_6 june 2012 v3
Accenture hpb consumer_healthcare_po_v_6 june 2012 v3Accenture hpb consumer_healthcare_po_v_6 june 2012 v3
Accenture hpb consumer_healthcare_po_v_6 june 2012 v3claudy604
 

Mais procurados (20)

Biocon Q4_FY12_Media Presentation
Biocon Q4_FY12_Media PresentationBiocon Q4_FY12_Media Presentation
Biocon Q4_FY12_Media Presentation
 
Pembina Corporate Presentation
Pembina Corporate PresentationPembina Corporate Presentation
Pembina Corporate Presentation
 
home depot Bank of America 38th Annual Investment Conference
home depot Bank of America 38th Annual Investment Conferencehome depot Bank of America 38th Annual Investment Conference
home depot Bank of America 38th Annual Investment Conference
 
GCPL event update - 120510
GCPL event update - 120510GCPL event update - 120510
GCPL event update - 120510
 
Bharat forge ru4 qfy2010-210510
Bharat forge ru4 qfy2010-210510Bharat forge ru4 qfy2010-210510
Bharat forge ru4 qfy2010-210510
 
Indiabulls Zee Ent 15 May09
Indiabulls Zee Ent 15 May09Indiabulls Zee Ent 15 May09
Indiabulls Zee Ent 15 May09
 
BASF Polyurethanes Division: Driving efficiency, comfort and sustainability
BASF Polyurethanes Division: Driving efficiency, comfort and sustainabilityBASF Polyurethanes Division: Driving efficiency, comfort and sustainability
BASF Polyurethanes Division: Driving efficiency, comfort and sustainability
 
Slide presentation 1 q08
Slide presentation 1 q08Slide presentation 1 q08
Slide presentation 1 q08
 
Bajaj electricals ru4-qfy2010-280510
Bajaj electricals ru4-qfy2010-280510Bajaj electricals ru4-qfy2010-280510
Bajaj electricals ru4-qfy2010-280510
 
GCPL
GCPLGCPL
GCPL
 
Polyplex Corporation
Polyplex CorporationPolyplex Corporation
Polyplex Corporation
 
Gsb 621 Return Driven Execution Presentation On Johnson &amp; Johnson And Abb...
Gsb 621 Return Driven Execution Presentation On Johnson &amp; Johnson And Abb...Gsb 621 Return Driven Execution Presentation On Johnson &amp; Johnson And Abb...
Gsb 621 Return Driven Execution Presentation On Johnson &amp; Johnson And Abb...
 
Merrill Lynch Global Power & Gas Leaders Presentation
Merrill Lynch Global Power & Gas Leaders PresentationMerrill Lynch Global Power & Gas Leaders Presentation
Merrill Lynch Global Power & Gas Leaders Presentation
 
Biocon Q4FY12_Investor Presentation_April_2012
Biocon Q4FY12_Investor Presentation_April_2012Biocon Q4FY12_Investor Presentation_April_2012
Biocon Q4FY12_Investor Presentation_April_2012
 
Apresentação teleconferência Aquisição Tamoio
Apresentação teleconferência Aquisição TamoioApresentação teleconferência Aquisição Tamoio
Apresentação teleconferência Aquisição Tamoio
 
Institutional presentation march 2010
Institutional presentation march 2010Institutional presentation march 2010
Institutional presentation march 2010
 
Biocon Investor Presentation_March_2012_9M
Biocon Investor Presentation_March_2012_9MBiocon Investor Presentation_March_2012_9M
Biocon Investor Presentation_March_2012_9M
 
ICICI Direct aurobindo_pharma_initiating coverage March 2011
ICICI Direct aurobindo_pharma_initiating coverage March 2011ICICI Direct aurobindo_pharma_initiating coverage March 2011
ICICI Direct aurobindo_pharma_initiating coverage March 2011
 
Nestle ru2 qcy2010-02-08-10
Nestle  ru2 qcy2010-02-08-10Nestle  ru2 qcy2010-02-08-10
Nestle ru2 qcy2010-02-08-10
 
Accenture hpb consumer_healthcare_po_v_6 june 2012 v3
Accenture hpb consumer_healthcare_po_v_6 june 2012 v3Accenture hpb consumer_healthcare_po_v_6 june 2012 v3
Accenture hpb consumer_healthcare_po_v_6 june 2012 v3
 

Destaque

Cp indicator
Cp indicatorCp indicator
Cp indicatorxvn
 
Understanding the global retail marketplace - The top 20 retail companies yo...
Understanding the global retail marketplace - The top 20 retail companies yo...Understanding the global retail marketplace - The top 20 retail companies yo...
Understanding the global retail marketplace - The top 20 retail companies yo...Interbrand London
 
2.2. pune ti ideea pe harta
2.2. pune ti ideea pe harta2.2. pune ti ideea pe harta
2.2. pune ti ideea pe hartaRuxandra Popa
 
2.Ecclesia Semper Reformanda
2.Ecclesia Semper Reformanda2.Ecclesia Semper Reformanda
2.Ecclesia Semper Reformandaparakletos
 
Water Resources Strategy Nepal 2002 by WECs
Water Resources Strategy Nepal 2002 by WECsWater Resources Strategy Nepal 2002 by WECs
Water Resources Strategy Nepal 2002 by WECsBhim Upadhyaya
 
Pirmā tikšanās ar bibliotēku mans slaids
Pirmā tikšanās ar bibliotēku mans slaidsPirmā tikšanās ar bibliotēku mans slaids
Pirmā tikšanās ar bibliotēku mans slaidskengarags
 
UKGC11 REWORK Public Sector - Part 2
UKGC11 REWORK Public Sector - Part 2UKGC11 REWORK Public Sector - Part 2
UKGC11 REWORK Public Sector - Part 221apps
 
Nepal district-flood- preparedness-guidelines
Nepal district-flood- preparedness-guidelinesNepal district-flood- preparedness-guidelines
Nepal district-flood- preparedness-guidelinesBhim Upadhyaya
 
наташа чернова
наташа чернованаташа чернова
наташа черноваNatasha
 
Unified FlexPod Management and Automation
Unified FlexPod Management and AutomationUnified FlexPod Management and Automation
Unified FlexPod Management and Automationsubtitle
 

Destaque (20)

Cp indicator
Cp indicatorCp indicator
Cp indicator
 
Understanding the global retail marketplace - The top 20 retail companies yo...
Understanding the global retail marketplace - The top 20 retail companies yo...Understanding the global retail marketplace - The top 20 retail companies yo...
Understanding the global retail marketplace - The top 20 retail companies yo...
 
pilot production of chitin
 pilot production of chitin pilot production of chitin
pilot production of chitin
 
Unit4, Lesson4
Unit4, Lesson4Unit4, Lesson4
Unit4, Lesson4
 
puntos tecnologia educativa
puntos tecnologia educativapuntos tecnologia educativa
puntos tecnologia educativa
 
2.2. pune ti ideea pe harta
2.2. pune ti ideea pe harta2.2. pune ti ideea pe harta
2.2. pune ti ideea pe harta
 
Small cells
Small cellsSmall cells
Small cells
 
2.Ecclesia Semper Reformanda
2.Ecclesia Semper Reformanda2.Ecclesia Semper Reformanda
2.Ecclesia Semper Reformanda
 
Twitter Foundations
Twitter FoundationsTwitter Foundations
Twitter Foundations
 
Water Resources Strategy Nepal 2002 by WECs
Water Resources Strategy Nepal 2002 by WECsWater Resources Strategy Nepal 2002 by WECs
Water Resources Strategy Nepal 2002 by WECs
 
Bibliotekas vesture2
Bibliotekas vesture2Bibliotekas vesture2
Bibliotekas vesture2
 
Pirmā tikšanās ar bibliotēku mans slaids
Pirmā tikšanās ar bibliotēku mans slaidsPirmā tikšanās ar bibliotēku mans slaids
Pirmā tikšanās ar bibliotēku mans slaids
 
Yourprezi
YourpreziYourprezi
Yourprezi
 
UKGC11 REWORK Public Sector - Part 2
UKGC11 REWORK Public Sector - Part 2UKGC11 REWORK Public Sector - Part 2
UKGC11 REWORK Public Sector - Part 2
 
Clothing items
Clothing itemsClothing items
Clothing items
 
Nepal district-flood- preparedness-guidelines
Nepal district-flood- preparedness-guidelinesNepal district-flood- preparedness-guidelines
Nepal district-flood- preparedness-guidelines
 
Jeffrey dahmer
Jeffrey dahmerJeffrey dahmer
Jeffrey dahmer
 
наташа чернова
наташа чернованаташа чернова
наташа чернова
 
Slovenija
SlovenijaSlovenija
Slovenija
 
Unified FlexPod Management and Automation
Unified FlexPod Management and AutomationUnified FlexPod Management and Automation
Unified FlexPod Management and Automation
 

Semelhante a Charoen pokphand foods pcl[1]

HUL ru4 qfy2010-250510
HUL ru4 qfy2010-250510HUL ru4 qfy2010-250510
HUL ru4 qfy2010-250510Angel Broking
 
Hul ru4 qfy2010-250510
Hul ru4 qfy2010-250510Hul ru4 qfy2010-250510
Hul ru4 qfy2010-250510Angel Broking
 
1 q11 conference call presentation
1 q11 conference call   presentation1 q11 conference call   presentation
1 q11 conference call presentationBraskem_RI
 
Subros result update 4 qfy2010 040510
Subros result update 4 qfy2010 040510Subros result update 4 qfy2010 040510
Subros result update 4 qfy2010 040510Angel Broking
 
Investment Idea - BPCL : Recommended as "Sell"
Investment Idea  - BPCL : Recommended as "Sell"Investment Idea  - BPCL : Recommended as "Sell"
Investment Idea - BPCL : Recommended as "Sell"Fullerton Securities
 
GKS Consumer Result Update
GKS Consumer Result UpdateGKS Consumer Result Update
GKS Consumer Result UpdateAngel Broking
 
GSK con ru1 qcy2010-230410
GSK con ru1 qcy2010-230410GSK con ru1 qcy2010-230410
GSK con ru1 qcy2010-230410Angel Broking
 
Bayer India- Result Update
Bayer India- Result UpdateBayer India- Result Update
Bayer India- Result UpdateAngel Broking
 
Bhel ru4 qfy2010-280510
Bhel ru4 qfy2010-280510Bhel ru4 qfy2010-280510
Bhel ru4 qfy2010-280510Angel Broking
 
Investment Idea - POLYPLEX CORPORATION LTD - "BUY"
Investment Idea - POLYPLEX CORPORATION LTD - "BUY"Investment Idea - POLYPLEX CORPORATION LTD - "BUY"
Investment Idea - POLYPLEX CORPORATION LTD - "BUY"Fullerton Securities
 
Conference call presentation 4 q10 and 2010 results
Conference call presentation   4 q10 and 2010 resultsConference call presentation   4 q10 and 2010 results
Conference call presentation 4 q10 and 2010 resultsBraskem_RI
 
6th annual latam ceo conference itau bba (inglês)
6th annual latam ceo conference itau bba (inglês)6th annual latam ceo conference itau bba (inglês)
6th annual latam ceo conference itau bba (inglês)Braskem_RI
 

Semelhante a Charoen pokphand foods pcl[1] (20)

Yes Bank
Yes BankYes Bank
Yes Bank
 
Polyplex
PolyplexPolyplex
Polyplex
 
Investment Idea - HDFC Ltd - HOLD
Investment Idea - HDFC Ltd - HOLDInvestment Idea - HDFC Ltd - HOLD
Investment Idea - HDFC Ltd - HOLD
 
HUL ru4 qfy2010-250510
HUL ru4 qfy2010-250510HUL ru4 qfy2010-250510
HUL ru4 qfy2010-250510
 
Hul ru4 qfy2010-250510
Hul ru4 qfy2010-250510Hul ru4 qfy2010-250510
Hul ru4 qfy2010-250510
 
1 q11 conference call presentation
1 q11 conference call   presentation1 q11 conference call   presentation
1 q11 conference call presentation
 
Subros result update 4 qfy2010 040510
Subros result update 4 qfy2010 040510Subros result update 4 qfy2010 040510
Subros result update 4 qfy2010 040510
 
Investment Idea - BPCL : Recommended as "Sell"
Investment Idea  - BPCL : Recommended as "Sell"Investment Idea  - BPCL : Recommended as "Sell"
Investment Idea - BPCL : Recommended as "Sell"
 
GKS Consumer Result Update
GKS Consumer Result UpdateGKS Consumer Result Update
GKS Consumer Result Update
 
GSK con ru1 qcy2010-230410
GSK con ru1 qcy2010-230410GSK con ru1 qcy2010-230410
GSK con ru1 qcy2010-230410
 
Aurobindo Pharma
Aurobindo Pharma Aurobindo Pharma
Aurobindo Pharma
 
UPL
UPLUPL
UPL
 
Bayer India- Result Update
Bayer India- Result UpdateBayer India- Result Update
Bayer India- Result Update
 
Bhel ru4 qfy2010-280510
Bhel ru4 qfy2010-280510Bhel ru4 qfy2010-280510
Bhel ru4 qfy2010-280510
 
JISL
JISLJISL
JISL
 
RIL Result Update
RIL Result UpdateRIL Result Update
RIL Result Update
 
BHEL -Result Update
BHEL -Result UpdateBHEL -Result Update
BHEL -Result Update
 
Investment Idea - POLYPLEX CORPORATION LTD - "BUY"
Investment Idea - POLYPLEX CORPORATION LTD - "BUY"Investment Idea - POLYPLEX CORPORATION LTD - "BUY"
Investment Idea - POLYPLEX CORPORATION LTD - "BUY"
 
Conference call presentation 4 q10 and 2010 results
Conference call presentation   4 q10 and 2010 resultsConference call presentation   4 q10 and 2010 results
Conference call presentation 4 q10 and 2010 results
 
6th annual latam ceo conference itau bba (inglês)
6th annual latam ceo conference itau bba (inglês)6th annual latam ceo conference itau bba (inglês)
6th annual latam ceo conference itau bba (inglês)
 

Último

Fordham -How effective decision-making is within the IT department - Analysis...
Fordham -How effective decision-making is within the IT department - Analysis...Fordham -How effective decision-making is within the IT department - Analysis...
Fordham -How effective decision-making is within the IT department - Analysis...Peter Ward
 
Call Us 📲8800102216📞 Call Girls In DLF City Gurgaon
Call Us 📲8800102216📞 Call Girls In DLF City GurgaonCall Us 📲8800102216📞 Call Girls In DLF City Gurgaon
Call Us 📲8800102216📞 Call Girls In DLF City Gurgaoncallgirls2057
 
PSCC - Capability Statement Presentation
PSCC - Capability Statement PresentationPSCC - Capability Statement Presentation
PSCC - Capability Statement PresentationAnamaria Contreras
 
Call US-88OO1O2216 Call Girls In Mahipalpur Female Escort Service
Call US-88OO1O2216 Call Girls In Mahipalpur Female Escort ServiceCall US-88OO1O2216 Call Girls In Mahipalpur Female Escort Service
Call US-88OO1O2216 Call Girls In Mahipalpur Female Escort Servicecallgirls2057
 
8447779800, Low rate Call girls in Dwarka mor Delhi NCR
8447779800, Low rate Call girls in Dwarka mor Delhi NCR8447779800, Low rate Call girls in Dwarka mor Delhi NCR
8447779800, Low rate Call girls in Dwarka mor Delhi NCRashishs7044
 
TriStar Gold Corporate Presentation - April 2024
TriStar Gold Corporate Presentation - April 2024TriStar Gold Corporate Presentation - April 2024
TriStar Gold Corporate Presentation - April 2024Adnet Communications
 
Pitch Deck Teardown: Geodesic.Life's $500k Pre-seed deck
Pitch Deck Teardown: Geodesic.Life's $500k Pre-seed deckPitch Deck Teardown: Geodesic.Life's $500k Pre-seed deck
Pitch Deck Teardown: Geodesic.Life's $500k Pre-seed deckHajeJanKamps
 
Kenya Coconut Production Presentation by Dr. Lalith Perera
Kenya Coconut Production Presentation by Dr. Lalith PereraKenya Coconut Production Presentation by Dr. Lalith Perera
Kenya Coconut Production Presentation by Dr. Lalith Pereraictsugar
 
Annual General Meeting Presentation Slides
Annual General Meeting Presentation SlidesAnnual General Meeting Presentation Slides
Annual General Meeting Presentation SlidesKeppelCorporation
 
NewBase 19 April 2024 Energy News issue - 1717 by Khaled Al Awadi.pdf
NewBase  19 April  2024  Energy News issue - 1717 by Khaled Al Awadi.pdfNewBase  19 April  2024  Energy News issue - 1717 by Khaled Al Awadi.pdf
NewBase 19 April 2024 Energy News issue - 1717 by Khaled Al Awadi.pdfKhaled Al Awadi
 
International Business Environments and Operations 16th Global Edition test b...
International Business Environments and Operations 16th Global Edition test b...International Business Environments and Operations 16th Global Edition test b...
International Business Environments and Operations 16th Global Edition test b...ssuserf63bd7
 
Ten Organizational Design Models to align structure and operations to busines...
Ten Organizational Design Models to align structure and operations to busines...Ten Organizational Design Models to align structure and operations to busines...
Ten Organizational Design Models to align structure and operations to busines...Seta Wicaksana
 
MAHA Global and IPR: Do Actions Speak Louder Than Words?
MAHA Global and IPR: Do Actions Speak Louder Than Words?MAHA Global and IPR: Do Actions Speak Louder Than Words?
MAHA Global and IPR: Do Actions Speak Louder Than Words?Olivia Kresic
 
8447779800, Low rate Call girls in Tughlakabad Delhi NCR
8447779800, Low rate Call girls in Tughlakabad Delhi NCR8447779800, Low rate Call girls in Tughlakabad Delhi NCR
8447779800, Low rate Call girls in Tughlakabad Delhi NCRashishs7044
 
Memorándum de Entendimiento (MoU) entre Codelco y SQM
Memorándum de Entendimiento (MoU) entre Codelco y SQMMemorándum de Entendimiento (MoU) entre Codelco y SQM
Memorándum de Entendimiento (MoU) entre Codelco y SQMVoces Mineras
 
Darshan Hiranandani [News About Next CEO].pdf
Darshan Hiranandani [News About Next CEO].pdfDarshan Hiranandani [News About Next CEO].pdf
Darshan Hiranandani [News About Next CEO].pdfShashank Mehta
 
Cyber Security Training in Office Environment
Cyber Security Training in Office EnvironmentCyber Security Training in Office Environment
Cyber Security Training in Office Environmentelijahj01012
 
Traction part 2 - EOS Model JAX Bridges.
Traction part 2 - EOS Model JAX Bridges.Traction part 2 - EOS Model JAX Bridges.
Traction part 2 - EOS Model JAX Bridges.Anamaria Contreras
 

Último (20)

Fordham -How effective decision-making is within the IT department - Analysis...
Fordham -How effective decision-making is within the IT department - Analysis...Fordham -How effective decision-making is within the IT department - Analysis...
Fordham -How effective decision-making is within the IT department - Analysis...
 
Call Us 📲8800102216📞 Call Girls In DLF City Gurgaon
Call Us 📲8800102216📞 Call Girls In DLF City GurgaonCall Us 📲8800102216📞 Call Girls In DLF City Gurgaon
Call Us 📲8800102216📞 Call Girls In DLF City Gurgaon
 
PSCC - Capability Statement Presentation
PSCC - Capability Statement PresentationPSCC - Capability Statement Presentation
PSCC - Capability Statement Presentation
 
Call US-88OO1O2216 Call Girls In Mahipalpur Female Escort Service
Call US-88OO1O2216 Call Girls In Mahipalpur Female Escort ServiceCall US-88OO1O2216 Call Girls In Mahipalpur Female Escort Service
Call US-88OO1O2216 Call Girls In Mahipalpur Female Escort Service
 
Enjoy ➥8448380779▻ Call Girls In Sector 18 Noida Escorts Delhi NCR
Enjoy ➥8448380779▻ Call Girls In Sector 18 Noida Escorts Delhi NCREnjoy ➥8448380779▻ Call Girls In Sector 18 Noida Escorts Delhi NCR
Enjoy ➥8448380779▻ Call Girls In Sector 18 Noida Escorts Delhi NCR
 
8447779800, Low rate Call girls in Dwarka mor Delhi NCR
8447779800, Low rate Call girls in Dwarka mor Delhi NCR8447779800, Low rate Call girls in Dwarka mor Delhi NCR
8447779800, Low rate Call girls in Dwarka mor Delhi NCR
 
TriStar Gold Corporate Presentation - April 2024
TriStar Gold Corporate Presentation - April 2024TriStar Gold Corporate Presentation - April 2024
TriStar Gold Corporate Presentation - April 2024
 
Pitch Deck Teardown: Geodesic.Life's $500k Pre-seed deck
Pitch Deck Teardown: Geodesic.Life's $500k Pre-seed deckPitch Deck Teardown: Geodesic.Life's $500k Pre-seed deck
Pitch Deck Teardown: Geodesic.Life's $500k Pre-seed deck
 
Kenya Coconut Production Presentation by Dr. Lalith Perera
Kenya Coconut Production Presentation by Dr. Lalith PereraKenya Coconut Production Presentation by Dr. Lalith Perera
Kenya Coconut Production Presentation by Dr. Lalith Perera
 
Annual General Meeting Presentation Slides
Annual General Meeting Presentation SlidesAnnual General Meeting Presentation Slides
Annual General Meeting Presentation Slides
 
NewBase 19 April 2024 Energy News issue - 1717 by Khaled Al Awadi.pdf
NewBase  19 April  2024  Energy News issue - 1717 by Khaled Al Awadi.pdfNewBase  19 April  2024  Energy News issue - 1717 by Khaled Al Awadi.pdf
NewBase 19 April 2024 Energy News issue - 1717 by Khaled Al Awadi.pdf
 
International Business Environments and Operations 16th Global Edition test b...
International Business Environments and Operations 16th Global Edition test b...International Business Environments and Operations 16th Global Edition test b...
International Business Environments and Operations 16th Global Edition test b...
 
Ten Organizational Design Models to align structure and operations to busines...
Ten Organizational Design Models to align structure and operations to busines...Ten Organizational Design Models to align structure and operations to busines...
Ten Organizational Design Models to align structure and operations to busines...
 
Corporate Profile 47Billion Information Technology
Corporate Profile 47Billion Information TechnologyCorporate Profile 47Billion Information Technology
Corporate Profile 47Billion Information Technology
 
MAHA Global and IPR: Do Actions Speak Louder Than Words?
MAHA Global and IPR: Do Actions Speak Louder Than Words?MAHA Global and IPR: Do Actions Speak Louder Than Words?
MAHA Global and IPR: Do Actions Speak Louder Than Words?
 
8447779800, Low rate Call girls in Tughlakabad Delhi NCR
8447779800, Low rate Call girls in Tughlakabad Delhi NCR8447779800, Low rate Call girls in Tughlakabad Delhi NCR
8447779800, Low rate Call girls in Tughlakabad Delhi NCR
 
Memorándum de Entendimiento (MoU) entre Codelco y SQM
Memorándum de Entendimiento (MoU) entre Codelco y SQMMemorándum de Entendimiento (MoU) entre Codelco y SQM
Memorándum de Entendimiento (MoU) entre Codelco y SQM
 
Darshan Hiranandani [News About Next CEO].pdf
Darshan Hiranandani [News About Next CEO].pdfDarshan Hiranandani [News About Next CEO].pdf
Darshan Hiranandani [News About Next CEO].pdf
 
Cyber Security Training in Office Environment
Cyber Security Training in Office EnvironmentCyber Security Training in Office Environment
Cyber Security Training in Office Environment
 
Traction part 2 - EOS Model JAX Bridges.
Traction part 2 - EOS Model JAX Bridges.Traction part 2 - EOS Model JAX Bridges.
Traction part 2 - EOS Model JAX Bridges.
 

Charoen pokphand foods pcl[1]

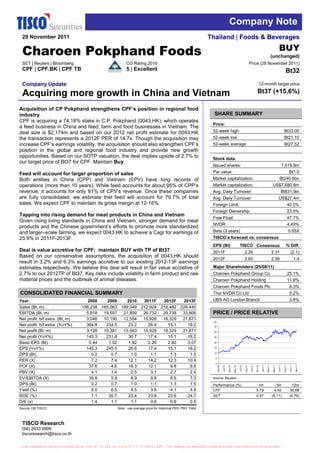
  • 1. Company Note 29 November 2011 Thailand | Foods & Beverages BUY Charoen Pokphand Foods (unchanged) SET | Reuters | Bloomberg CG Rating 2010 Price (28 November 2011) CPF | CPF.BK | CPF TB 5 | Excellent Bt32 Company Update 12-month target price Acquiring more growth in China and Vietnam Bt37 (+15.6%) Acquisition of CP Pokphand strengthens CPF’s position in regional food industry SHARE SUMMARY CPF is acquiring a 74.18% stake in C.P. Pokphand (0043.HK), which operates Price: a feed business in China and feed, farm and food businesses in Vietnam. The deal size is $2,174m and based on our 2012 net profit estimate for 0043.HK 52-week high Bt33.00 the transaction represents a 2012F PER of 14.7x. Though the acquisition may 52-week low Bt21.10 increase CPF’s earnings volatility, the acquisition should also strengthen CPF’s 52-week average Bt27.52 position in the global and regional food industry and provide new growth opportunities. Based on our SOTP valuation, the deal implies upside of 2.7% to Stock data: our target price of Bt37 for CPF. Maintain Buy. Issued shares: 7,519.9m Feed will account for larger proportion of sales Par value: Bt1.0 Both entities in China (CPP) and Vietnam (CPV) have long records of Market capitalization: Bt240.6bn operations (more than 10 years). While feed accounts for about 95% of CPP’s Market capitalization: US$7,680.8m revenue, it accounts for only 61% of CPV’s revenue. Once these companies Avg. Daily Turnover: Bt831.9m are fully consolidated, we estimate that feed will account for 79.7% of total Avg. Daily Turnover: US$27.4m sales. We expect CPF to maintain its gross margin at 12-16%. Foreign Limit: 40.0% Foreign Ownership: 23.0% Tapping into rising demand for meat products in China and Vietnam Free Float: 47.7% Given rising living standards in China and Vietnam, stronger demand for meat NVDR: 4.49% products and the Chinese government’s efforts to promote more standardized and larger–scale farming, we expect 0043.HK to achieve a Cagr for earnings of Beta (3 years) 0.65X ISIEmergingMarketsPDF us-eyintranet from 123.30.70.126 on 2012-01-15 23:36:03 EST. DownloadPDF. TISCO’s forecast vs. consensus 25.9% in 2011F-2013F. EPS (Bt) TISCO Consensus % Diff. Deal is value accretive for CPF; maintain BUY with TP of Bt37 2011F 2.26 2.31 (2.1) Based on our conservative assumptions, the acquisition of 0043.HK should 2012F 2.60 2.56 1.4 result in 3.2% and 6.3% earnings accretive to our existing 2012-13F earnings estimates respectively. We believe this deal will result in fair value accretive of Major Shareholders (25/08/11) 2.7% to our 2012TP of Bt37. Key risks include volatility in farm product and raw Charoen Pokphand Group Co 25.1% material prices and the outbreak of animal diseases. Charoen Pokphand Holding 11.8% Charoen Pokphand Foods Plc 6.3% CONSOLIDATED FINANCIAL SUMMARY Thai NVDR Co Ltd 5.2% Year 2008 2009 2010 2011F 2012F 2013F UBS AG London Branch 3.8% Sales (Bt, m) 156,238 165,063 189,049 212,924 218,482 226,440 EBITDA (Bt, m) 5,818 19,597 21,859 26,732 29,738 33,806 PRICE / PRICE RELATIVE Net profit. b/f extra. (Bt, m) 3,046 10,190 12,554 15,928 18,329 21,671 Bt Net profit. b/f extra. (YoY%) 364.8 234.5 23.2 26.9 15.1 18.2 35 Net profit (Bt, m) 3,128 10,381 13,563 15,928 18,329 21,671 30 Net profit (YoY%) 145.3 231.8 30.7 17.4 15.1 18.2 25 Basic EPS (Bt) 0.44 1.52 1.92 2.26 2.60 3.07 20 EPS (YoY%) 145.3 245.5 26.6 17.4 15.1 18.2 15 10 DPS (Bt) 0.2 0.7 1.0 1.1 1.3 1.5 5 PER (X) 7.2 7.4 12.1 14.2 12.3 10.4 0 PCF (X) 37.6 4.6 16.3 12.1 9.8 8.6 Nov-09 Nov-10 Nov-11 Jan-10 Jun-10 Jan-11 Jun-11 Mar-10 May-10 Aug-10 Oct-10 Mar-11 May-11 Aug-11 Oct-11 PBV (X) 4.1 1.4 2.5 3.1 2.7 2.4 EV/EBITDA (X) 39.9 5.9 8.9 9.8 8.6 7.3 Source: Reuters DPS (Bt) 0.2 0.7 1.0 1.1 1.3 1.5 Performance (%) -1m -3m -12m Yield (%) 6.0 6.5 4.5 3.5 4.1 4.8 CPF 5.79 4.92 30.08 ROE (%) 7.1 20.7 23.4 23.8 23.6 24.7 SET 0.97 (5.11) (0.76) D/E (x) 1.4 1.1 1.1 0.8 0.6 0.5 Source: DB TISCO Note : use average price for historical PER, PBV, Yield TISCO Research (66) 2633 6999 tiscoresearch@tisco.co.th Downloaded by us-eyintranet from 123.30.70.126 at 2012-01-15 23:36:03 EST. ISI Emerging Markets. Unauthorized Distribution Prohibited.
  • 2. Company Note – CPF CPF to acquire 74.18% stake in 43.HK On Friday CPF announced that its board of directors had approved the acquisition of a 74.18% stake in C.P. Pokphand (43.HK), an operator of a feed business in China (CPP) and feed, farm and food businesses in Vietnam (CPV). The deal size is USD2,174m (Bt66,307m). CPF will pay for the acquisition by issuing 694m of its own shares to the CP Group (31.4% of the deal value at Bt30/share with a total value of USD683m or Bt20.8bn). The remainder (USD1,491m or Bt45,475m) will be paid by cash which may come from internal cash flow and debt. After the acquisition, CPF will hold a 74.18% stake in 43.HK (CPF does not have to make a tender offer for the rest of 43.HK shares, according to Hong Kong Stock Exchange rules) and 100% in CPV (CPF already has a 29.18% holding in CPV). Meanwhile the CP Group’s stake in CPF will increase to 49.9% from 42.15% pre- acquisition (see details in Figs. 1-3). Figure 1. Details of the transaction C.P. Pokphand (Hang Seng ticker: 43), an operator of feed businesses in China and Target Vietnam USD2,174m or Bt66,307m: CPF is buying at HKD0.9 per share and will pay by issuing Deal value 694m CPF shares (at Bt30/share or a total of USD683m or Bt20.8bn) and cash of USD1,491m or Bt45.5bn CPF to buy 74.18% of 43.HK shares from CP Group. After the transaction, CPF will hold Deal structure a 74.18% stake in 43.HK while CP Group will hold a 49.9% holding in CPF. Advisor UBS Source: Company data Figure 2. Shareholding structure Pre-acquisition Post-acquisition Public CPG & related parties CPIH Public Public CPG & related parties 70.22% 3.96% 50.10% 49.90% ISIEmergingMarketsPDF us-eyintranet from 123.30.70.126 on 2012-01-15 23:36:03 EST. DownloadPDF. 42.15% 57.85% CPF CPP 25.82% CPF (CPF TB) (43 HK) (CPF TB) 29.18% 70.82% 74.18% CPV- CPP Vietnam (43 HK) 70.82% 29.18% CPV- Vietnam Source: Company data Figure 3. Indicative timeline BoD's approval November 25, 2011 Book closure December 21, 2011 Record date December 22, 2011 EGM January 18, 2012 Source: Company data 2 29 November 2011 Downloaded by us-eyintranet from 123.30.70.126 at 2012-01-15 23:36:03 EST. ISI Emerging Markets. Unauthorized Distribution Prohibited.
  • 3. Company Note – CPF Adding to feed business profile 43.HK comprises two main entities: 1) C.P. Pokphand (CPP) which operates a feed business in China. This was acquired by 43.HK in November 2009 and consolidated into the company in February 2010; and 2) C.P. Vietnam (CPV) which operates feed, farm and food businesses in Vietnam. The entity was acquired in early 2011 and has been fully consolidated since July 2011. Both companies have a long track record (more than 10 years) in their respective markets. While feed accounts for about 95% of CPP’s revenue, it accounts for just 61% of CPV’s revenue (farm and food operations account for 34%). Once they are fully consolidated, we estimate that feed will account for 79.7% of CPF’s total sales. We believe it is likely that CPF’s earnings may experience with more volatility as a result of the increased contribution of feed business into its business profiles (revenue contribution from feed may increase from approximately 40% to now a little bit over 50%.) Figure 4. 43.HK’s revenue structure 1H11 Revenue structure by business 2011F Revenue contribution by entity CPV 38% Others 5% Feed Others 95% 4% CPP 58% Source: Company data Expect strong earnings growth by 43.HK ISIEmergingMarketsPDF us-eyintranet from 123.30.70.126 on 2012-01-15 23:36:03 EST. DownloadPDF.meat Given rising living standards in China and Vietnam, stronger demand for products and the Chinese government’s efforts to promote more standardized and larger–scale farming (partly to avoid the food scares of recent years), we believe that CPP and CPV should achieve moderate to high earnings growth over the next few years (see Fig. 5). The feed business is operated on a cost-plus basis (historical data shows that gross margins range from 12-16%, with lower raw material prices normally resulting in higher margins). There is also room for value-added innovations (with R&D and quality feed, farm yields can be improved). For our earnings estimates, we used the following assumptions: 1) Raw materials: these account for 85% of total production costs of which corn and soybean meal accounts for almost 70%. Therefore, we used corn and soybean meal price movements as the main benchmark in calculating sales prices and gross margin. 2) Sales volume: based on the consumption outlook, historical performance and level of competition, we expect sales volume growth of 10% for CPP and 8-15% for CPV. 3 29 November 2011 Downloaded by us-eyintranet from 123.30.70.126 at 2012-01-15 23:36:03 EST. ISI Emerging Markets. Unauthorized Distribution Prohibited.
  • 4. Company Note – CPF Figure 5. Assumptions and earnings estimates of 0043.HK 43.HK 2009 2010 2011F 2012F 2013F Main assumptions Corn (US$/ ton) 147 169 237 225 217 Change (%) (15.2) 1.2 27.4 (6.7) (1.6) Soybean meal (US$/ ton) 326 301 349 320 322 Change (%) (2.2) (7.8) 16.2 (8.3) 0.6 Sales volume assumptions Livestock feed (‘000 tons) China 3,584 3,058 3,364 3,700 4,070 Growth (%) (14.7) 10.0 10.0 10.0 Vietnam 892 1,022 1,060 1,210 1,404 Growth (%) 14.7 3.7 14.1 16.1 Aquaculture feed (‘000 tons) China 422 365 402 442 486 Growth (%) (13.5) 10.0 10.0 10.0 Vietnam 271 237 275 302 329 Growth (%) (12.6) 15.8 9.8 9.0 43.HK Revenue (US$, m) 74 1,951 2,780 3,897 4,323 EBIT (US$, m) 10 198 282 373 411 Net profit (US$, m) 9 133 180 242 266 Revenue growth (%) 15.1 50.2 15.0 15.0 15.0 Net profit growth (%) 187.1 1,453.0 35.4 34.7 10.0 Gross margin (%) 12.8 15.9 17.5 16.6 16.5 EBIT margin (%) 14.0 10.1 10.1 9.6 9.5 CPP Revenue (US$, m) 1,948 1,839 2,112 2,279 2,487 EBIT (US$, m) 102 186 223 240 258 Net profit (US$, m) 53 125 145 156 168 Revenue growth (%) 0.2 (5.6) 14.8 ISIEmergingMarketsPDF us-eyintranet from 123.30.70.126 on 2012-01-15 23:36:03 EST. DownloadPDF.7.9 9.1 Net profit growth (%) 60.0 135.1 16.0 7.8 7.5 Gross margin (%) 13.4 15.9 17.6 17.6 17.4 EBIT margin (%) 5.2 10.1 10.6 10.5 10.4 CPV Revenue (US$, m) 869 1,046 1,297 1,471 1,667 EBIT (US$, m) 61 63 84 100 115 Net profit (US$, m) 17 11 26 32 37 Revenue growth (%) 4.1 20.4 23.9 13.4 13.3 Net profit growth (%) 12.7 (35.7) 135.4 22.6 15.7 Gross margin (%) 14.6 12.6 13.1 13.4 13.5 EBIT margin (%) 7.0 6.1 6.5 6.8 6.9 Source: Company data, Deutsche Bank Figure 6. China’s feed and meat consumption outlook China's Feed volume Pork and poultry consuption per capita in China Tons, m kg CAGR = 7.8% 160 139 70 Pork Poultry 137 140 123 60 120 111 11.7 50 10.7 100 9.7 10.1 10.3 40 80 30 60 47.8 20 38.2 39.3 40.3 42.6 40 20 10 0 0 2006 2007 2008 2009 2011F 2012F 2013F 2015F 2020F Source: Company data 4 29 November 2011 Downloaded by us-eyintranet from 123.30.70.126 at 2012-01-15 23:36:03 EST. ISI Emerging Markets. Unauthorized Distribution Prohibited.
  • 5. Company Note – CPF Figure 7. Vietnam livestock feed outlook V iet na m 's liv es t oc k f eed pr oduc t ion Tons, m 25 Commercial Feed Home mix 20 4.0 15 6.3 6.5 7.3 10 16.0 5 9.2 10.5 7.5 0 2009 2010 2011F 2015F Source: Company data, Deutsche Bank Slightly positive to CPF’s earnings outlook in 2012-13 due to higher debt burden We expect the acquisition of 0043.HK to result in a sharp rise in interest costs for CPF for the first few years. Although we estimate it will boost CPF’s revenue by 43.8% and 56.3% respectively in 2012-13, the deal will increase its debt burden. We believe CPF may need to issue debentures worth Bt40bn to finance this deal next year. This would result in additional interest expenses of Bt1.8bn and Bt2.8bn in 2012-13F (based on an effective interest rate of 4.5%). We expect CPF’s D/E and D/EBITDA to increase from 0.6x and 1.3x to 1.2x and 2.3x respectively. However, with a projected rise in its EBITDA to Bt38.8bn and Bt48.4bn for these two years, we believe CPF’s cash flow should remain solid. Figure 8. Estimated impact to CPF’s revenue, earnings and debt levels 2011F 2012F 2013F Revenue (Bt, m) ISIEmergingMarketsPDF us-eyintranet from 123.30.70.126 on 2012-01-15 212,924 Pre-acquisition 218,482 23:36:03 EST. DownloadPDF. 226,440 Post-acquisition 212,924 314,218 353,878 % change 0.0 43.8 56.3 EBITDA (Bt, m) Pre-acquisition 26,737 29,714 33,772 Post-acquisition 26,737 38,797 48,397 % change 0.0 30.6 43.3 Interest expense (Bt, m) Pre-acquisition 1,463 1,236 895 Post-acquisition 1,463 3,084 3,684 % change 0.0 149.5 311.8 Net profit (Bt, m) Pre-acquisition 15,928 18,329 21,671 Post-acquisition 15,932 20,762 25,263 % change (0.0) (11.7) (14.2) EPS-fully diluted (Bt) Pre-acquisition 2.3 2.6 3.1 Post-acquisition 2.3 2.7 3.3 % change 0.0 3.2 6.3 Interest bearing debt (Bt, m) Pre-acquisition 44,496 37,459 29,974 Post-acquisition 44,496 89,117 89,206 % change 0.0 137.9 197.6 Interest bearing debt/ EBITDA (x) Pre-acquisition 1.7 1.3 0.9 Post-acquisition 1.7 2.3 1.8 Debt to equity (x) Pre-acquisition 0.8 0.6 0.5 Post-acquisition 0.8 1.2 1.1 Source: Deutsche Bank 5 29 November 2011 Downloaded by us-eyintranet from 123.30.70.126 at 2012-01-15 23:36:03 EST. ISI Emerging Markets. Unauthorized Distribution Prohibited.
  • 6. Company Note – CPF Deal to create another 2.7% accretive value to our current TP We tried to gauge the accretive value of the deal to CPF by using SOTP and applied same multiples that we used with valuation of our current CPF’s 2012TP of Bt37 (we used 12.5x 2012PER for core business, DCF for contribution from CPALL and 10.7x 2012PER for feed business). For the purposes of our valuation we split its business into three parts: 1) domestic and exports sales, with contributions from overseas subsidiaries. We still value this core business as a food company which is striving to increase value-added products (domestic and regional food stocks are trading on an average PER of 12.5x for 2012F), 2) CPALL—as of 9M11, CPF holds a 30% stake in CPALL. We valued CPALL’s contribution to CPF based on our TP of Bt54/share and; 3) 0043.HK—as almost all of 0043.HK’s revenue comes from its feed business, we valued the company based on a conservative 2012F PER of 10.5x (which is in line with the average Thai and regional multiple for such businesses (as shown in Fig. 9). Based on the assumptions listed above, CPF’s fair value post acquisition would increase to Bt38, implying upside of 2.7% to our current TP of Bt37. This would also put the stock on a 2012F PER of 14.6x. Figure 9. CPF’s fair value after acquisition of Bt38 is not expensive even when compared with other feed manufacturers Company Country Mkt Cap PER (x) PBV (x) ROE (%) (US$, m) 2011F 2012F 2011F 2012F 2011F 2012F C.P. Food Thailand 46,936.9 14.4 12.3 3.1 2.7 23.8 23.6 Pre- acquisition C.P. Food Thailand 14.2 11.9 3.1 2.6 23.8 24.8 Post- acquisition Sichuan New Hope China 34,093.1 15.9 16.3 3.4 0.0 24.1 na. C.P. Indonesia Indonesia 26,409.5 15.2 16.9 6.6 6.4 51.8 38.7 Sinofert Holding Hong Kong 12,342.0 17.8 11.5 1.0 0.9 5.5 9.7 Jiangxi Zhengvang China 4,457.1 36.7 31.0 4.3 3.8 11.8 16.3 Tech –A Global Bio-Chem Hong Kong 4,186.7 5.9 4.3 0.6 0.4 10.3 12.8 Technology Xinjiang Tiankang China 3,454.6 31.3 22.1 3.0 3.0 10.1 14.3 Animal-AA ISIEmergingMarketsPDF us-eyintranet from 123.30.70.126 on Dachan Food Asia Hong Kong 2012-01-15 10.7 1,175.3 23:36:03 EST. DownloadPDF. n.a. 0.7 0.0 7.0 n.a. Lee Feed Mill Thailand 458.2 7.7 n.a. 1.1 0.0 14.0 n.a. Weighted average (pre-acquisition) 15.7 15.2 3.9 2.7 27.3 18.7 Source: Company data, Deutsche Bank, Bloomberg Finance LP; based on closing date price of November 28th, 2011. Figure 10. Based on our post-acquisition assumptions, CPF’’s fair value is Bt38.0/share Base (Bt/share) Value (Bt/share) Target multiple (x) Sum-of-the-part valuation Pre-acq Post-acq Pre-acq Post-acq Pre-acq Post-acq Core Business 2.0 1.7 25.4 20.9 12.5 12.5 CPALL DCF: 9.4 (Based on CPALL's DB TP of Bt54 9.9 9.4 n.a. and CPF's holding in CPALL of 30%) 43.HK 0.16 0.68 1.8 7.3 10.7 10.7 Rounding 0.3 0.3 CPF's 2012 TP (Bt/ share) 37.0 38.0 % change 2.7% Source: Deutsche Bank 6 29 November 2011 Downloaded by us-eyintranet from 123.30.70.126 at 2012-01-15 23:36:03 EST. ISI Emerging Markets. Unauthorized Distribution Prohibited.
  • 7. Company Note – CPF Risk factors and concerns Volatility in farm commodity prices Volatility in prices of commodities such as pork, chicken, corn and soybean meal can have a major impact on CPF’s gross margin and profitability. CPF’s share price usually comes under downward pressure when prices of raw materials such as corn and soybean meal rise. On the other hand, its share price tends to increase when pork and chicken prices are strong. Although concerns about higher raw material costs may pressure CPF’s share price in the short term, the company has mitigated the risk by buying forward contracts for its major raw material and has also built up corn stockpiles. Outbreak of disease in pigs and poultry Another key risk for CPF is outbreaks of disease in pigs and poultry which can lead to a dramatic decline in the consumption of meat products. During the bird flu outbreak in 2004 many Thais stopped eating chicken while several countries banned the import of poultry from Thailand. As a result, domestic chicken prices collapsed and CPF posted an earnings loss during one quarter. Commerce Ministry price control Government intervention to control food prices can also put pressure on CPF’s margins. During periods when producers plan to raise the price of basic necessities at the same time, the Commerce Ministry may take several months to approve price increases in order to lessen the impact on consumers. Accordingly, this may harm the company’s ability to pass on the increased costs of products and erode its margins. We believe that one product particularly vulnerable to price controls is feed. ISIEmergingMarketsPDF us-eyintranet from 123.30.70.126 on 2012-01-15 23:36:03 EST. DownloadPDF. 7 29 November 2011 Downloaded by us-eyintranet from 123.30.70.126 at 2012-01-15 23:36:03 EST. ISI Emerging Markets. Unauthorized Distribution Prohibited.
  • 8. Company Note – CPF CONSOLIDATED INCOME STATEMENT (Bt, m) CONSOLIDATED CASHFLOW STATEMENT (Bt, m) Year Ended December 31, Year Ended December 31, 2009 2010 2011F 2012F 2013F 2009 2010 2011F 2012F 2013F Sales 165,063 189,049 212,924 218,482 226,440 Cash Flows from Operations (CFO) Cost of Goods Sold 135,871 156,351 173,148 176,021 180,015 Net Profit 10,381 13,563 15,928 18,329 21,671 Gross Profit 29,192 32,698 39,776 42,462 46,426 Adjusting Items Not Affecting Cash S&A Expense 18,142 20,632 23,422 24,033 24,908 Depreciation and Amortization 4,719 4,798 5,032 5,216 5,379 Interest Expense 1,949 1,824 1,463 1,236 894 Unrealized FX Loss (Gain) (191) 0 0 0 0 Other Income 2,237 2,484 2,030 2,087 2,163 Others (1,391) 0 325 374 442 Net Profit before Tax 12,929 15,238 20,237 23,287 27,533 + (-) in Working Capital 3,702 (9,999) (2,688) (831) (1,189) Income Tax 2,539 2,388 3,984 4,584 5,420 Net CFO 17,220 9,286 18,597 23,087 26,304 Net Profit before M.I. 10,390 12,850 16,253 18,703 22,113 Cash Flows from Investing Activities (CFI) Net (Profit) Loss of M.I. (200) (296) (325) (374) (442) - (+) in Short-term Investment (37) (3,726) 0 0 0 Net Profit before Extra. Items 10,190 12,554 15,928 18,329 21,671 - (+) in Investment in Affiliates 0 0 0 0 0 FX Gain (Loss) (Net of Tax) 191 1,009 0 0 0 - (+) in Fixed Assets (6,434) (6,285) (7,395) (6,508) (7,229) Other Gain (Loss) 0 0 0 0 0 Net CFI (4,951) (7,995) (7,705) (6,334) (7,285) Net Profit 10,381 13,563 15,928 18,329 21,671 Cash Flows from Financing Activities (CFF) + (-) in Debt Financing (3,856) (927) (5,686) (7,041) (7,491) + (-) in Minority Interest 200 0 325 374 442 + (-) in Share Capital and Premium (1,074) 3,500 0 0 0 + (-) in Warrant 0 0 0 0 0 Revenue Growth (%) 5.6 14.5 12.6 2.6 3.6 + (-) in Equity Adjustment 2,397 (87) 3,514 (325) (374) Gross Margin (%) 17.7 17.3 18.7 19.4 20.5 - Cash Dividend Paid (2,329) (6,884) (7,964) (9,164) (10,836) Net Profit Margin (%) 6.3 7.2 7.5 8.4 9.6 Net CFF (4,862) (4,399) (10,137) (16,531) (18,700) Net Profit Growth (%) 231.8 30.7 17.4 15.1 18.2 Net Cash Increase (Decrease) 7,070 (2,762) 756 222 318 CONSOLIDATED QUARTERLY RESULTS (Bt, m) CONSOLIDATED BALANCE SHEET (Bt, m) 3Q10 4Q10 1Q11 2Q11 3Q11 As of December 31, Sales Revenue 50,296 47,282 45,744 53,230 54,446 2009 2010 2011F 2012F 2013F Cost of Sales 41,056 41,095 38,357 43,578 44,708 Current Assets 53,434 58,971 62,551 63,845 65,692 Gross Profit 9,239 6,186 7,387 9,652 9,739 Current Liabilities 29,637 32,827 30,772 26,388 24,322 S&A Expenses 5,064 5,879 4,581 4,444 4,585 Total Assets 115,698 126,320 132,572 134,985 138,737 Interest Expense 400 477 448 499 400 Total Liabilities 60,719 65,217 59,667 52,866 45,715 ISIEmergingMarketsPDF us-eyintranet from 123.30.70.126 on 2012-01-15 23:36:03 EST. DownloadPDF. Other Income 514 1,243 311 308 313 Minority Interest 3,095 3,088 4,285 4,334 4,402 Net Profit before Tax 4,926 1,735 3,426 5,981 5,938 Total Equity 51,885 58,015 68,621 77,785 88,621 Income Tax from Operations 778 (180) 623 1,042 1,043 Paid-up Capital 7,520 7,520 7,520 7,520 7,520 Net Profit before M.I. 4,148 1,915 2,803 4,940 4,894 Net (Profit) Loss of M.I. (88) (99) (40) (40) (3) Net Profit before Extra. Items 4,060 1,816 2,763 4,899 4,891 FX Gain (Loss) (Net of Tax) 223 236 23 (30) 21 Gain (Loss) from Asset Write-down 0 0 0 0 0 Other Gain (Loss) 0 0 693 0 168 Net Profit 4,284 2,052 3,479 4,869 5,083 3Q11 Revenue Growth (YoY %) 14.3 3.6 4.9 11.2 8.3 Market Cap (Bt, m) 240,637 Gross Margin (%) 18.4 13.1 16.1 18.1 17.9 Cash&cash equivalent (Bt, m) 8,704 Net Profit Margin (%) 8.5 4.3 7.6 9.1 9.3 Borrowings (Bt, m) 51,922 Net Profit Growth (YoY %) 4.1 (2.8) 7.9 21.7 18.7 Gearing (X) 0.4 KEY FINANCIAL RATIOS FORECAST ASSUMPTIONS 2009 2010 2011F 2012F 2013F 2009 2010 2011F 2012F 2013F Other Incomes to Total Revenue (%) 1.4 1.3 1.0 1.0 1.0 Total Production ('000 Tons/year) S&A Expenses to Sales (%) 11.0 10.9 11.0 11.0 11.0 - Shrimp Feed 519 638 808 808 808 Current (Times) 1.8 1.8 2.0 2.4 2.7 - Animal Feed 2,058 2,040 2,040 2,210 2,295 Quick (Times) 0.9 0.8 0.9 1.1 1.3 - Pork 377 396 404 412 420 A/R Turnover (Days) 31.5 28.7 28.2 29.6 29.5 - Chicken 370 388 404 412 420 Inventory Turnover (Days) 72.8 70.2 71.3 70.6 70.3 - Shrimp 64 80 100 105 111 A/P Turnover (Days) 22.4 22.0 21.0 21.3 21.2 Domestic Price Debt to Equity (Times) 1.1 1.1 0.8 0.6 0.5 - Pork 57.0 58.7 58.2 57.0 57.0 Net Debt to Equity (Times) 0.5 0.6 0.5 0.5 0.4 - Chicken 37.3 40.0 40.8 37.6 37.6 Gearing (Times) 0.4 0.4 0.3 0.3 0.2 - Shrimp 139.0 144.7 152.1 138.9 138.9 Interest Coverage (Times) 10.1 12.0 18.3 24.1 37.8 Avg. Exchange Rate (Bt : US$1) 34.2 31.8 29.5 29.5 29.5 Return on Avg. Assets (%) 9.3 11.2 12.3 13.7 15.8 Ending Exchange Rate (Bt : US$1) 32.8 31.5 31.5 29.5 29.5 Return on Avg. Equity (%) 21.4 24.7 25.2 25.0 26.0 8 29 November 2011 Downloaded by us-eyintranet from 123.30.70.126 at 2012-01-15 23:36:03 EST. ISI Emerging Markets. Unauthorized Distribution Prohibited.
  • 9. Company Note – CPF Net profit PE Band Bt, m % Bt 25,000 250 60 200 50 20,000 150 40 15,000 100 30 10,000 50 20 0 5,000 10 (50) 0 0 (100) Jan-06 Jan-07 Jan-08 Jan-09 Jan-10 Jan-11 Jan-12 Jan-13 2006 2007 2008 2009 2010 2011F 2012F Profit (Bt, m) Net Profit Growth (%) 2013F 20X 16X 12X 8X 4X Sources : Company data, TISCO Research Sources : Company data, TISCO Research ROAA, ROAE PBV Band % % Bt 18 30 70 15 25 60 50 12 20 40 9 15 30 6 10 20 3 5 10 0 0 0 Jan-06 Jan-07 Jan-08 Jan-09 Jan-10 Jan-11 Jan-12 Jan-13 2006 2007 2008 2009 2010 2011F 2012F 2013F ISIEmergingMarketsPDF us-eyintranet from 123.30.70.126 on 2012-01-15 23:36:03 EST. 3X ROAA (LHS) ROAE (RHS) 5X 4X 2X DownloadPDF. 1X Sources : Company data, TISCO Research Sources : Company data, TISCO Research Profit margin EV/EBITDA Band % % Bt 25 12 70 60 20 10 50 8 15 40 6 30 10 4 20 5 10 2 0 0 0 Jan-06 Jan-07 Jan-08 Jan-09 Jan-10 Jan-11 Jan-12 Jan-13 2006 2007 2008 2009 2010 2011F 2012F 2013F Gross Margin (LHS) Net Profit Margin (RHS) 15X 12X 9X 6X 3X Sources : Company data, TISCO Research Sources : Company data, TISCO Research 9 29 November 2011 Downloaded by us-eyintranet from 123.30.70.126 at 2012-01-15 23:36:03 EST. ISI Emerging Markets. Unauthorized Distribution Prohibited.
  • 10. Company Note – CPF TISCO Securities Company Limited www.tiscosec.com Bangkok 48/8 TISCO Tower 4th Floor, North Sathorn Road, Bangkok 10500, Thailand Tel : (66) 2633 6999 Fax : (66) 2633 6490, (66) 2633 6660 Esplanade Branch 99 Esplanade Shopping Center, Room 202-2, 2nd Floor, Ratchadapisek Road, Din Daeng, Bangkok 10400 Tel : (66) 2641 3251, (66) 2641 3252 Fax : (66) 2641 3253 Chiang Mai 275/4, 2nd Floor, Chang Phuak Road, Chang Phuak, Muang District, Chiang Mai 50300 Tel. 0 5322 4722 Fax. 0 5322 4711 Nakhon Pathom 386, 388 Petchkasem Road, Prapatone, Muang District, Nakhon Pathom 73000 Tel: 0 3421 1812 Fax: 0 3425 1676 Nakhon Ratchasima Tesco Lotus Korat, 719/5 Mittraphap Road, Naimuang, Muang District, Nakhon Ratchasima 30000 Tel: 0 4425 7752 Fax: 0 4425 3752 Udon Thani 227/21 2nd Floor, Udondussadee Road, Muang District, Udon Thani 41000 Tel: 0 4224 6888 Fax: 0 4224 5793 ISIEmergingMarketsPDF us-eyintranet from 123.30.70.126 on 2012-01-15 23:36:03 EST. DownloadPDF. Score Range Level Description 90 - 100 5 Excellent 80 - 89 4 Very Good 70 - 79 3 Good Corporate Governance Report 60 - 69 2 Satisfactory of Thai Listed Companies 2010 50 - 59 1 Pass < 50 or not rated n.a. n.a. Disclaimer The disclosure of the survey result of the Thai Institute of Directors Association (“IOD”) regarding corporate governance is made pursuant to the policy of the Office of lthe Securities and Exchange Commission. The survey of the IOD is based on the information of a company listed on the Stock Exchange of Thailand and the Market for Alternative Investment disclosed to the public and able to be accessed by a general public investor. The result, therefore, is from the perspective of a third party. It is not an evaluation of operation and is not based on inside information. (In order to recognize well performed companies, companies classified into the three highest score groups (Good, Very Good, and Excellent) will be announced to the public). The survey result is as of the date appearing in the Corporate Governance Report of Thai Listed Companies. As a result, the survey result may be changed after that date. TISCO Securities Company Limited does not confirm nor certify the accuracy of such survey result. The information, statements, forecasts and projections contained herein, including any expression of opinion, are based upon sources believed to be reliable but their accuracy completeness or correctness are not guaranteed. Expressions of opinion herein were arrived at after due and careful consideration and they were based upon the best information then known to us, and in our opinion are fair and reasonable in the circumstances prevailing at the time. Expressions of opinion contained herein are subject to change without notice. This document is not, and should not be construed as, an offer or the solicitation of an offer to buy or sell any securities. TISCO and other companies in the TISCO Group and/or their officers, directors and employees may have positions and may affect transactions in securities of companies mentioned herein and may also perform or seek to perform investment banking services for these companies. No person is authorized to give any information or to make any representation not contained in this document and any information or representation not contained in this document must not be relied upon as having been authorized by or on behalf of TISCO. This document is for private circulation only and is not for publication in the press or elsewhere. TISCO accepts no liability whatsoever for any direct or consequential loss arising from any use of this document or its content. The use of any information, statements forecasts and projections contained herein shall be at the sole discretion and risk of the user. Important Notice : This Document may only be issued or passed on to any person in the United Kingdom if that person is of a kind described in Article 11 of the Financial Services 1986 (Investment advertisements) Exemptions Order 1996 or otherwise pursuant to exemptions to Section 57 of the Financial Services Act 1986. In addition, no person who is an 10 Authorised Person may issue or pass on this Document, or otherwise promote the Company, to any person in the United Kingdom other than under the rules of self-regulatory organisations or the Financial Services Authority applicable to such Authorised Persons. This Document is confidential and is intended solely for the use of its recipient. Any 29 November 2011 duplication or redistribution of this Document is prohibited. Downloaded by us-eyintranet from 123.30.70.126 at 2012-01-15 23:36:03 EST. ISI Emerging Markets. Unauthorized Distribution Prohibited.