SAMSTAR: A Semi-automated Lexical Method to generate Star Schemas from an ERD
•
0 gostou•87 visualizações


Recomendados
Mais conteúdo relacionado
Mais procurados
Mais procurados (16)
Destaque
Destaque (20)
Semelhante a SAMSTAR: A Semi-automated Lexical Method to generate Star Schemas from an ERD
Semelhante a SAMSTAR: A Semi-automated Lexical Method to generate Star Schemas from an ERD (20)
Último
Último (20)
SAMSTAR: A Semi-automated Lexical Method to generate Star Schemas from an ERD
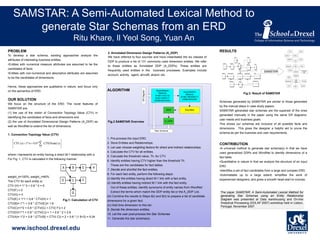
- 1. SAMSTAR:of Poster A Semi-Automated Lexical Method to Titl generate Star Schemas from an ERD Authors Ritu Khare, Il Yeol Song, Yuan An PROBLEM To develop a star schema, existing approaches analyze the attributes of interesting business entities. •Entities with numerical measure attributes are assumed to be the candidates of facts •Entities with non-numerical and descriptive attributes are assumed to be the candidates of dimensions. 2. Annotated Dimension Design Patterns (A_DDP) We have referred to four sources and have instantiated the six classes of DDP to produce a list of 131 commonly used dimension entities. We refer to these entities as Annotated DDP (A_DDPs). These entities are frequently used entities in the business processes. Examples include account, activity, agent, aircraft, airport, etc. RESULTS Invoice We focus on the structure of the ERD. The novel features of SAMSTAR are: (1) the use of the notion of Connection Topology Value (CTV) in identifying the candidates of facts and dimensions and (2) the use of Annotated Dimensional Design Patterns (A_DDP) as well as WordNet to extend the list of dimensions. Customer ALGORITHM Quantitative Method (FIND FACTS AND DIRECT DIMENSIONS) DDP Fig.2 SAMSTAR Overview Quantitative Method (FIND INDIRECT DIMENSIONS WordNet A_DDP 1. Connection Topology Value (CTV) CTV (e) 1* n 0.8 * CTV(Node(i )) i 1 * If you are scanning charts, cartoons, illustrations or plain text non-photo represents scan entity having images), an at 600 dpi, then ‘Save As’ at 225 dpi. where i a direct M:1 relationship with e. For Fig. 1, CTV is calculated in the following manner: A B E H weight_d=100%; weight_i=80% D F C The CTV for each entity is: CTV (H) = 1* 0 + 0.8 * 0 = 0 CTV(F) = 0 G CTV(G) = 0 CTV(E) = 1*1 + 0.8 * CTV(H) = 1 Fig.1: Calculation of CTV CTV(B)= 1*1 + 0.8 * (CTV(E))= 1.8 CTV(C)=1*2 + 0.8 * (CTV(G) + CTV( F)) = 2 CTV(D)=1*1 + 0.8 * (CTV(C)) = 1 + 0.8 * 2 = 2.6 CTV(A)= 1*2 + 0.8 * (CTV(B) + CTV( C)) = 2 + 0.8 * (1.8+2) = 5.04 www.ischool.drexel.edu Order Time Logistics Shipment Order Customer Area Shipment Supplier Product-Supplier Order-Product Promotion Store Store SAMSTAR Order Invoice Customer Store Promotion Store Customer Promotion Type Product Warehouse Time Star Schema n Return Store ER Diagram OUR SOLUTION Store Invoice Return Warehouse Hence, these approaches are qualitative in nature, and focus only on the semantics of ERD. Time 1. Pre-process the input ERD. 2. Store Entities and Relationships. 3. Let user choose weighting factors for direct and indirect relationships. 4. Calculate the CTV for all entities. 5. Calculate the threshold value, Th, for CTV. 6. Identify entities having CTV higher than the threshold Th. These are the candidates for fact tables. 7. Decide and shortlist the fact entities. 8. For each fact entity, perform the following steps: (i) Identify the entities having direct M:1 link with a fact entity. (ii) Identify entities having indirect M:1 link with the fact entity. Out of these entities, identify synonyms of entity names from WordNet. Extract the terms which match the DDP entity list or the A_DDP List. (iii) Combine the results to Steps 8(i) and 8(ii) to prepare a list of candidate dimensions for a given fact. (iv) Add time dimension to this list. 9. Decide the dimension entities. 10. Let the user post-process the Star Schemas 11. Generate the star schema(s). Order Product Order Product Invoice Fig.3: Result of SAMSTAR Schemas generated by SAMSTAR are similar to those generated by the manual steps in case study papers. SAMSTAR generated star schemas are the superset of the ones generated manually in the paper using the same ER diagrams, user needs and business goals. This shows our schemas are inclusive of all possible facts and dimensions. This gives the designer a helpful aid to prune the schema as per the business and user requirements. CONTRIBUTION •A universal method to generate star schema(s) in that we have used generalized DDPs and WordNet to identify dimensions of a fact table. •Quantitative in nature in that we analyze the structure of an input ERD. •Identifies a set of fact candidates from a large and complex ERD. •Automatable up to a large extent; simplifies the work of experienced designers; and gives a smooth head-start to novices. The paper SAMSTAR: A Semi-Automated Lexical Method for generating Star Schemas using an Entity Relationship Diagram was presented at Data warehousing and On-line Analytical Processing (DOLAP 2007) workshop held in Lisbon, Portugal, November 2007.