
Recomendados
Recomendados
Mais conteúdo relacionado
Mais procurados
Mais procurados (20)
Semelhante a 7
Semelhante a 7 (20)
Mais de williamwachira
Mais de williamwachira (19)
Último
Último (20)
7
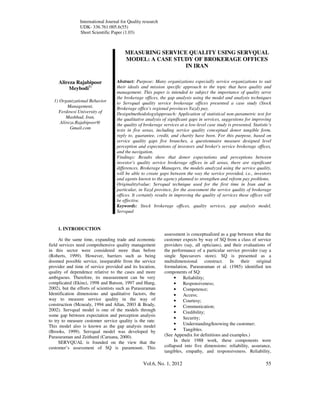
- 1. International Journal for Quality research UDK- 336.761:005.6(55) Short Scientific Paper (1.03) Vol.6, No. 1, 2012 55 Alireza Rajabipoor Meybodi1) 1) Organizational Behavior Management, Ferdowsi University of Mashhad, Iran, Alireza.Rajabipoor@ Gmail.com MEASURING SERVICE QUALITY USING SERVQUAL MODEL: A CASE STUDY OF BROKERAGE OFFICES IN IRAN Abstract: Purpose: Many organizations especially service organizations to suit their ideals and mission specific approach to the topic that have quality and management. This paper is intended to subject the importance of quality serve the brokerage offices, the gap analysis using the model and analysis techniques to Servqual quality service brokerage offices presented a case study (Stock Brokerage office's regional provinces Yazd) pay. Design/methodology/approach: Application of statistical non-parametric test for the qualitative analysis of significant gaps in services, suggestions for improving the quality of brokerage services at a low-level case study is presented. Statistic's tests in five areas, including service quality conceptual donor tangible form, reply to, guarantee, credit, and charity have been. For this purpose, based on service quality gaps five branches, a questionnaire measure designed level perception and expectations of investors and broker's service brokerage offices, and the navigation. Findings: Results show that donor expectations and perceptions between investor's quality service brokerage offices in all areas, there are significant differences. Brokerage Managers, the models analyzed using the service quality, will be able to create gaps between the way the service provided, i.e., investors and agents known to the agency planned to strengthen and reform pay problems. Originality/value: Servqual technique used for the first time in Iran and in particular, in Yazd province, for the assessment the service quality of brokerage offices. It certainly results in improving the quality of services these offices will be effective. Keywords: Stock brokerage offices, quality services, gap analysis model, Servqual 1. INTRODUCTION At the same time, expanding trade and economic field services need comprehensive quality management in this sector were considered more than before (Roberts, 1999). However, barriers such as being doomed possible service, inseparable from the service provider and time of service provided and its location, quality of dependence relative to the cases and more ambiguous. Therefore, its measurement can be very complicated (Ekinci, 1998 and Batson, 1997 and Hang, 2002), but the efforts of scientists such as Parasuraman Identification dimensions and qualitative factors, the way to measure service quality in the way of construction (Mcnealy, 1994 and Allan, 2003 & Brady, 2002). Servqual model is one of the models through some gap between expectation and perception analysis to try to measure customer service quality is the rate. This model also is known as the gap analysis model (Brooks, 1999). Servqual model was developed by Parasuraman and Zeithaml (Caruana, 2000). SERVQUAL is founded on the view that the customer’s assessment of SQ is paramount. This assessment is conceptualized as a gap between what the customer expects by way of SQ from a class of service providers (say, all opticians), and their evaluations of the performance of a particular service provider (say a single Specsavers store). SQ is presented as a multidimensional construct. In their original formulation, Parasuraman et al. (1985) identified ten components of SQ: • Reliability; • Responsiveness; • Competence; • Access; • Courtesy; • Communication; • Credibility; • Security; • Understanding/knowing the customer; • Tangibles. (See Appendix for definitions and examples.) In their 1988 work, these components were collapsed into five dimensions: reliability, assurance, tangibles, empathy, and responsiveness. Reliability,
- 2. 56 A. Rajabipoor Meybodi tangibles and responsiveness remained distinct, but the remaining seven components collapsed into two aggregate dimensions, assurance and empathy (Buttle, 1996). This model of service quality provided and evaluated after five shows. The next five are (Andaleeb, 1998): • Tangibility: NON appearance and physical equipment and tools in the workplace and employees. • Trust: the service provider organization's ability to practice their promise of a precise and continuous. • Responsibility: desire and enthusiasm to help the organization and provide timely customer service. • Assurance: knowledge and skills and competencies of staff and the organization's induction Hassan customer trust. • Empathy: a close and harmonious with the customer and individual attention to his efforts to understand customer needs Servqual model based on 22 components (dimensions around five branches) expectations and perceptions of customer service it gives the measure using gap analysis to the study deals with service quality (Caruana, 2000). The ultimate goal of this model, lead the organization toward excellence is the yield (Bodvarsson, 2002). Figure shows (1) gaps in the five branches of the formation of quality and services. Fifth gap between the perceptions and expectations represent clients of service units. Other functions are split, and thus have been known as a quality gap (Brown, 2000). So far, much research in the field of monitoring and measuring customer satisfaction using the model Servqual in different areas has been. Table (1) Profiles some of the research shows. It is obvious that much research in this field if accepted, but the capacity of this article does not mention them all. Figure (1): gap analysis model (adapted from Parasuraman, and Zeithaml, & Berry, 1985) MARKETER GAP 5 GAP 3 GAP 1 GAP 4 GAP 2 Word of Mouth Communications Personal Needs Past Experience Expected Service Perceived Service Service Delivery (Including Pre- and post- contacts) Translation of Perceptions into Service Quality Specification Management Perceptions of Consumer External Communication To Consumers CONSUMER
- 3. Vol.6, No. 1, 2012 57 Table (1): Research in the same measure satisfaction in different areas Title Researchers, Year Study methods Online transactions impact on customer satisfaction in Tehran Stock Exchange Jafarpour, 2006 Descriptive study through questionnaires and interviews with people Servqual in 2006 Customer satisfaction, quality of services in the online shopping in Iran. Mostaghel, 2006 Quantitative study - descriptive questionnaire Servqual on 1742 people in 2006 in the form 4 groups Measuring the quality of IT services: the evaluation model Servqual Helen kang, graham Bradley, 2002 Servqual questionnaire in one of Australia on the 98 person sample. Assessment Museum as a tourism location using servqual Marek, Nowacki, 2005 Study sample of 102 people using one questionnaire servqual Museum Poland Quality of services in higher education, the role of student expectations Roediger Voss, Thorsten Gruber, Isabelle Szmigin, 2007 Descriptive study in a European University in 2004 and 2005 through a questionnaire on the sample of 53 people and 29 students interviewed Quality of services in the Central Library, Zahedan University of Medical Sciences Reza Hakimi, Z. Syrian military, 2005 Research using the model samples servqual 342 people in the fall of 83 Quality Assessment service: satisfaction of customers of Chicago Library Peter hernon, Ellen Altman 2002 Assessment model using random samples servqual on 523 people in 2002 Measuring service quality in hotel industry study on the hotel business in Turkey Atilla Akbaba 2006 Descriptive study through a questionnaire triplex, the sample 250 people in the fall of 2002 2. METHODOLOGY Measure service quality of stock exchange brokerage offices in Yazd province, based on regional survey method - analytical realization has (1994, Cronin). According to definitions of service quality factors mentioned in previous section, questionnaires measure expectations and perceptions investors, and service providers perceived expectations of investors and the qualitative characteristics and design services available between the investors and brokers offices stockbroker regional survey is Yazd. Accordingly, the assumption's appropriate research gaps first, second and fifth and five branches in each dimension to the qualitative model is defined as: Perception gap: Zero Hypotheses: expectations between investors and broker dealers withdraw from its expectations are no significant differences. The hypothesis: expectations between investors and brokers and brokerage withdraw from its expectations are significantly different.This gap, perceived brokers expected investors in the brokerage offices in the qualitative aspects of tangible, reliability, response, and ensure harmonious and even more partial to the 22 branches of each component with real expectations investors will be compared. This way, the roots can be harvested because of mental difference investors, and service providers pay. Gap in service design: Hypothesis of zero: between harvest broker brokers and investors expectations of the quality characteristics have significant service.The hypothesis: between harvest broker brokers and investors expectations of quality service characteristics are significant differences.Design services as defined qualitative characteristics are achieved and shaping service affected harvest agents (service providers) from the expectations of investors. If the gap between desired and harvest characteristics of that service agents are available in the brokerage game now, the design quality of service will be required and vice versa. Study of the gap in any of five branches and more precise dimensions of the 22 components of quality may be indicated, and the results were interesting. Service quality gap; Hypothesis of zero: between expectations and perceptions of service quality investors, there is no significant difference.
- 4. Vol.6, No. 1, 2012 58 Table (2): reliability test questionnaire Servqual 5 triple the size of quality Percent reliability Investor Questionnaire Questionnaire service providers Investor Questionnaire Questionnaire service providers Tangibility73.368.674.477.3assurance Trust69.870.369.868.66Empathy Responsibility80.472.280.881.4 All the qualitative dimensions The hypothesis: between expectations and perceptions of service quality investors, there are significant differences. The gap function of the other slots and serve to this quality gap can be interpreted. In fact, it confirmed the hypothesis of zero means that the quality of brokerage services in each of the qualitative aspects (and more accurate look at the quality of each component 22) is not responsible for customers. 2.1. Data gathering Definitions based on three qualitative gap studies. Measurement of the quality service brokerage office's regional stock exchange requires Yazd province collected the following information: A) Investor expectations before receiving brokerage services from offices B) Perceptions of investor's brokerage services from offices C) Withdraws or brokerage offices of brokers expect investor's expectations. D) Understanding of brokerage office's agent’s qualitative characteristics of existing Scroll to the data above factors, a questionnaire was designed. This questionnaire includes 26 questions, which are five branches of the quality dimensions Parasuraman is multiplexed. So are the combinations of questions five questions that measured gap's tangible qualitative dimension, three questions the quality of service credit, answer the following question 9, 6 questions to ensure dedicated and finally, three questions measuring the quality of charity in providing the service makes the researcher. 2.2. Sampling After the initial questionnaire design mentioned, attempted random sampling of investors, and brokers were brokerage offices. This level sample (including 28 people from investors and brokerage offices in 9 of the agents who randomly selected are classified), a survey of investors' expectations and perceptions of quality service brokerage offices were, as this way can be valid and Reliability of the questionnaire measured. Determine the sample size using the Morgan table, level with the aim of error of 5 percent and fewer statistical assumptions applied research process was conducted. Questionnaire reliability test using Cronbach’s Alpha about five branches of each dimension of quality were the results in Table (2) is a tabloid. Conceptual validity study questionnaire, based on comments and experts familiar with gap analysis model as a theoretical base and the questionnaire is possible because the questionnaire design Parasuraman observed qualitative perspective; the conceptual validity is confirmed (1994.Kotler). 3. DESCRIBED RESULTS Because the data expectations and perceptions investors interdependent couples form, the study tests this hypothesis non Parametric Wilcoxon matched-pairs signed rank was used. 5% level of statistical error Re- test results indicate is that none of the qualitative aspects such as concrete, accountability, ensuring quality service, reliability and service providing charity. Significance is not large enough, Zero hypothesis cannot be verified (Table 3), which requires more effort for decision makers in the agency's satisfaction is investors. Table (3): test results to the assumptions Quality Gap Test components Tangibility Trust Responsibility assurance Empathy All the qualitative dimensions Z -4.131 -4.230 -4.281 -4.156 -3.315 -4.509 Significant level 0.0 0.0 0.0 0.0 0.001 0.0
- 5. Vol.6, No. 1, 2012 59 3.1. Perception gap Next pathology gap between expectations and perceptions about the dimensions of investors tangible guarantees, credit, and charity, the possibility of taking this problem originated from the incorrect understanding of brokerage offices responsible investors reinforce expectations. To test assumption's gap between service quality expectations of investors and brokerage offices harvest broker agents and managers from its expectations, indicating there may be questions about the perception gap. Perform this important test non-parametric Mann-Whitney was used. This test evaluates a difference between non-correlated pairs about the shows and the most popular alternative t-test with independent samples. The test error level (5 percent), significant levels of expression contained in the above table that the next response Brokerage Stock brokers’ office's Yazd region has to understand the expectations investors have not. So, zero hypotheses about perception of agent's expectations of investors in their response and in other conceptual areas, this hypothesis is confirmed. Table (4): test results to the assumptions perception gap Test components Tangibility Trust Responsibility assurance Empathy All the qualitative dimensions Z -1.9558 -.851 -2.233 -1.455 -1.411 -2.336 Significant level .0511 .395 .026 .146 .158 .019 Broker words, investors in understanding the expectations of the factors mentioned and should be unable to withdraw in this case in order to change the qualitative characteristics can define appropriate. 3.2. Gap design service Doubt that the design characteristics affect harvest quality service providers of brokerage services is the expectation's investors. With a backward approach with the aim of quality pathology service brokerage offices, their gap between expectations and perceptions of investors, or due to incorrect understanding and harvest host or gap between the harvest and the reality of existing agents are Brokerage Services be. Gap between first and second sequences of time to the occurrence of the roots are all weaknesses identified in the qualitative gap analysis can be easier to fifth. Wilcoxon test with the following results for the existence of the gap between the perceptions of agents expectations, investors and brokerage services in the existing reality of each dimension of the five branches of the qualitative results obtained are described in Table 5. Table (5): test results to the assumptions gap design Test components Tangibility Trust Responsibility assurance Empathy All the qualitative dimensions Z -2.501 -1.826 -.770 -.178 -2.032 -1.007 Significant level .012 .068 .441 .859 .042 .314 Be noted that the design gap in aspects of tangible and significant charity and therefore, require that the management of brokerage offices in the reality of existing services more attention to this dimension. The perceived gap in test results that were considered before, since a withdrawal after the agents responds with quality investors, it is not consistent with expectations. The following is recommended as the existing reality services' expectations real investors to be compared. On the one hand, it perceived as agents of management and client expectations, quality of design characteristics of direct involvement, according to the results table (5), design services and tangible dimensions of charity patients is Irregulars. The indices of central values and dispersion (standard deviation) gap design service, and the correlation between the qualitative aspects of the second gap in perspective that the brokerage service providers in the study designed to damage the quality of service in some aspects of acknowledged there are perceptions that control the expectations of investors affected Hosting, construction quality control chart brokerage services mean values of the standard expectations' investors fast, effective help to identify perceptions and out of status shall control. 4. CONCLUSION The results of the study significant gaps, it is necessary to manage stock exchange brokerage offices
- 6. 60 A. Rajabipoor Meybodi in Yazd province in regional area's conceptual accountability, tangible and harmonious planning and to spend more carefully to. In fact, in three dimensions, for two dimensions of concrete and sympathy for the second gap and the gap between the fifth and then to respond to both the first and the gap to five significant gap between expectations and perceptions investors and brokers This Broker was seen. Therefore, is necessary to manage the agency appears to equipment and tools in the workplace and physical agents and to provide timely services to investors must pay more attention, as in this way cause investor to provide more satisfaction said. On the other hand, I can be harmonious with the next training methods of communicating with shareholders, feel better with respect brokerage agents accompany investors will be. Comment developments made in recent years, and the role and importance of capital markets involved in key financial companies, to measure performance through Brokerage Company, and investors in order to enrich the quality of services provided by them necessary to reaches. The mutations made in the measurement of performance of a service-oriented measurement process and within the Output-oriented assessment and customer-oriented, using modern techniques measure the quality of brokerage services in the offices used to promote service quality can help them promote can. Servqual as the most modern techniques to measure the quality of services provided, areas can challenge the existing problems, provide the brokerage offices and expand its quality performance can help. Therefore, is recommended to brokerage offices using the above tools, the quality of their services assessed and fields provide the quality improvement. REFERENCES: [1] Akbaba, A. (2006). “Measuring service quality in the hotel industry: A study in a business hotel in Turkey”. Hospitality Management, 170-192. [2] Allan.Y. (2003). “Customer satisfaction measurement practice in Taiwan hotels”, Hospitality management, no3, pp1-11. [3] Andaleeb.SS, “Do warranties influence perceptions of service quality? “. Journal of retailing and customer services, no2, (1998), pp87-91. [4] Batson, John, (1997), Managing service marketing, London, Dryden press, [5] Bodvarsson, Orn B, Gibson, WA, “Tipping and service quality: a reply to LYNN”, the social science journal, no39, (2002), pp471-476. [6] Brady. MK, Cronin.JJ, “Performance only measurement of service quality: a replication and extension”, Journal of business research, no55, (2002), pp17-31. [7] Brooks, R.F., Lings, I.N. and Botschen, M.A. (1999), “Internal Marketing and customer driven wavefronts”, Service Industries Journal, No.4, PP :49-67 [8] Brown, SW, Churchile, PG, “Research note improving the measurement of service quality”, Journal of retailing and customer services, no4, (2000), pp125-135. [9] Buttle, F. (1996), "Servqual: review, critique, research agenda”, European Journal of marketing, 30, 1. [10] Caruana.A, Ewing MT, “Assessment of the three column format SERVQUAL: an experimental approach”, Journal of business research, No49, (2000), PP57-65. [11] Cronin, JJ, Taylor, SA, “SERVPERF versus SERVQUAL: reconciling performance based perception- minus - expectation measurement of service quality”, Journal of marketing, vol58, no1, (1994), pp125-131. [12] Ekinci, Y, Riley.M, “A critique of issues and theoretical assumptions in service quality measurement in the lodging industry: time to move the goal posts?”. Hospitality management, no17, (1998), pp349-362. [13] Hakimi, R and Syrian military, Z. “Quality of services in the Central Library”, Zahedan University of Medical Sciences, 1384. [14] Hang.K, Bradley.G, (2002), “measuring the performance of IT service: An assessment of SERVQUAL”, International journal of accounting information systems, No3, PP151-164. [15] Hernon, P., & Altman, E. (2002). “Assessing Service Quality: Satisfying the expectations of library customers American Library Association”. [16] jafarpour, d. (2006). “The impact of online trading on customer satisfaction in Tehran stock exchange”. tarbiat modares, tehran. [17] Kang, H., & Bradley, G. (2002). “Measuring the performance of IT services: An assessment of SERVQUAL”. International Journal of Accounting Information, 151-164. [18] Kotler, P (1994), Marketing Management, Prentice - Hall, New Jersey [19] Mcnealy, RM (1994). Making customer satisfaction Happen, 1st edition, New Jersey, Chapman & Hall.
- 7. Vol.6, No. 1, 2012 61 [20] mostaghel, r. (2006). “Customer satisfaction service quality in online purchasing in Iran”. Tarbiat Modares, Tehran. [21] Nowacki, M. M. (2005). “Evaluating a museum as a tourist product using the Servqual method”. Museum Management and Curatorship, 235-250. [22] Parasuraman, A., Zeithaml, V.A., Berry, L.L. (1985), "A conceptual model of service quality and its implications for future research", Journal of Marketing, Vol. 49 No.Fall, pp.41-50. [23] Roberts, P. (1999). “The development of NEDSERV: quantitative instrumentation to measure service quality in nurse education”, Nurse Education today, no19, pp396-407. [24] Voss, R., Gruber, T., & Szmigin, I. (2007). "Service quality in higher education: The role of student expectations". Journal of Business Research, 949-959. Appendix A: Ten components of service quality, (Source: (Buttle, 1996) (1) Reliability involves consistency of performance and dependability. It also means that the firm performs the service right first time and honours its promises. Specifically, it may involve: • Accuracy in billing; • performing the service at the designated time. (2) Responsiveness concerns the willingness or readiness of employees to provide service. It may involve: • mailing a transaction slip immediately; • calling the customer back quickly; • giving prompt service (e.g. setting up appointments quickly). (3) Competence means possession of the required skills and knowledge to perform the service. It involves: • Knowledge and skill of the contact personnel; • Knowledge and skill of operational support personnel; • research capability of the organization. (4) Access involves approachability and ease of contact. It may mean: • The service is easily accessible by telephone; • waiting time to receive service is not extensive; • Convenient hours of operation and convenient location of service facility. (5) Courtesy involves politeness, respect, consideration, and friendliness of contact personnel (Including receptionists, telephone operators, etc.). It includes: • Consideration for the consumer’s property; • Clean and neat appearance of public contact personnel. (6) Communication means keeping customers informed in language they can understand, and listening to them. It may mean that the company has to adjust its language for different customers. It may involve: • explaining the service itself and how much the service will cost; • explaining the trade-offs between service and cost; • assuring the consumer that a problem will be handled. (7) Credibility involves trustworthiness, believability, honesty. It involves having the customer’s best interests at heart. Contributing to credibility are: • Company name and reputation; • Personal characteristics of the contact personnel; • The degree of hard sell involved in interactions with the customer. (8) Security is the freedom from danger, risk, or doubt. It may involve: • Physical safety; • Financial security and confidentiality. (9) Understanding/knowing the customer involves making the effort to understand the customer’s needs. It involves: • learning the customer’s specific requirements; • providing individualized attention. (10) Tangibles include the physical evidence of the service: • Physical facilities and appearance of personnel; • Tools or equipment used to provide the service; • Physical representations of the service, such as a plastic credit card. Received: 20.09.2011 Accepted: 13.01.2012 Open for discussion: 1 Year