More Related Content
Similar to Final_Poster (20)
Final_Poster
- 1. RESEARCH POSTER PRESENTATION DESIGN © 2012
www.PosterPresentations.com
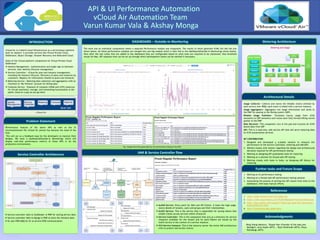
Fig : Sample Html files generated for the performance testing of the APIs
vCloud Air is a hybrid cloud Infrastructure as a service(Iaas) platform
built on vSphere. It provides services like Virtual Private Cloud
OnDemand, Object Storage, Disaster Recovery and Dedicated Cloud.
Some of the vCloud platform components for Virtual Private Cloud
OnDemand
Identity Management : Authentication and single sign on between
services. User identity lifecycle management.
Service Controller : vCloud Air plan and instance management,
including the instance lifecycle. Discovery of plans and instances by
customers. Registry for information related to plans and instances
Metering Service : Metering data collection and aggregation with an
interface to ‘My Vmware’ account for billing data
Compute Service : Exposure of compute (vRAM and vCPU resources
for virtual machines), storage, and networking functionality in the
public cloud on a pay-as-you-go basis
Performance Analysis of the above APIs as well as the UI
functionalities(of the vCloud Air portal) has become the need of the
hour.
This will act as a feedback loop for the developers to improve their
designs. We want a dashboard(Outside-In Monitoring) which will
display real-time performance metrics of these APIs in all the
production environments.
1. http://pubs.vmware.com/vca/index.jsp
2. https://wiki.eng.vmware.com/VCIM/Releases/Praxis/Architecture
3. http://docs.oracle.com/javase/7/docs/api/java/util/concurrent/
ExecutorService.html
4. http://testng.org/doc/index.html
Ming Zhang (Mentor), Rajesh Nair (Founder of the Idea and
Manager), Anuj Gupta (MTS) , Rajiv Deshmukh (MTS), Divya
Ramadugu (MTS)
Usage Collector: Collects and stores the billable events emitted by
each service over RMQ; each event is linked with a service instance.
Usage Aggregators: Aggregates raw usage information and sends to
the PMP for passing to the Rating system (SDP)
Billable Usage Publisher: Translates hourly usage from vCHS
semantics to SDP semantics and routes each fully formed billing record
packet to the PMP
Rate Receiver: This component runs in the pod and receives all vCHS
bound data from SDP
API: This is a read-only, web service API that will serve metering data
to vCHS presentation services
MY CONTRIBUTION:
1. Designed and developed a scalable solution to measure the
performance of the Service Controller, metering and IAM APIs
2. Worked closely with mentor regarding the design and architectural
decisions required for API performance testing
3. Working on designing API automation tests for metering
4. Working on a solution for thread safe API testing
5. Working closely with team in India, on designing API library for
metering.
1. Working on UI performance testing
2. Working on a thread safe API performance testing solution
3. Automating the process of porting the API results from tests to the
dashboard, with least manual efforts.
Service controller talks to ZooKeeper in PMP for storing service data
Service controller talks to Mongo in PMP to store the instance data.
SC user POD AMQ for SC to service POD communication.
AuthN Service :Entry point for Web and API Clients. It hosts the login page,
stores details of tenants, users and groups and their relationships.
AuthZ Service: This is the service that is responsible for issuing tokens that
enable clients access services within vCloud Air
Service Controller: This is the component that acts as a directory for service
instances available for the tenant and its users.Tokens are issued by the
AuthZ service in the context of a service instance.
VCA Service Instance: This is the resource server the entire IAM architecture
tries to protect and access control.
The work was on individual components where a separate Performance module was integrated. The results of which generate HTML file like the one
shown below. All these performance modules are merged into one big module which is then fed to the dashboard(Outside-In Monitoring) shown below.
Here after the test suites that are added to the dashboard they are configurable based on what tests are required to be monitored. Also threshold
values for Max. API response time can be set up through which development teams can be notified if necessary.