SlideShare uma empresa Scribd logo
1 de 2
Baixar para ler offline
www.unglobalpulse.org • info@unglobalpulse.org • 2015 1
DATA VISUALISATION AND INTERACTIVE
MAPPING TO SUPPORT RESPONSE TO
DISEASE OUTBREAK
PARTNERS: WORLD HEALTH ORGANIZATION, UGANDAN MINISTRY OF HEALTH
PROGRAMME AREA: PUBLIC HEALTH
BACKGROUND
Pulse Lab Kampala has established an on-going collaboration with the
Ministry of Health in Uganda, in coordination with WHO, to strengthen
disease response.
After a typhoid outbreak occurred in Uganda from January-May
2015, Pulse Lab Kampala was invited to join the National Task
Force in response to the outbreak.
The Ugandan Ministry of Health’s district health information system
contained structured weekly statistics from 5,991 health centres
across the country. It therefore had substantial detail about the typhoid
outbreak.
However, with the available static mapping tools it was difficult to
obtain a full picture of the outbreak to inform response. Pulse Lab
Kampala utilized advanced analytics technologies to help present
dynamic information about the disease outbreak visually in an effort to
aid decision-making.
INTERACTIVE MAPPING OF HEALTH DATA
AND EPIDEMIC RISK FACTORS
Data collected at the health centres where typhoid cases were
treated contained the home and work locations of individuals
reported to have had the disease. These locations were recorded
as free text, and as a result, location names were sometimes
spelled differently. For example “Namugona”, “Namugoona”,
“Namungoona”, “Namungona” were all used to refer to the same
location. In order to solve this challenge, automatic methods to
convert the names of locations to longitude/latitude data were
developed using geo-referencing tools (GeoNames, OpenStreetMap
and Google Maps).
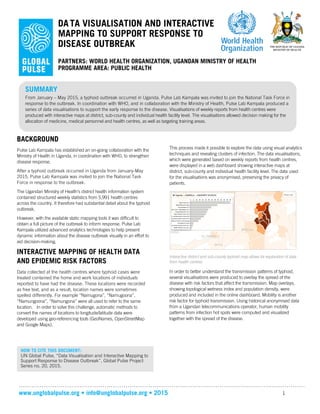
This process made it possible to explore the data using visual analytics
techniques and revealing clusters of infection. The data visualisations,
which were generated based on weekly reports from health centres,
were displayed in a web dashboard showing interactive maps at
district, sub-county and individual health facility level. The data used
for the visualisations was anonymised, preserving the privacy of
patients.
Interactive district and sub-county typhoid map allows for exploration of data
from health centres.
In order to better understand the transmission patterns of typhoid,
several visualisations were produced to overlay the spread of the
disease with risk factors that affect the transmission. Map overlays,
showing topological wetness index and population density, were
produced and included in the online dashboard. Mobility is another
risk factor for typhoid transmission. Using historical anonymised data
from a Ugandan telecommunications operator, human mobility
patterns from infection hot spots were computed and visualized
together with the spread of the disease.
HOW TO CITE THIS DOCUMENT:
UN Global Pulse, “Data Visualisation and Interactive Mapping to
Support Response to Disease Outbreak”, Global Pulse Project
Series no. 20, 2015.
SUMMARY
From January – May 2015, a typhoid outbreak occurred in Uganda. Pulse Lab Kampala was invited to join the National Task Force in
response to the outbreak. In coordination with WHO, and in collaboration with the Ministry of Health, Pulse Lab Kampala produced a
series of data visualisations to support the early response to the disease. Visualisations of weekly reports from health centres were
produced with interactive maps at district, sub-county and individual health facility level. The visualisations allowed decision making for the
allocation of medicine, medical personnel and health centres, as well as targeting training areas.
www.unglobalpulse.org • info@unglobalpulse.org • 2015 2
Interactive map of case locations, overlaid on topological wetness index.
Visualisation of sub-county level typhoid incidence and human mobility from
highly infected areas.
INSIGHTS & OUTCOMES
The visualisations proved helpful for decision-making regarding
planning for mobilization of health teams, and the allocation of medical
supplies and determining target areas for provision of training to health
centres. By making multi-level infection data available in an accessible
and interactive format, its practical utility for surveillance is improved
even without adding supplementary sources of data.
Geo-referencing tools were used to rapidly map case lists with
inconsistent, free-text place names. By automating the geo-referencing
process, new maps could be produced as soon as new line list
datasets were available.
Interactive mapping tools provide the ability to show infection rate data
along with information about risk factors, including population mobility,
wetness/drainage and population density. Being able to see, for
example, the urban areas that have poor natural drainage and high
population density, yet relatively low infection counts, provides
information that outbreak containment measures are operating
adequately in those regions.
Population mobility was only weakly correlated with the pattern of
disease spread in this case (statistically significant, but not a strong
enough predictor to be of practical impact in the outbreak response).
This may be due to the limited spatial spread of the infection; despite
high numbers of cases in central Kampala, and many cases in
surrounding sub-counties, the outbreak was curtailed before there was
wide-scale infection in districts further afield.
CONCLUSIONS
During outbreaks of infectious diseases, case data is captured at
health centres. Given the complex nature of this data, however,
standard mapping and tabular methods of display provide a limited
view into the progression of an epidemic and the influence of different
risk factors.
Data visualisation techniques and interactive maps make complex
epidemic data more accessible to decision makers and field teams. By
providing the ability to explore health facility data at multiple levels of
detail, authorities were able to plan resource allocation effectively,
including for medical supplies, medical personnel and training.
IMPLICATIONS & RECOMMENDATIONS
• It is recommended to use data visualisation tools with the
types of data routinely collected during an outbreak of
infectious disease to support the response to the outbreak.
• Resource allocation and prioritisation can be optimized
during the time-critical response phase by gaining visual
insights into the progression of an epidemic, and the
interaction with various risk factors.
• The on-going partnership between Pulse Lab Kampala and
Ministry of Health provides an excellent framework of
collaboration to respond to diseases. Hands-on capacity
building on data innovation and data science is provided to
staff at Ministry of Health on an on-going basis.

Mais conteúdo relacionado

Mais procurados

A visual analytics approach to understanding poverty assessment through disas...
A visual analytics approach to understanding poverty assessment through disas...A visual analytics approach to understanding poverty assessment through disas...
A visual analytics approach to understanding poverty assessment through disas...UN Global Pulse
 
Supporting the Post-2015 Development Agenda Consultations Using U-Report - Pr...
Supporting the Post-2015 Development Agenda Consultations Using U-Report - Pr...Supporting the Post-2015 Development Agenda Consultations Using U-Report - Pr...
Supporting the Post-2015 Development Agenda Consultations Using U-Report - Pr...UN Global Pulse
 
Nowcasting Food Prices in Indonesia with Social Media - Project Overview
Nowcasting Food Prices in Indonesia with Social Media - Project Overview  Nowcasting Food Prices in Indonesia with Social Media - Project Overview
Nowcasting Food Prices in Indonesia with Social Media - Project Overview UN Global Pulse
 
Monitoring household coping strategies during complex crises final
Monitoring household coping strategies during complex crises finalMonitoring household coping strategies during complex crises final
Monitoring household coping strategies during complex crises finalUN Global Pulse
 
Big Data for Development: Opportunities and Challenges, Summary Slidedeck
Big Data for Development: Opportunities and Challenges, Summary SlidedeckBig Data for Development: Opportunities and Challenges, Summary Slidedeck
Big Data for Development: Opportunities and Challenges, Summary SlidedeckUN Global Pulse
 
GlobalPulse_BPP_MethodsPaper2011
GlobalPulse_BPP_MethodsPaper2011GlobalPulse_BPP_MethodsPaper2011
GlobalPulse_BPP_MethodsPaper2011UN Global Pulse
 
The impact of the global financial crisis on reproductive and maternal health...
The impact of the global financial crisis on reproductive and maternal health...The impact of the global financial crisis on reproductive and maternal health...
The impact of the global financial crisis on reproductive and maternal health...UN Global Pulse
 
Using Financial Transaction Data To Measure Economic Resilience To Natural Di...
Using Financial Transaction Data To Measure Economic Resilience To Natural Di...Using Financial Transaction Data To Measure Economic Resilience To Natural Di...
Using Financial Transaction Data To Measure Economic Resilience To Natural Di...UN Global Pulse
 
Digital Signals & Access to Finance in Kenya
Digital Signals & Access to Finance in KenyaDigital Signals & Access to Finance in Kenya
Digital Signals & Access to Finance in KenyaUN Global Pulse
 
Understanding Immunisation Awareness and Sentiment with Social Media - Projec...
Understanding Immunisation Awareness and Sentiment with Social Media - Projec...Understanding Immunisation Awareness and Sentiment with Social Media - Projec...
Understanding Immunisation Awareness and Sentiment with Social Media - Projec...UN Global Pulse
 
Analysing Social Media Conversations to Understand Public Perceptions of Sani...
Analysing Social Media Conversations to Understand Public Perceptions of Sani...Analysing Social Media Conversations to Understand Public Perceptions of Sani...
Analysing Social Media Conversations to Understand Public Perceptions of Sani...UN Global Pulse
 
Using Twitter to Measure Global Engagement on Climate Change - Project Overview
Using Twitter to Measure Global Engagement on Climate Change - Project OverviewUsing Twitter to Measure Global Engagement on Climate Change - Project Overview
Using Twitter to Measure Global Engagement on Climate Change - Project OverviewUN Global Pulse
 
Understanding Public Perceptions of Immunisation Using Social Media - Project...
Understanding Public Perceptions of Immunisation Using Social Media - Project...Understanding Public Perceptions of Immunisation Using Social Media - Project...
Understanding Public Perceptions of Immunisation Using Social Media - Project...UN Global Pulse
 
"Big Data for Development: Opportunities and Challenges"
"Big Data for Development: Opportunities and Challenges" "Big Data for Development: Opportunities and Challenges"
"Big Data for Development: Opportunities and Challenges" UN Global Pulse
 
Global Pulse: Mining Indonesian Tweets to Understand Food Price Crises copy
Global Pulse: Mining Indonesian Tweets to Understand Food Price Crises copyGlobal Pulse: Mining Indonesian Tweets to Understand Food Price Crises copy
Global Pulse: Mining Indonesian Tweets to Understand Food Price Crises copyUN Global Pulse
 
Mining Citizen Feedback Data for Enhanced Local Government Decision-Making - ...
Mining Citizen Feedback Data for Enhanced Local Government Decision-Making - ...Mining Citizen Feedback Data for Enhanced Local Government Decision-Making - ...
Mining Citizen Feedback Data for Enhanced Local Government Decision-Making - ...UN Global Pulse
 
Using Twitter Data to Analyse Public Sentiment on Fuel Subsidy Policy Reform ...
Using Twitter Data to Analyse Public Sentiment on Fuel Subsidy Policy Reform ...Using Twitter Data to Analyse Public Sentiment on Fuel Subsidy Policy Reform ...
Using Twitter Data to Analyse Public Sentiment on Fuel Subsidy Policy Reform ...UN Global Pulse
 
2015 Annual Report Pulse Lab Kampala
2015 Annual Report Pulse Lab Kampala2015 Annual Report Pulse Lab Kampala
2015 Annual Report Pulse Lab KampalaUN Global Pulse
 
Vulnerable Groups and Communities in The Context of Adaptation and Developmen...
Vulnerable Groups and Communities in The Context of Adaptation and Developmen...Vulnerable Groups and Communities in The Context of Adaptation and Developmen...
Vulnerable Groups and Communities in The Context of Adaptation and Developmen...Tariq A. Deen
 

Mais procurados (20)

Big Data and the SDGs
Big Data and the SDGsBig Data and the SDGs
Big Data and the SDGs
 
A visual analytics approach to understanding poverty assessment through disas...
A visual analytics approach to understanding poverty assessment through disas...A visual analytics approach to understanding poverty assessment through disas...
A visual analytics approach to understanding poverty assessment through disas...
 
Supporting the Post-2015 Development Agenda Consultations Using U-Report - Pr...
Supporting the Post-2015 Development Agenda Consultations Using U-Report - Pr...Supporting the Post-2015 Development Agenda Consultations Using U-Report - Pr...
Supporting the Post-2015 Development Agenda Consultations Using U-Report - Pr...
 
Nowcasting Food Prices in Indonesia with Social Media - Project Overview
Nowcasting Food Prices in Indonesia with Social Media - Project Overview  Nowcasting Food Prices in Indonesia with Social Media - Project Overview
Nowcasting Food Prices in Indonesia with Social Media - Project Overview
 
Monitoring household coping strategies during complex crises final
Monitoring household coping strategies during complex crises finalMonitoring household coping strategies during complex crises final
Monitoring household coping strategies during complex crises final
 
Big Data for Development: Opportunities and Challenges, Summary Slidedeck
Big Data for Development: Opportunities and Challenges, Summary SlidedeckBig Data for Development: Opportunities and Challenges, Summary Slidedeck
Big Data for Development: Opportunities and Challenges, Summary Slidedeck
 
GlobalPulse_BPP_MethodsPaper2011
GlobalPulse_BPP_MethodsPaper2011GlobalPulse_BPP_MethodsPaper2011
GlobalPulse_BPP_MethodsPaper2011
 
The impact of the global financial crisis on reproductive and maternal health...
The impact of the global financial crisis on reproductive and maternal health...The impact of the global financial crisis on reproductive and maternal health...
The impact of the global financial crisis on reproductive and maternal health...
 
Using Financial Transaction Data To Measure Economic Resilience To Natural Di...
Using Financial Transaction Data To Measure Economic Resilience To Natural Di...Using Financial Transaction Data To Measure Economic Resilience To Natural Di...
Using Financial Transaction Data To Measure Economic Resilience To Natural Di...
 
Digital Signals & Access to Finance in Kenya
Digital Signals & Access to Finance in KenyaDigital Signals & Access to Finance in Kenya
Digital Signals & Access to Finance in Kenya
 
Understanding Immunisation Awareness and Sentiment with Social Media - Projec...
Understanding Immunisation Awareness and Sentiment with Social Media - Projec...Understanding Immunisation Awareness and Sentiment with Social Media - Projec...
Understanding Immunisation Awareness and Sentiment with Social Media - Projec...
 
Analysing Social Media Conversations to Understand Public Perceptions of Sani...
Analysing Social Media Conversations to Understand Public Perceptions of Sani...Analysing Social Media Conversations to Understand Public Perceptions of Sani...
Analysing Social Media Conversations to Understand Public Perceptions of Sani...
 
Using Twitter to Measure Global Engagement on Climate Change - Project Overview
Using Twitter to Measure Global Engagement on Climate Change - Project OverviewUsing Twitter to Measure Global Engagement on Climate Change - Project Overview
Using Twitter to Measure Global Engagement on Climate Change - Project Overview
 
Understanding Public Perceptions of Immunisation Using Social Media - Project...
Understanding Public Perceptions of Immunisation Using Social Media - Project...Understanding Public Perceptions of Immunisation Using Social Media - Project...
Understanding Public Perceptions of Immunisation Using Social Media - Project...
 
"Big Data for Development: Opportunities and Challenges"
"Big Data for Development: Opportunities and Challenges" "Big Data for Development: Opportunities and Challenges"
"Big Data for Development: Opportunities and Challenges"
 
Global Pulse: Mining Indonesian Tweets to Understand Food Price Crises copy
Global Pulse: Mining Indonesian Tweets to Understand Food Price Crises copyGlobal Pulse: Mining Indonesian Tweets to Understand Food Price Crises copy
Global Pulse: Mining Indonesian Tweets to Understand Food Price Crises copy
 
Mining Citizen Feedback Data for Enhanced Local Government Decision-Making - ...
Mining Citizen Feedback Data for Enhanced Local Government Decision-Making - ...Mining Citizen Feedback Data for Enhanced Local Government Decision-Making - ...
Mining Citizen Feedback Data for Enhanced Local Government Decision-Making - ...
 
Using Twitter Data to Analyse Public Sentiment on Fuel Subsidy Policy Reform ...
Using Twitter Data to Analyse Public Sentiment on Fuel Subsidy Policy Reform ...Using Twitter Data to Analyse Public Sentiment on Fuel Subsidy Policy Reform ...
Using Twitter Data to Analyse Public Sentiment on Fuel Subsidy Policy Reform ...
 
2015 Annual Report Pulse Lab Kampala
2015 Annual Report Pulse Lab Kampala2015 Annual Report Pulse Lab Kampala
2015 Annual Report Pulse Lab Kampala
 
Vulnerable Groups and Communities in The Context of Adaptation and Developmen...
Vulnerable Groups and Communities in The Context of Adaptation and Developmen...Vulnerable Groups and Communities in The Context of Adaptation and Developmen...
Vulnerable Groups and Communities in The Context of Adaptation and Developmen...
 

Destaque

Integrating big data into the monitoring and evaluation of development progra...
Integrating big data into the monitoring and evaluation of development progra...Integrating big data into the monitoring and evaluation of development progra...
Integrating big data into the monitoring and evaluation of development progra...UN Global Pulse
 
A Guide to Data Innovation for Development - From idea to proof-of-concept
A Guide to Data Innovation for Development - From idea to proof-of-conceptA Guide to Data Innovation for Development - From idea to proof-of-concept
A Guide to Data Innovation for Development - From idea to proof-of-conceptUN Global Pulse
 
Mobile Data for Development Primer
Mobile Data for Development PrimerMobile Data for Development Primer
Mobile Data for Development PrimerUN Global Pulse
 
Big Data For Development A Primer
Big Data For Development A PrimerBig Data For Development A Primer
Big Data For Development A PrimerUN Global Pulse
 
PSFK Future Of Real-Time Information
PSFK Future Of Real-Time InformationPSFK Future Of Real-Time Information
PSFK Future Of Real-Time InformationPSFK
 
Study on the human dimensions of the financial crisis in ethiopia final
Study on the human dimensions of the financial crisis in ethiopia finalStudy on the human dimensions of the financial crisis in ethiopia final
Study on the human dimensions of the financial crisis in ethiopia finalUN Global Pulse
 
The global financial crisis in colombia and the international conference on p...
The global financial crisis in colombia and the international conference on p...The global financial crisis in colombia and the international conference on p...
The global financial crisis in colombia and the international conference on p...UN Global Pulse
 
Analyzing Attitudes Towards Biofuels with Social Media - Project Overview
Analyzing Attitudes Towards Biofuels with Social Media - Project OverviewAnalyzing Attitudes Towards Biofuels with Social Media - Project Overview
Analyzing Attitudes Towards Biofuels with Social Media - Project OverviewUN Global Pulse
 
National programme officer
National programme officerNational programme officer
National programme officerharem rasul
 
Communications - CV Amjad Jamal-1
Communications - CV Amjad Jamal-1Communications - CV Amjad Jamal-1
Communications - CV Amjad Jamal-1Amjad Jamal
 
Samuel_CV_Generic_updated 2016
Samuel_CV_Generic_updated 2016 Samuel_CV_Generic_updated 2016
Samuel_CV_Generic_updated 2016 samuel tadesse
 
Bridging the Gap in Humanitarian Operations Through Effective Partnerships
Bridging the Gap in Humanitarian Operations Through Effective PartnershipsBridging the Gap in Humanitarian Operations Through Effective Partnerships
Bridging the Gap in Humanitarian Operations Through Effective PartnershipsIAWG Africa
 

Destaque (14)

Integrating big data into the monitoring and evaluation of development progra...
Integrating big data into the monitoring and evaluation of development progra...Integrating big data into the monitoring and evaluation of development progra...
Integrating big data into the monitoring and evaluation of development progra...
 
A Guide to Data Innovation for Development - From idea to proof-of-concept
A Guide to Data Innovation for Development - From idea to proof-of-conceptA Guide to Data Innovation for Development - From idea to proof-of-concept
A Guide to Data Innovation for Development - From idea to proof-of-concept
 
Mobile Data for Development Primer
Mobile Data for Development PrimerMobile Data for Development Primer
Mobile Data for Development Primer
 
Big Data For Development A Primer
Big Data For Development A PrimerBig Data For Development A Primer
Big Data For Development A Primer
 
PSFK Future Of Real-Time Information
PSFK Future Of Real-Time InformationPSFK Future Of Real-Time Information
PSFK Future Of Real-Time Information
 
Global Burden of Diseases, Injuries, and Risk Factors Study 2010: Comorbidity
Global Burden of Diseases, Injuries, and Risk Factors Study 2010: ComorbidityGlobal Burden of Diseases, Injuries, and Risk Factors Study 2010: Comorbidity
Global Burden of Diseases, Injuries, and Risk Factors Study 2010: Comorbidity
 
Study on the human dimensions of the financial crisis in ethiopia final
Study on the human dimensions of the financial crisis in ethiopia finalStudy on the human dimensions of the financial crisis in ethiopia final
Study on the human dimensions of the financial crisis in ethiopia final
 
The global financial crisis in colombia and the international conference on p...
The global financial crisis in colombia and the international conference on p...The global financial crisis in colombia and the international conference on p...
The global financial crisis in colombia and the international conference on p...
 
Analyzing Attitudes Towards Biofuels with Social Media - Project Overview
Analyzing Attitudes Towards Biofuels with Social Media - Project OverviewAnalyzing Attitudes Towards Biofuels with Social Media - Project Overview
Analyzing Attitudes Towards Biofuels with Social Media - Project Overview
 
National programme officer
National programme officerNational programme officer
National programme officer
 
Communications - CV Amjad Jamal-1
Communications - CV Amjad Jamal-1Communications - CV Amjad Jamal-1
Communications - CV Amjad Jamal-1
 
Samuel_CV_Generic_updated 2016
Samuel_CV_Generic_updated 2016 Samuel_CV_Generic_updated 2016
Samuel_CV_Generic_updated 2016
 
CV_BALDVINSSON_EN_2016
CV_BALDVINSSON_EN_2016CV_BALDVINSSON_EN_2016
CV_BALDVINSSON_EN_2016
 
Bridging the Gap in Humanitarian Operations Through Effective Partnerships
Bridging the Gap in Humanitarian Operations Through Effective PartnershipsBridging the Gap in Humanitarian Operations Through Effective Partnerships
Bridging the Gap in Humanitarian Operations Through Effective Partnerships
 

Semelhante a Data Visualisation and Interactive Mapping to Support Response to Disease Outbreak - Project Overview

Annual gsdm camp2014 Health Group
Annual gsdm camp2014 Health GroupAnnual gsdm camp2014 Health Group
Annual gsdm camp2014 Health GroupAnjar Dimara Sakti
 
Moving towards malaria elimination: developing innovative tools for malaria s...
Moving towards malaria elimination: developing innovative tools for malaria s...Moving towards malaria elimination: developing innovative tools for malaria s...
Moving towards malaria elimination: developing innovative tools for malaria s...Malaria Consortium
 
An overview of Dengue Information Management System by Punjab Informatioon Te...
An overview of Dengue Information Management System by Punjab Informatioon Te...An overview of Dengue Information Management System by Punjab Informatioon Te...
An overview of Dengue Information Management System by Punjab Informatioon Te...Ayaz Khan
 
09 Mary Elizabeth Miranda (Phils)
09 Mary Elizabeth Miranda (Phils)09 Mary Elizabeth Miranda (Phils)
09 Mary Elizabeth Miranda (Phils)Perez Eric
 
Application of computers in Epidemiology.pptx
Application of computers in Epidemiology.pptxApplication of computers in Epidemiology.pptx
Application of computers in Epidemiology.pptxiqbal606601
 
Population Mapping Approach, Health Interoperability, and Informatics to Mana...
Population Mapping Approach, Health Interoperability, and Informatics to Mana...Population Mapping Approach, Health Interoperability, and Informatics to Mana...
Population Mapping Approach, Health Interoperability, and Informatics to Mana...Abdul Joseph Fofanah
 
Building Capacity for Geospatial Analysis and Data Demand and Use to Improve ...
Building Capacity for Geospatial Analysis and Data Demand and Use to Improve ...Building Capacity for Geospatial Analysis and Data Demand and Use to Improve ...
Building Capacity for Geospatial Analysis and Data Demand and Use to Improve ...MEASURE Evaluation
 
Information Technology in Pandemic
Information Technology in PandemicInformation Technology in Pandemic
Information Technology in PandemicSwati Karn
 
national aids control program phase IV
national aids control program phase IVnational aids control program phase IV
national aids control program phase IVArkadeb Kar
 
An IT Approach to Improve the Compilation of Clinical Access Indicators and D...
An IT Approach to Improve the Compilation of Clinical Access Indicators and D...An IT Approach to Improve the Compilation of Clinical Access Indicators and D...
An IT Approach to Improve the Compilation of Clinical Access Indicators and D...Editor IJCATR
 
ONLINE FUZZY-LOGIC KNOWLEDGE WAREHOUSING AND MINING MODEL FOR THE DIAGNOSIS A...
ONLINE FUZZY-LOGIC KNOWLEDGE WAREHOUSING AND MINING MODEL FOR THE DIAGNOSIS A...ONLINE FUZZY-LOGIC KNOWLEDGE WAREHOUSING AND MINING MODEL FOR THE DIAGNOSIS A...
ONLINE FUZZY-LOGIC KNOWLEDGE WAREHOUSING AND MINING MODEL FOR THE DIAGNOSIS A...ijcsity
 
The Role of Connected Diagnostics in Strengthening Regional, National and Con...
The Role of Connected Diagnostics in Strengthening Regional, National and Con...The Role of Connected Diagnostics in Strengthening Regional, National and Con...
The Role of Connected Diagnostics in Strengthening Regional, National and Con...SystemOne
 
Remote monitoring of XpertW MTB/RIF testing in Mozambique: results of program...
Remote monitoring of XpertW MTB/RIF testing in Mozambique: results of program...Remote monitoring of XpertW MTB/RIF testing in Mozambique: results of program...
Remote monitoring of XpertW MTB/RIF testing in Mozambique: results of program...SystemOne
 
Integrating GIS and Remote Sensing Technology In Contact Tracing Of Ebola Vir...
Integrating GIS and Remote Sensing Technology In Contact Tracing Of Ebola Vir...Integrating GIS and Remote Sensing Technology In Contact Tracing Of Ebola Vir...
Integrating GIS and Remote Sensing Technology In Contact Tracing Of Ebola Vir...ANUMBA JOSEPH UCHE
 
Real-time Surveillance and Response for Malaria Elimination
Real-time Surveillance and Response for Malaria EliminationReal-time Surveillance and Response for Malaria Elimination
Real-time Surveillance and Response for Malaria EliminationRTI International
 
Strengthening Public Health and Primary CareCollaboration Th.docx
Strengthening Public Health and Primary CareCollaboration Th.docxStrengthening Public Health and Primary CareCollaboration Th.docx
Strengthening Public Health and Primary CareCollaboration Th.docxflorriezhamphrey3065
 
Using PMTCT data to identify HIV epidemic hotspots at sub-national levels; le...
Using PMTCT data to identify HIV epidemic hotspots at sub-national levels; le...Using PMTCT data to identify HIV epidemic hotspots at sub-national levels; le...
Using PMTCT data to identify HIV epidemic hotspots at sub-national levels; le...MEASURE Evaluation
 

Semelhante a Data Visualisation and Interactive Mapping to Support Response to Disease Outbreak - Project Overview (20)

Annual gsdm camp2014 Health Group
Annual gsdm camp2014 Health GroupAnnual gsdm camp2014 Health Group
Annual gsdm camp2014 Health Group
 
Surveillance & IDSP
Surveillance & IDSPSurveillance & IDSP
Surveillance & IDSP
 
Moving towards malaria elimination: developing innovative tools for malaria s...
Moving towards malaria elimination: developing innovative tools for malaria s...Moving towards malaria elimination: developing innovative tools for malaria s...
Moving towards malaria elimination: developing innovative tools for malaria s...
 
An overview of Dengue Information Management System by Punjab Informatioon Te...
An overview of Dengue Information Management System by Punjab Informatioon Te...An overview of Dengue Information Management System by Punjab Informatioon Te...
An overview of Dengue Information Management System by Punjab Informatioon Te...
 
09 Mary Elizabeth Miranda (Phils)
09 Mary Elizabeth Miranda (Phils)09 Mary Elizabeth Miranda (Phils)
09 Mary Elizabeth Miranda (Phils)
 
Application of computers in Epidemiology.pptx
Application of computers in Epidemiology.pptxApplication of computers in Epidemiology.pptx
Application of computers in Epidemiology.pptx
 
Population Mapping Approach, Health Interoperability, and Informatics to Mana...
Population Mapping Approach, Health Interoperability, and Informatics to Mana...Population Mapping Approach, Health Interoperability, and Informatics to Mana...
Population Mapping Approach, Health Interoperability, and Informatics to Mana...
 
Building Capacity for Geospatial Analysis and Data Demand and Use to Improve ...
Building Capacity for Geospatial Analysis and Data Demand and Use to Improve ...Building Capacity for Geospatial Analysis and Data Demand and Use to Improve ...
Building Capacity for Geospatial Analysis and Data Demand and Use to Improve ...
 
Information Technology in Pandemic
Information Technology in PandemicInformation Technology in Pandemic
Information Technology in Pandemic
 
national aids control program phase IV
national aids control program phase IVnational aids control program phase IV
national aids control program phase IV
 
An IT Approach to Improve the Compilation of Clinical Access Indicators and D...
An IT Approach to Improve the Compilation of Clinical Access Indicators and D...An IT Approach to Improve the Compilation of Clinical Access Indicators and D...
An IT Approach to Improve the Compilation of Clinical Access Indicators and D...
 
ONLINE FUZZY-LOGIC KNOWLEDGE WAREHOUSING AND MINING MODEL FOR THE DIAGNOSIS A...
ONLINE FUZZY-LOGIC KNOWLEDGE WAREHOUSING AND MINING MODEL FOR THE DIAGNOSIS A...ONLINE FUZZY-LOGIC KNOWLEDGE WAREHOUSING AND MINING MODEL FOR THE DIAGNOSIS A...
ONLINE FUZZY-LOGIC KNOWLEDGE WAREHOUSING AND MINING MODEL FOR THE DIAGNOSIS A...
 
The Role of Connected Diagnostics in Strengthening Regional, National and Con...
The Role of Connected Diagnostics in Strengthening Regional, National and Con...The Role of Connected Diagnostics in Strengthening Regional, National and Con...
The Role of Connected Diagnostics in Strengthening Regional, National and Con...
 
Remote monitoring of XpertW MTB/RIF testing in Mozambique: results of program...
Remote monitoring of XpertW MTB/RIF testing in Mozambique: results of program...Remote monitoring of XpertW MTB/RIF testing in Mozambique: results of program...
Remote monitoring of XpertW MTB/RIF testing in Mozambique: results of program...
 
Integrating GIS and Remote Sensing Technology In Contact Tracing Of Ebola Vir...
Integrating GIS and Remote Sensing Technology In Contact Tracing Of Ebola Vir...Integrating GIS and Remote Sensing Technology In Contact Tracing Of Ebola Vir...
Integrating GIS and Remote Sensing Technology In Contact Tracing Of Ebola Vir...
 
Real-time Surveillance and Response for Malaria Elimination
Real-time Surveillance and Response for Malaria EliminationReal-time Surveillance and Response for Malaria Elimination
Real-time Surveillance and Response for Malaria Elimination
 
Enabling Semantic Interoperability of Regional Trends of Disease Surveillance...
Enabling Semantic Interoperability of Regional Trends of Disease Surveillance...Enabling Semantic Interoperability of Regional Trends of Disease Surveillance...
Enabling Semantic Interoperability of Regional Trends of Disease Surveillance...
 
E governance in health sector
E  governance in health sectorE  governance in health sector
E governance in health sector
 
Strengthening Public Health and Primary CareCollaboration Th.docx
Strengthening Public Health and Primary CareCollaboration Th.docxStrengthening Public Health and Primary CareCollaboration Th.docx
Strengthening Public Health and Primary CareCollaboration Th.docx
 
Using PMTCT data to identify HIV epidemic hotspots at sub-national levels; le...
Using PMTCT data to identify HIV epidemic hotspots at sub-national levels; le...Using PMTCT data to identify HIV epidemic hotspots at sub-national levels; le...
Using PMTCT data to identify HIV epidemic hotspots at sub-national levels; le...
 

Mais de UN Global Pulse

Step 2: Due Diligence Questionnaire for Prospective Partners
Step 2: Due Diligence Questionnaire for Prospective PartnersStep 2: Due Diligence Questionnaire for Prospective Partners
Step 2: Due Diligence Questionnaire for Prospective PartnersUN Global Pulse
 
Step 1: Due Diligence Checklist for Prospective Partners
Step 1: Due Diligence Checklist for Prospective Partners Step 1: Due Diligence Checklist for Prospective Partners
Step 1: Due Diligence Checklist for Prospective Partners UN Global Pulse
 
Using Data and New Technology for Peacemaking, Preventive Diplomacy, and Peac...
Using Data and New Technology for Peacemaking, Preventive Diplomacy, and Peac...Using Data and New Technology for Peacemaking, Preventive Diplomacy, and Peac...
Using Data and New Technology for Peacemaking, Preventive Diplomacy, and Peac...UN Global Pulse
 
Pulse Lab Kampala Progress Report 2016/2017
Pulse Lab Kampala Progress Report 2016/2017Pulse Lab Kampala Progress Report 2016/2017
Pulse Lab Kampala Progress Report 2016/2017UN Global Pulse
 
UN Global Pulse Annual Report 2018
UN Global Pulse Annual Report 2018UN Global Pulse Annual Report 2018
UN Global Pulse Annual Report 2018UN Global Pulse
 
Pulse Lab Jakarta Annual Report 2018
Pulse Lab Jakarta Annual Report 2018 Pulse Lab Jakarta Annual Report 2018
Pulse Lab Jakarta Annual Report 2018 UN Global Pulse
 
Risks, Harms and Benefits Assessment Tool (Updated as of Jan 2019)
Risks, Harms and Benefits Assessment Tool (Updated as of Jan 2019)Risks, Harms and Benefits Assessment Tool (Updated as of Jan 2019)
Risks, Harms and Benefits Assessment Tool (Updated as of Jan 2019)UN Global Pulse
 
Pulse Lab Jakarta 2015 Annual Report
Pulse Lab Jakarta 2015 Annual Report Pulse Lab Jakarta 2015 Annual Report
Pulse Lab Jakarta 2015 Annual Report UN Global Pulse
 
Embracing Innovation: How a Social Lab can Support the Innovation Agenda in S...
Embracing Innovation: How a Social Lab can Support the Innovation Agenda in S...Embracing Innovation: How a Social Lab can Support the Innovation Agenda in S...
Embracing Innovation: How a Social Lab can Support the Innovation Agenda in S...UN Global Pulse
 
Urban Vulnerability Mapping Toolkit
Urban Vulnerability Mapping ToolkitUrban Vulnerability Mapping Toolkit
Urban Vulnerability Mapping ToolkitUN Global Pulse
 
Navigating the Terrain: A Toolkit for Conceptualising Service Design Projects
Navigating the Terrain: A Toolkit for Conceptualising Service Design ProjectsNavigating the Terrain: A Toolkit for Conceptualising Service Design Projects
Navigating the Terrain: A Toolkit for Conceptualising Service Design ProjectsUN Global Pulse
 
Experimenting with Big Data and AI to Support Peace and Security
Experimenting with Big Data and AI to Support Peace and SecurityExperimenting with Big Data and AI to Support Peace and Security
Experimenting with Big Data and AI to Support Peace and SecurityUN Global Pulse
 
Banking on Fintech: Financial inclusion for micro enterprises in Indonesia
Banking on Fintech: Financial inclusion for micro enterprises in IndonesiaBanking on Fintech: Financial inclusion for micro enterprises in Indonesia
Banking on Fintech: Financial inclusion for micro enterprises in IndonesiaUN Global Pulse
 
Haze Gazer - Tool Overview
Haze Gazer - Tool Overview Haze Gazer - Tool Overview
Haze Gazer - Tool Overview UN Global Pulse
 
Building Proxy Indicators of National Wellbeing with Postal Data - Project Ov...
Building Proxy Indicators of National Wellbeing with Postal Data - Project Ov...Building Proxy Indicators of National Wellbeing with Postal Data - Project Ov...
Building Proxy Indicators of National Wellbeing with Postal Data - Project Ov...UN Global Pulse
 
Sex Disaggregation of Social Media Posts - Tool Overview
Sex Disaggregation of Social Media Posts - Tool OverviewSex Disaggregation of Social Media Posts - Tool Overview
Sex Disaggregation of Social Media Posts - Tool OverviewUN Global Pulse
 
Using Big data Analytics for Improved Public Transport
Using Big data Analytics for Improved Public Transport Using Big data Analytics for Improved Public Transport
Using Big data Analytics for Improved Public Transport UN Global Pulse
 
Translator Gator - Tool Overview
Translator Gator - Tool Overview Translator Gator - Tool Overview
Translator Gator - Tool Overview UN Global Pulse
 
Big Data for Financial Inclusion, Examining the Customer Journey - Project Ov...
Big Data for Financial Inclusion, Examining the Customer Journey - Project Ov...Big Data for Financial Inclusion, Examining the Customer Journey - Project Ov...
Big Data for Financial Inclusion, Examining the Customer Journey - Project Ov...UN Global Pulse
 
Understanding Perceptions of Migrants and Refugees with Social Media - Projec...
Understanding Perceptions of Migrants and Refugees with Social Media - Projec...Understanding Perceptions of Migrants and Refugees with Social Media - Projec...
Understanding Perceptions of Migrants and Refugees with Social Media - Projec...UN Global Pulse
 

Mais de UN Global Pulse (20)

Step 2: Due Diligence Questionnaire for Prospective Partners
Step 2: Due Diligence Questionnaire for Prospective PartnersStep 2: Due Diligence Questionnaire for Prospective Partners
Step 2: Due Diligence Questionnaire for Prospective Partners
 
Step 1: Due Diligence Checklist for Prospective Partners
Step 1: Due Diligence Checklist for Prospective Partners Step 1: Due Diligence Checklist for Prospective Partners
Step 1: Due Diligence Checklist for Prospective Partners
 
Using Data and New Technology for Peacemaking, Preventive Diplomacy, and Peac...
Using Data and New Technology for Peacemaking, Preventive Diplomacy, and Peac...Using Data and New Technology for Peacemaking, Preventive Diplomacy, and Peac...
Using Data and New Technology for Peacemaking, Preventive Diplomacy, and Peac...
 
Pulse Lab Kampala Progress Report 2016/2017
Pulse Lab Kampala Progress Report 2016/2017Pulse Lab Kampala Progress Report 2016/2017
Pulse Lab Kampala Progress Report 2016/2017
 
UN Global Pulse Annual Report 2018
UN Global Pulse Annual Report 2018UN Global Pulse Annual Report 2018
UN Global Pulse Annual Report 2018
 
Pulse Lab Jakarta Annual Report 2018
Pulse Lab Jakarta Annual Report 2018 Pulse Lab Jakarta Annual Report 2018
Pulse Lab Jakarta Annual Report 2018
 
Risks, Harms and Benefits Assessment Tool (Updated as of Jan 2019)
Risks, Harms and Benefits Assessment Tool (Updated as of Jan 2019)Risks, Harms and Benefits Assessment Tool (Updated as of Jan 2019)
Risks, Harms and Benefits Assessment Tool (Updated as of Jan 2019)
 
Pulse Lab Jakarta 2015 Annual Report
Pulse Lab Jakarta 2015 Annual Report Pulse Lab Jakarta 2015 Annual Report
Pulse Lab Jakarta 2015 Annual Report
 
Embracing Innovation: How a Social Lab can Support the Innovation Agenda in S...
Embracing Innovation: How a Social Lab can Support the Innovation Agenda in S...Embracing Innovation: How a Social Lab can Support the Innovation Agenda in S...
Embracing Innovation: How a Social Lab can Support the Innovation Agenda in S...
 
Urban Vulnerability Mapping Toolkit
Urban Vulnerability Mapping ToolkitUrban Vulnerability Mapping Toolkit
Urban Vulnerability Mapping Toolkit
 
Navigating the Terrain: A Toolkit for Conceptualising Service Design Projects
Navigating the Terrain: A Toolkit for Conceptualising Service Design ProjectsNavigating the Terrain: A Toolkit for Conceptualising Service Design Projects
Navigating the Terrain: A Toolkit for Conceptualising Service Design Projects
 
Experimenting with Big Data and AI to Support Peace and Security
Experimenting with Big Data and AI to Support Peace and SecurityExperimenting with Big Data and AI to Support Peace and Security
Experimenting with Big Data and AI to Support Peace and Security
 
Banking on Fintech: Financial inclusion for micro enterprises in Indonesia
Banking on Fintech: Financial inclusion for micro enterprises in IndonesiaBanking on Fintech: Financial inclusion for micro enterprises in Indonesia
Banking on Fintech: Financial inclusion for micro enterprises in Indonesia
 
Haze Gazer - Tool Overview
Haze Gazer - Tool Overview Haze Gazer - Tool Overview
Haze Gazer - Tool Overview
 
Building Proxy Indicators of National Wellbeing with Postal Data - Project Ov...
Building Proxy Indicators of National Wellbeing with Postal Data - Project Ov...Building Proxy Indicators of National Wellbeing with Postal Data - Project Ov...
Building Proxy Indicators of National Wellbeing with Postal Data - Project Ov...
 
Sex Disaggregation of Social Media Posts - Tool Overview
Sex Disaggregation of Social Media Posts - Tool OverviewSex Disaggregation of Social Media Posts - Tool Overview
Sex Disaggregation of Social Media Posts - Tool Overview
 
Using Big data Analytics for Improved Public Transport
Using Big data Analytics for Improved Public Transport Using Big data Analytics for Improved Public Transport
Using Big data Analytics for Improved Public Transport
 
Translator Gator - Tool Overview
Translator Gator - Tool Overview Translator Gator - Tool Overview
Translator Gator - Tool Overview
 
Big Data for Financial Inclusion, Examining the Customer Journey - Project Ov...
Big Data for Financial Inclusion, Examining the Customer Journey - Project Ov...Big Data for Financial Inclusion, Examining the Customer Journey - Project Ov...
Big Data for Financial Inclusion, Examining the Customer Journey - Project Ov...
 
Understanding Perceptions of Migrants and Refugees with Social Media - Projec...
Understanding Perceptions of Migrants and Refugees with Social Media - Projec...Understanding Perceptions of Migrants and Refugees with Social Media - Projec...
Understanding Perceptions of Migrants and Refugees with Social Media - Projec...
 

Último

Unveiling the Role of Social Media Suspect Investigators in Preventing Online...
Unveiling the Role of Social Media Suspect Investigators in Preventing Online...Unveiling the Role of Social Media Suspect Investigators in Preventing Online...
Unveiling the Role of Social Media Suspect Investigators in Preventing Online...Milind Agarwal
 
FAIR, FAIRsharing, FAIR Cookbook and ELIXIR - Sansone SA - Boston 2024
FAIR, FAIRsharing, FAIR Cookbook and ELIXIR - Sansone SA - Boston 2024FAIR, FAIRsharing, FAIR Cookbook and ELIXIR - Sansone SA - Boston 2024
FAIR, FAIRsharing, FAIR Cookbook and ELIXIR - Sansone SA - Boston 2024Susanna-Assunta Sansone
 
English-8-Q4-W3-Synthesizing-Essential-Information-From-Various-Sources-1.pdf
English-8-Q4-W3-Synthesizing-Essential-Information-From-Various-Sources-1.pdfEnglish-8-Q4-W3-Synthesizing-Essential-Information-From-Various-Sources-1.pdf
English-8-Q4-W3-Synthesizing-Essential-Information-From-Various-Sources-1.pdfblazblazml
 
Data Factory in Microsoft Fabric (MsBIP #82)
Data Factory in Microsoft Fabric (MsBIP #82)Data Factory in Microsoft Fabric (MsBIP #82)
Data Factory in Microsoft Fabric (MsBIP #82)Cathrine Wilhelmsen
 
The Power of Data-Driven Storytelling_ Unveiling the Layers of Insight.pptx
The Power of Data-Driven Storytelling_ Unveiling the Layers of Insight.pptxThe Power of Data-Driven Storytelling_ Unveiling the Layers of Insight.pptx
The Power of Data-Driven Storytelling_ Unveiling the Layers of Insight.pptxTasha Penwell
 
SMOTE and K-Fold Cross Validation-Presentation.pptx
SMOTE and K-Fold Cross Validation-Presentation.pptxSMOTE and K-Fold Cross Validation-Presentation.pptx
SMOTE and K-Fold Cross Validation-Presentation.pptxHaritikaChhatwal1
 
Networking Case Study prepared by teacher.pptx
Networking Case Study prepared by teacher.pptxNetworking Case Study prepared by teacher.pptx
Networking Case Study prepared by teacher.pptxHimangsuNath
 
Data Analysis Project Presentation: Unveiling Your Ideal Customer, Bank Custo...
Data Analysis Project Presentation: Unveiling Your Ideal Customer, Bank Custo...Data Analysis Project Presentation: Unveiling Your Ideal Customer, Bank Custo...
Data Analysis Project Presentation: Unveiling Your Ideal Customer, Bank Custo...Boston Institute of Analytics
 
wepik-insightful-infographics-a-data-visualization-overview-20240401133220kwr...
wepik-insightful-infographics-a-data-visualization-overview-20240401133220kwr...wepik-insightful-infographics-a-data-visualization-overview-20240401133220kwr...
wepik-insightful-infographics-a-data-visualization-overview-20240401133220kwr...KarteekMane1
 
Defining Constituents, Data Vizzes and Telling a Data Story
Defining Constituents, Data Vizzes and Telling a Data StoryDefining Constituents, Data Vizzes and Telling a Data Story
Defining Constituents, Data Vizzes and Telling a Data StoryJeremy Anderson
 
Cyber awareness ppt on the recorded data
Cyber awareness ppt on the recorded dataCyber awareness ppt on the recorded data
Cyber awareness ppt on the recorded dataTecnoIncentive
 
Decoding the Heart: Student Presentation on Heart Attack Prediction with Data...
Decoding the Heart: Student Presentation on Heart Attack Prediction with Data...Decoding the Heart: Student Presentation on Heart Attack Prediction with Data...
Decoding the Heart: Student Presentation on Heart Attack Prediction with Data...Boston Institute of Analytics
 
Principles and Practices of Data Visualization
Principles and Practices of Data VisualizationPrinciples and Practices of Data Visualization
Principles and Practices of Data VisualizationKianJazayeri1
 
Conf42-LLM_Adding Generative AI to Real-Time Streaming Pipelines
Conf42-LLM_Adding Generative AI to Real-Time Streaming PipelinesConf42-LLM_Adding Generative AI to Real-Time Streaming Pipelines
Conf42-LLM_Adding Generative AI to Real-Time Streaming PipelinesTimothy Spann
 
INTRODUCTION TO Natural language processing
INTRODUCTION TO Natural language processingINTRODUCTION TO Natural language processing
INTRODUCTION TO Natural language processingsocarem879
 
Student profile product demonstration on grades, ability, well-being and mind...
Student profile product demonstration on grades, ability, well-being and mind...Student profile product demonstration on grades, ability, well-being and mind...
Student profile product demonstration on grades, ability, well-being and mind...Seán Kennedy
 
Minimizing AI Hallucinations/Confabulations and the Path towards AGI with Exa...
Minimizing AI Hallucinations/Confabulations and the Path towards AGI with Exa...Minimizing AI Hallucinations/Confabulations and the Path towards AGI with Exa...
Minimizing AI Hallucinations/Confabulations and the Path towards AGI with Exa...Thomas Poetter
 
Predictive Analysis for Loan Default Presentation : Data Analysis Project PPT
Predictive Analysis for Loan Default  Presentation : Data Analysis Project PPTPredictive Analysis for Loan Default  Presentation : Data Analysis Project PPT
Predictive Analysis for Loan Default Presentation : Data Analysis Project PPTBoston Institute of Analytics
 
Decoding Patterns: Customer Churn Prediction Data Analysis Project
Decoding Patterns: Customer Churn Prediction Data Analysis ProjectDecoding Patterns: Customer Churn Prediction Data Analysis Project
Decoding Patterns: Customer Churn Prediction Data Analysis ProjectBoston Institute of Analytics
 

Último (20)

Unveiling the Role of Social Media Suspect Investigators in Preventing Online...
Unveiling the Role of Social Media Suspect Investigators in Preventing Online...Unveiling the Role of Social Media Suspect Investigators in Preventing Online...
Unveiling the Role of Social Media Suspect Investigators in Preventing Online...
 
FAIR, FAIRsharing, FAIR Cookbook and ELIXIR - Sansone SA - Boston 2024
FAIR, FAIRsharing, FAIR Cookbook and ELIXIR - Sansone SA - Boston 2024FAIR, FAIRsharing, FAIR Cookbook and ELIXIR - Sansone SA - Boston 2024
FAIR, FAIRsharing, FAIR Cookbook and ELIXIR - Sansone SA - Boston 2024
 
English-8-Q4-W3-Synthesizing-Essential-Information-From-Various-Sources-1.pdf
English-8-Q4-W3-Synthesizing-Essential-Information-From-Various-Sources-1.pdfEnglish-8-Q4-W3-Synthesizing-Essential-Information-From-Various-Sources-1.pdf
English-8-Q4-W3-Synthesizing-Essential-Information-From-Various-Sources-1.pdf
 
Data Factory in Microsoft Fabric (MsBIP #82)
Data Factory in Microsoft Fabric (MsBIP #82)Data Factory in Microsoft Fabric (MsBIP #82)
Data Factory in Microsoft Fabric (MsBIP #82)
 
The Power of Data-Driven Storytelling_ Unveiling the Layers of Insight.pptx
The Power of Data-Driven Storytelling_ Unveiling the Layers of Insight.pptxThe Power of Data-Driven Storytelling_ Unveiling the Layers of Insight.pptx
The Power of Data-Driven Storytelling_ Unveiling the Layers of Insight.pptx
 
SMOTE and K-Fold Cross Validation-Presentation.pptx
SMOTE and K-Fold Cross Validation-Presentation.pptxSMOTE and K-Fold Cross Validation-Presentation.pptx
SMOTE and K-Fold Cross Validation-Presentation.pptx
 
Networking Case Study prepared by teacher.pptx
Networking Case Study prepared by teacher.pptxNetworking Case Study prepared by teacher.pptx
Networking Case Study prepared by teacher.pptx
 
Data Analysis Project Presentation: Unveiling Your Ideal Customer, Bank Custo...
Data Analysis Project Presentation: Unveiling Your Ideal Customer, Bank Custo...Data Analysis Project Presentation: Unveiling Your Ideal Customer, Bank Custo...
Data Analysis Project Presentation: Unveiling Your Ideal Customer, Bank Custo...
 
wepik-insightful-infographics-a-data-visualization-overview-20240401133220kwr...
wepik-insightful-infographics-a-data-visualization-overview-20240401133220kwr...wepik-insightful-infographics-a-data-visualization-overview-20240401133220kwr...
wepik-insightful-infographics-a-data-visualization-overview-20240401133220kwr...
 
Defining Constituents, Data Vizzes and Telling a Data Story
Defining Constituents, Data Vizzes and Telling a Data StoryDefining Constituents, Data Vizzes and Telling a Data Story
Defining Constituents, Data Vizzes and Telling a Data Story
 
Cyber awareness ppt on the recorded data
Cyber awareness ppt on the recorded dataCyber awareness ppt on the recorded data
Cyber awareness ppt on the recorded data
 
Decoding the Heart: Student Presentation on Heart Attack Prediction with Data...
Decoding the Heart: Student Presentation on Heart Attack Prediction with Data...Decoding the Heart: Student Presentation on Heart Attack Prediction with Data...
Decoding the Heart: Student Presentation on Heart Attack Prediction with Data...
 
Principles and Practices of Data Visualization
Principles and Practices of Data VisualizationPrinciples and Practices of Data Visualization
Principles and Practices of Data Visualization
 
Conf42-LLM_Adding Generative AI to Real-Time Streaming Pipelines
Conf42-LLM_Adding Generative AI to Real-Time Streaming PipelinesConf42-LLM_Adding Generative AI to Real-Time Streaming Pipelines
Conf42-LLM_Adding Generative AI to Real-Time Streaming Pipelines
 
INTRODUCTION TO Natural language processing
INTRODUCTION TO Natural language processingINTRODUCTION TO Natural language processing
INTRODUCTION TO Natural language processing
 
Student profile product demonstration on grades, ability, well-being and mind...
Student profile product demonstration on grades, ability, well-being and mind...Student profile product demonstration on grades, ability, well-being and mind...
Student profile product demonstration on grades, ability, well-being and mind...
 
Minimizing AI Hallucinations/Confabulations and the Path towards AGI with Exa...
Minimizing AI Hallucinations/Confabulations and the Path towards AGI with Exa...Minimizing AI Hallucinations/Confabulations and the Path towards AGI with Exa...
Minimizing AI Hallucinations/Confabulations and the Path towards AGI with Exa...
 
Predictive Analysis for Loan Default Presentation : Data Analysis Project PPT
Predictive Analysis for Loan Default  Presentation : Data Analysis Project PPTPredictive Analysis for Loan Default  Presentation : Data Analysis Project PPT
Predictive Analysis for Loan Default Presentation : Data Analysis Project PPT
 
Decoding Patterns: Customer Churn Prediction Data Analysis Project
Decoding Patterns: Customer Churn Prediction Data Analysis ProjectDecoding Patterns: Customer Churn Prediction Data Analysis Project
Decoding Patterns: Customer Churn Prediction Data Analysis Project
 
Data Analysis Project: Stroke Prediction
Data Analysis Project: Stroke PredictionData Analysis Project: Stroke Prediction
Data Analysis Project: Stroke Prediction
 

Data Visualisation and Interactive Mapping to Support Response to Disease Outbreak - Project Overview

  • 1. www.unglobalpulse.org • info@unglobalpulse.org • 2015 1 DATA VISUALISATION AND INTERACTIVE MAPPING TO SUPPORT RESPONSE TO DISEASE OUTBREAK PARTNERS: WORLD HEALTH ORGANIZATION, UGANDAN MINISTRY OF HEALTH PROGRAMME AREA: PUBLIC HEALTH BACKGROUND Pulse Lab Kampala has established an on-going collaboration with the Ministry of Health in Uganda, in coordination with WHO, to strengthen disease response. After a typhoid outbreak occurred in Uganda from January-May 2015, Pulse Lab Kampala was invited to join the National Task Force in response to the outbreak. The Ugandan Ministry of Health’s district health information system contained structured weekly statistics from 5,991 health centres across the country. It therefore had substantial detail about the typhoid outbreak. However, with the available static mapping tools it was difficult to obtain a full picture of the outbreak to inform response. Pulse Lab Kampala utilized advanced analytics technologies to help present dynamic information about the disease outbreak visually in an effort to aid decision-making. INTERACTIVE MAPPING OF HEALTH DATA AND EPIDEMIC RISK FACTORS Data collected at the health centres where typhoid cases were treated contained the home and work locations of individuals reported to have had the disease. These locations were recorded as free text, and as a result, location names were sometimes spelled differently. For example “Namugona”, “Namugoona”, “Namungoona”, “Namungona” were all used to refer to the same location. In order to solve this challenge, automatic methods to convert the names of locations to longitude/latitude data were developed using geo-referencing tools (GeoNames, OpenStreetMap and Google Maps). This process made it possible to explore the data using visual analytics techniques and revealing clusters of infection. The data visualisations, which were generated based on weekly reports from health centres, were displayed in a web dashboard showing interactive maps at district, sub-county and individual health facility level. The data used for the visualisations was anonymised, preserving the privacy of patients. Interactive district and sub-county typhoid map allows for exploration of data from health centres. In order to better understand the transmission patterns of typhoid, several visualisations were produced to overlay the spread of the disease with risk factors that affect the transmission. Map overlays, showing topological wetness index and population density, were produced and included in the online dashboard. Mobility is another risk factor for typhoid transmission. Using historical anonymised data from a Ugandan telecommunications operator, human mobility patterns from infection hot spots were computed and visualized together with the spread of the disease. HOW TO CITE THIS DOCUMENT: UN Global Pulse, “Data Visualisation and Interactive Mapping to Support Response to Disease Outbreak”, Global Pulse Project Series no. 20, 2015. SUMMARY From January – May 2015, a typhoid outbreak occurred in Uganda. Pulse Lab Kampala was invited to join the National Task Force in response to the outbreak. In coordination with WHO, and in collaboration with the Ministry of Health, Pulse Lab Kampala produced a series of data visualisations to support the early response to the disease. Visualisations of weekly reports from health centres were produced with interactive maps at district, sub-county and individual health facility level. The visualisations allowed decision making for the allocation of medicine, medical personnel and health centres, as well as targeting training areas.
  • 2. www.unglobalpulse.org • info@unglobalpulse.org • 2015 2 Interactive map of case locations, overlaid on topological wetness index. Visualisation of sub-county level typhoid incidence and human mobility from highly infected areas. INSIGHTS & OUTCOMES The visualisations proved helpful for decision-making regarding planning for mobilization of health teams, and the allocation of medical supplies and determining target areas for provision of training to health centres. By making multi-level infection data available in an accessible and interactive format, its practical utility for surveillance is improved even without adding supplementary sources of data. Geo-referencing tools were used to rapidly map case lists with inconsistent, free-text place names. By automating the geo-referencing process, new maps could be produced as soon as new line list datasets were available. Interactive mapping tools provide the ability to show infection rate data along with information about risk factors, including population mobility, wetness/drainage and population density. Being able to see, for example, the urban areas that have poor natural drainage and high population density, yet relatively low infection counts, provides information that outbreak containment measures are operating adequately in those regions. Population mobility was only weakly correlated with the pattern of disease spread in this case (statistically significant, but not a strong enough predictor to be of practical impact in the outbreak response). This may be due to the limited spatial spread of the infection; despite high numbers of cases in central Kampala, and many cases in surrounding sub-counties, the outbreak was curtailed before there was wide-scale infection in districts further afield. CONCLUSIONS During outbreaks of infectious diseases, case data is captured at health centres. Given the complex nature of this data, however, standard mapping and tabular methods of display provide a limited view into the progression of an epidemic and the influence of different risk factors. Data visualisation techniques and interactive maps make complex epidemic data more accessible to decision makers and field teams. By providing the ability to explore health facility data at multiple levels of detail, authorities were able to plan resource allocation effectively, including for medical supplies, medical personnel and training. IMPLICATIONS & RECOMMENDATIONS • It is recommended to use data visualisation tools with the types of data routinely collected during an outbreak of infectious disease to support the response to the outbreak. • Resource allocation and prioritisation can be optimized during the time-critical response phase by gaining visual insights into the progression of an epidemic, and the interaction with various risk factors. • The on-going partnership between Pulse Lab Kampala and Ministry of Health provides an excellent framework of collaboration to respond to diseases. Hands-on capacity building on data innovation and data science is provided to staff at Ministry of Health on an on-going basis.