SlideShare a Scribd company logo
1 of 36
Statistics
       Data
6

5

4

3

2

1

0
What is an average?
 An average is a measure of the "middle" value of a
                   set of data.


Mode, Mean, and Median, are all types of averages.


They can be used to help summarise a group of data.
WALT…


…understand  what the Mode is
and how to identify it in data.
Definition of Mode
• The “mode” for a set of data is the number (or item)
               that occurs most frequently.
• Sometimes data can have more than one mode. This
 happens when two or more numbers (or items)occur an
           equal number of times in the data.
    • A data set with two modes is called bimodal.
     • A data set with 3 modes is called Trimodal
• It is also possible to have a set of data with no mode.
How to find the Mode.
   Mode is the most common number
   Put the numbers in order
   Choose the number that appears the
    most frequently.
Class shoe sizes: 3, 5, 5, 6, 4, 3, 2, 1, 5, 6
Put in order: 1, 2, 3, 3, 4, 5, 5, 5, 6, 6


The class modal shoe size is 5.
Find the mode in this data set
Class high jump heights (in metres)

1.05, 1.10, 1.05, .95, .85,1.05, 1.10,
                1.20,
   .95, 1.25, 1.30, .75, .80, .90,

.75, .80, .85, .90, .95,.95, 1.05,1.05,
  1.05, 1.10, 1.10, 1.20, 1.25, 1.30
          The mode is 1.05m
Mode of non-numerical data
Red, green, blue, red, blue, yellow, re
d, pink, green, white.


Red, red, red, blue, blue, green, green
, yellow, pink, white.

Mode = red
What is the mode in this data?
                            Icecream
10
 9
 8
 7
 6
 5
 4                                                     Icecream
 3
 2
 1
 0
     strawberry   vanilla     chocolate   neopolitan
Bar graph data


Mode = Neopolitan
Bimodal and trimodal
                 Bimodal
Data Set = 2, 5, 2, 3, 5, 4, 7
2, 2, 3, 4, 5, 5, 7
Modes = 2 and 5
                Trimodal
Data Set = 2, 5, 2, 7, 5, 4, 7
2, 2, 4, 5, 5, 7, 7
Modes = 2, 5, and 7
Example
Data Set= 3, 5, 6, 4, 7, 8, 9, 2, 1, 0

What is the mode?
0,1,2,3,4,5,6,7,8,9
Is the mode = 0?

Mode = no mode
When might the Mode be used?
    The mode can be useful for dealing with
    categorical data. For example, if a sandwich shop
    sells 10 different types of sandwiches, the mode
    would represent the most popular sandwich.
   The mode can be useful for summarising survey
    data.
    The mode can be useful for election votes.
Averages
   What other ways can we calculate
    the average of a set of data?

   We can use the Mean to give us an
    average of numerical data.
WALT…


understand what the Mean is and how
        to identify it in data.
Definition of the Mean
   The „Mean‟ is the „Average‟ value of numerical
    data.
   The Mean (or average) is found by adding all
    scores together and dividing by the number of
    scores.
Example

   Class shoe sizes: 3, 5, 5, 6, 4, 3, 2, 1, 5, 6
   Add up the numbers:
   3 + 5 + 5 + 6 + 4 + 3 + 2 + 1 + 5 + 6 = 40
   Divide by how many numbers:
   40 ÷ 10 = 4
   The class mean shoe size is 4
Find the Mean

        Class high jump heights (in metres)
1.05, 1.10, 1.05, .95, .85,1.05, 1.10, 1.20, .95, 1.2
               5, 1.30, .75, .80, .90,

  1.05 + 1.10 + 1.05 +.95 + .85 +1.05 + 1.10 +
  1.20 + .95 + 1.25 + 1.30 + .75 + .80 + .90 =
                     14.3m

Mean = 14.3 divided by the number of people that
                  jumped (14)
               14.3 ÷ 14 = 1.02m
Population of NZ Cities
1600000
1400000
1200000
1000000
 800000
 600000
 400000                                       Population
 200000
      0


          What is the mode?   What is the mean?
Work it out
   Mode = most common – 390,000 is the mode of
    the population of the NZ Cities on the graph.
   Mean = the average population of the NZ cities
    on the graph –

200,000 + 60,000 + 390,000 + 390,000 + 125,000
+ 1355,000 = 2520,000

Mean = 2520,000 ÷ 6 = 420,000
When to use the mean…
   The mean can give a good average value when
    the data is fairly evenly distributed as in the high
    jump heights.

       Class high jump heights (in metres)
 1.05 + 1.10 + 1.05 +.95 + .85 +1.05 + 1.10 +
 1.20 + .95 + 1.25 + 1.30 + .75 + .80 + .90 =
                      14.3m
Mean = 14.3 divided by the number of people that
                   jumped (14)
                14.3 ÷ 14 = 1.02m
However
   It is not always suitable to use the
    mean to get an average of data
    when there is a huge variation in
    data.
Example
          Population of NZ Cities
1600000
1400000
1200000
1000000
 800000
 600000
 400000                             Population
 200000
      0
What is an average?
                    ,
 .
 An average is a measure of the "middle" value of a
                   set of data.


Mode, Mean, and Median, are all types of averages.


They can be used to help summarise a group of data.
Recap
Definition of Mode –
The “Mode” for a set of data is the
number (or item) that occurs most
frequently.
Definition of Mean –
The “Mean” is the „Average‟ value of
numerical data.
Example
.
  Class high jump heights (in metres)
1.05, 1.10, 1.05, .95, .85,1.05, 1.05,1.
 20, .95, .50, .80, .65, 1.05, 1.10,.95
.95, 1.25, 1.30, .75, .80, .90, 1.00, 1.1
     0, 1.15, 1.25, 1.10, 1.10, 1.15
           What is the mode?
           What is the mean?
Answers

Mode = 1.05 and 1.10

Mean = 1.00
WALT…


..understand what the Median is and
     how to identify it in data.
Definition of Median
   The Median is the middle value when
    numbers are put in order.
   To find the Median, place the numbers in
    numerical order and find the middle
    number.
   If the total number of values in the
    sample is even, the median is calculated
    by finding the mean of the two values in
    the middle.
Find the median…
Room 19 test scores
56%, 48%, 76%, 78%, 85%, 77%, 91%, 77%, 73
%, 88%, 69%, 67%, 58%, 64%, 88%, 89%, 87%,
83%, 73%, 74%, 92%, 69%, 80%, 80%, 75%, 72
%.

In order –
48%, 56%, 58%, 64%, 67%, 69%, 69%, 72%, 73
%, 73%, 74%, 75%, 76%, 77%, 77%, 78%, 80%,
80%, 83%, 85%, 87%, 88%, 88%, 89%, 91%, 92
%,
Find the mode
           How many children in your family?
12

10

8

6
                                               Quantity
4

2

0
     Two       Three   Four   Five    Six
Find the Mean
                          .
.             How many children in your family?
12

10

    8

    6
                                                  Quantity
    4

    2

    0
        Two       Three   Four   Five    Six
To find the mean…
(10 x 2) + (10 x 3) + (5 x 4) + (3 x 5)
+ (1 x 6) = 91

91 ÷ 29 = 3.13 rounded to 3

Mean = 3
Find the. median
       .         How many children in your family?
12

10

    8

    6
                                                      Quantity
    4

    2

    0
            Two       Three   Four   Five    Six
To find the median…
 Put the numbers in order…
2, 2, 2, 2, 2, 2, 2, 2, 2, 2, 3, 3, 3, 3, 3,
3, 3, 3, 3, 3, 4, 4, 4, 4, 4, 5, 5, 5, 6.

The Median = 3
Range
   Range is the gap from the biggest to
    smallest value.
   Put the numbers in order
   Take the smallest number away from
    the largest.
Class shoe sizes: 3, 5, 5, 6, 4, 3, 2, 1, 5, 6
Put in order: 1, 2, 3, 3, 4, 5, 5, 5, 6, 6
Subtract smallest from largest: 6 – 1 = 5
Range: 5
When should you use the
      Mean, Mode, or Median?

   Use the mean for data which is fairly
    evenly distributed.
   Use the median for data which has
    extreme differences in scores.
   Use the mode in categorical data
    where the original scores are known.

More Related Content

What's hot

Presentation on "Measure of central tendency"
Presentation on "Measure of central tendency"Presentation on "Measure of central tendency"
Presentation on "Measure of central tendency"muhammad raza
 
Mean, median, and mode
Mean, median, and modeMean, median, and mode
Mean, median, and modeguest455435
 
Mean, median, mode, & range ppt
Mean, median, mode, & range pptMean, median, mode, & range ppt
Mean, median, mode, & range pptmashal2013
 
Frequency Distribution
Frequency DistributionFrequency Distribution
Frequency DistributionTeacherMariza
 
Estimating population mean
Estimating population meanEstimating population mean
Estimating population meanRonaldo Cabardo
 
Measures of Central Tendency, Variability and Shapes
Measures of Central Tendency, Variability and ShapesMeasures of Central Tendency, Variability and Shapes
Measures of Central Tendency, Variability and ShapesScholarsPoint1
 
Measures of central tendency
Measures of central tendencyMeasures of central tendency
Measures of central tendencyAlex Chris
 
Measures of central tendency
Measures of central tendencyMeasures of central tendency
Measures of central tendencykreshajay
 
Measures of central tendency ppt
Measures of central tendency pptMeasures of central tendency ppt
Measures of central tendency pptNighatKanwal
 
Measures of central tendency
Measures of central tendencyMeasures of central tendency
Measures of central tendencyKenneth Osabal
 
Introduction to Statistics - Basic concepts
Introduction to Statistics - Basic conceptsIntroduction to Statistics - Basic concepts
Introduction to Statistics - Basic conceptsDocIbrahimAbdelmonaem
 

What's hot (20)

Descriptive statistics
Descriptive statisticsDescriptive statistics
Descriptive statistics
 
Measures of Dispersion
Measures of DispersionMeasures of Dispersion
Measures of Dispersion
 
Presentation on "Measure of central tendency"
Presentation on "Measure of central tendency"Presentation on "Measure of central tendency"
Presentation on "Measure of central tendency"
 
Percentile
PercentilePercentile
Percentile
 
Mean, median, and mode
Mean, median, and modeMean, median, and mode
Mean, median, and mode
 
Arithmetic mean
Arithmetic meanArithmetic mean
Arithmetic mean
 
Mean, median, mode, & range ppt
Mean, median, mode, & range pptMean, median, mode, & range ppt
Mean, median, mode, & range ppt
 
Frequency Distribution
Frequency DistributionFrequency Distribution
Frequency Distribution
 
Central Tendency & Dispersion
Central Tendency & DispersionCentral Tendency & Dispersion
Central Tendency & Dispersion
 
Estimating population mean
Estimating population meanEstimating population mean
Estimating population mean
 
MEAN DEVIATION
MEAN DEVIATIONMEAN DEVIATION
MEAN DEVIATION
 
Measures of dispersion
Measures of dispersionMeasures of dispersion
Measures of dispersion
 
Measures of Central Tendency, Variability and Shapes
Measures of Central Tendency, Variability and ShapesMeasures of Central Tendency, Variability and Shapes
Measures of Central Tendency, Variability and Shapes
 
Measures of central tendency
Measures of central tendencyMeasures of central tendency
Measures of central tendency
 
Measures of central tendency
Measures of central tendencyMeasures of central tendency
Measures of central tendency
 
Measures of central tendency ppt
Measures of central tendency pptMeasures of central tendency ppt
Measures of central tendency ppt
 
Median & mode
Median & modeMedian & mode
Median & mode
 
Measures of central tendency
Measures of central tendencyMeasures of central tendency
Measures of central tendency
 
Statistical graphs
Statistical graphsStatistical graphs
Statistical graphs
 
Introduction to Statistics - Basic concepts
Introduction to Statistics - Basic conceptsIntroduction to Statistics - Basic concepts
Introduction to Statistics - Basic concepts
 

Similar to Statistics

Measures of Central Tendency.ppt
Measures of Central Tendency.pptMeasures of Central Tendency.ppt
Measures of Central Tendency.pptAdamRayManlunas1
 
Measure of Central Tendency Bonsu& Warmsley
Measure of Central Tendency Bonsu& WarmsleyMeasure of Central Tendency Bonsu& Warmsley
Measure of Central Tendency Bonsu& Warmsleybbonsu
 
Topic 8a Basic Statistics
Topic 8a Basic StatisticsTopic 8a Basic Statistics
Topic 8a Basic StatisticsYee Bee Choo
 
Mean-Median-Mode-Range-Demonstration.pptx
Mean-Median-Mode-Range-Demonstration.pptxMean-Median-Mode-Range-Demonstration.pptx
Mean-Median-Mode-Range-Demonstration.pptxssuserb9172b1
 
Mean-Median-Mode-Range-Demonstration.pptx
Mean-Median-Mode-Range-Demonstration.pptxMean-Median-Mode-Range-Demonstration.pptx
Mean-Median-Mode-Range-Demonstration.pptxkrishan425
 
Statistics for math (English Version)
Statistics for math (English Version)Statistics for math (English Version)
Statistics for math (English Version)Tito_14
 
Mean, Median, Mode And Range by Mary T
Mean, Median, Mode And Range by Mary TMean, Median, Mode And Range by Mary T
Mean, Median, Mode And Range by Mary TJulian Charter
 
Analysing our results
Analysing our resultsAnalysing our results
Analysing our resultsgwsis
 
Mean_Median_Mode.ppthhhhhhhhhhhhhhhhhhhhhhhhhhhhhhhhhhhhhhhhhhhhhhhhhhhhhhhhh...
Mean_Median_Mode.ppthhhhhhhhhhhhhhhhhhhhhhhhhhhhhhhhhhhhhhhhhhhhhhhhhhhhhhhhh...Mean_Median_Mode.ppthhhhhhhhhhhhhhhhhhhhhhhhhhhhhhhhhhhhhhhhhhhhhhhhhhhhhhhhh...
Mean_Median_Mode.ppthhhhhhhhhhhhhhhhhhhhhhhhhhhhhhhhhhhhhhhhhhhhhhhhhhhhhhhhh...JuliusRomano3
 
Basics of Stats (2).pptx
Basics of Stats (2).pptxBasics of Stats (2).pptx
Basics of Stats (2).pptxmadihamaqbool6
 
Algebra unit 9.3
Algebra unit 9.3Algebra unit 9.3
Algebra unit 9.3Mark Ryder
 
DEMO LESSON PLAN.docx
DEMO LESSON PLAN.docxDEMO LESSON PLAN.docx
DEMO LESSON PLAN.docxChinGa7
 
UNIT III - Arrays - Measures of Center and Variation (2).ppt
UNIT III - Arrays - Measures of Center and Variation (2).pptUNIT III - Arrays - Measures of Center and Variation (2).ppt
UNIT III - Arrays - Measures of Center and Variation (2).pptAjithGhoyal
 
Statistics101: Numerical Measures
Statistics101: Numerical MeasuresStatistics101: Numerical Measures
Statistics101: Numerical Measureszahid-mian
 
Lect 3 background mathematics for Data Mining
Lect 3 background mathematics for Data MiningLect 3 background mathematics for Data Mining
Lect 3 background mathematics for Data Mininghktripathy
 
Lect 3 background mathematics
Lect 3 background mathematicsLect 3 background mathematics
Lect 3 background mathematicshktripathy
 
Mean median mode_range
Mean median mode_rangeMean median mode_range
Mean median mode_rangeWorserbay
 
Statistical measures
Statistical measuresStatistical measures
Statistical measureslisawhipp
 
Sec. 2.8 mean, median, mode and range
Sec. 2.8 mean, median, mode and rangeSec. 2.8 mean, median, mode and range
Sec. 2.8 mean, median, mode and rangebweldon
 
Measures of Central Tendency Final.ppt
Measures of Central Tendency Final.pptMeasures of Central Tendency Final.ppt
Measures of Central Tendency Final.pptAdamManlunas
 

Similar to Statistics (20)

Measures of Central Tendency.ppt
Measures of Central Tendency.pptMeasures of Central Tendency.ppt
Measures of Central Tendency.ppt
 
Measure of Central Tendency Bonsu& Warmsley
Measure of Central Tendency Bonsu& WarmsleyMeasure of Central Tendency Bonsu& Warmsley
Measure of Central Tendency Bonsu& Warmsley
 
Topic 8a Basic Statistics
Topic 8a Basic StatisticsTopic 8a Basic Statistics
Topic 8a Basic Statistics
 
Mean-Median-Mode-Range-Demonstration.pptx
Mean-Median-Mode-Range-Demonstration.pptxMean-Median-Mode-Range-Demonstration.pptx
Mean-Median-Mode-Range-Demonstration.pptx
 
Mean-Median-Mode-Range-Demonstration.pptx
Mean-Median-Mode-Range-Demonstration.pptxMean-Median-Mode-Range-Demonstration.pptx
Mean-Median-Mode-Range-Demonstration.pptx
 
Statistics for math (English Version)
Statistics for math (English Version)Statistics for math (English Version)
Statistics for math (English Version)
 
Mean, Median, Mode And Range by Mary T
Mean, Median, Mode And Range by Mary TMean, Median, Mode And Range by Mary T
Mean, Median, Mode And Range by Mary T
 
Analysing our results
Analysing our resultsAnalysing our results
Analysing our results
 
Mean_Median_Mode.ppthhhhhhhhhhhhhhhhhhhhhhhhhhhhhhhhhhhhhhhhhhhhhhhhhhhhhhhhh...
Mean_Median_Mode.ppthhhhhhhhhhhhhhhhhhhhhhhhhhhhhhhhhhhhhhhhhhhhhhhhhhhhhhhhh...Mean_Median_Mode.ppthhhhhhhhhhhhhhhhhhhhhhhhhhhhhhhhhhhhhhhhhhhhhhhhhhhhhhhhh...
Mean_Median_Mode.ppthhhhhhhhhhhhhhhhhhhhhhhhhhhhhhhhhhhhhhhhhhhhhhhhhhhhhhhhh...
 
Basics of Stats (2).pptx
Basics of Stats (2).pptxBasics of Stats (2).pptx
Basics of Stats (2).pptx
 
Algebra unit 9.3
Algebra unit 9.3Algebra unit 9.3
Algebra unit 9.3
 
DEMO LESSON PLAN.docx
DEMO LESSON PLAN.docxDEMO LESSON PLAN.docx
DEMO LESSON PLAN.docx
 
UNIT III - Arrays - Measures of Center and Variation (2).ppt
UNIT III - Arrays - Measures of Center and Variation (2).pptUNIT III - Arrays - Measures of Center and Variation (2).ppt
UNIT III - Arrays - Measures of Center and Variation (2).ppt
 
Statistics101: Numerical Measures
Statistics101: Numerical MeasuresStatistics101: Numerical Measures
Statistics101: Numerical Measures
 
Lect 3 background mathematics for Data Mining
Lect 3 background mathematics for Data MiningLect 3 background mathematics for Data Mining
Lect 3 background mathematics for Data Mining
 
Lect 3 background mathematics
Lect 3 background mathematicsLect 3 background mathematics
Lect 3 background mathematics
 
Mean median mode_range
Mean median mode_rangeMean median mode_range
Mean median mode_range
 
Statistical measures
Statistical measuresStatistical measures
Statistical measures
 
Sec. 2.8 mean, median, mode and range
Sec. 2.8 mean, median, mode and rangeSec. 2.8 mean, median, mode and range
Sec. 2.8 mean, median, mode and range
 
Measures of Central Tendency Final.ppt
Measures of Central Tendency Final.pptMeasures of Central Tendency Final.ppt
Measures of Central Tendency Final.ppt
 

Recently uploaded

Mastering the Unannounced Regulatory Inspection
Mastering the Unannounced Regulatory InspectionMastering the Unannounced Regulatory Inspection
Mastering the Unannounced Regulatory InspectionSafetyChain Software
 
Employee wellbeing at the workplace.pptx
Employee wellbeing at the workplace.pptxEmployee wellbeing at the workplace.pptx
Employee wellbeing at the workplace.pptxNirmalaLoungPoorunde1
 
Separation of Lanthanides/ Lanthanides and Actinides
Separation of Lanthanides/ Lanthanides and ActinidesSeparation of Lanthanides/ Lanthanides and Actinides
Separation of Lanthanides/ Lanthanides and ActinidesFatimaKhan178732
 
The basics of sentences session 2pptx copy.pptx
The basics of sentences session 2pptx copy.pptxThe basics of sentences session 2pptx copy.pptx
The basics of sentences session 2pptx copy.pptxheathfieldcps1
 
Introduction to AI in Higher Education_draft.pptx
Introduction to AI in Higher Education_draft.pptxIntroduction to AI in Higher Education_draft.pptx
Introduction to AI in Higher Education_draft.pptxpboyjonauth
 
Organic Name Reactions for the students and aspirants of Chemistry12th.pptx
Organic Name Reactions  for the students and aspirants of Chemistry12th.pptxOrganic Name Reactions  for the students and aspirants of Chemistry12th.pptx
Organic Name Reactions for the students and aspirants of Chemistry12th.pptxVS Mahajan Coaching Centre
 
Q4-W6-Restating Informational Text Grade 3
Q4-W6-Restating Informational Text Grade 3Q4-W6-Restating Informational Text Grade 3
Q4-W6-Restating Informational Text Grade 3JemimahLaneBuaron
 
Grant Readiness 101 TechSoup and Remy Consulting
Grant Readiness 101 TechSoup and Remy ConsultingGrant Readiness 101 TechSoup and Remy Consulting
Grant Readiness 101 TechSoup and Remy ConsultingTechSoup
 
microwave assisted reaction. General introduction
microwave assisted reaction. General introductionmicrowave assisted reaction. General introduction
microwave assisted reaction. General introductionMaksud Ahmed
 
BASLIQ CURRENT LOOKBOOK LOOKBOOK(1) (1).pdf
BASLIQ CURRENT LOOKBOOK  LOOKBOOK(1) (1).pdfBASLIQ CURRENT LOOKBOOK  LOOKBOOK(1) (1).pdf
BASLIQ CURRENT LOOKBOOK LOOKBOOK(1) (1).pdfSoniaTolstoy
 
Incoming and Outgoing Shipments in 1 STEP Using Odoo 17
Incoming and Outgoing Shipments in 1 STEP Using Odoo 17Incoming and Outgoing Shipments in 1 STEP Using Odoo 17
Incoming and Outgoing Shipments in 1 STEP Using Odoo 17Celine George
 
CARE OF CHILD IN INCUBATOR..........pptx
CARE OF CHILD IN INCUBATOR..........pptxCARE OF CHILD IN INCUBATOR..........pptx
CARE OF CHILD IN INCUBATOR..........pptxGaneshChakor2
 
Paris 2024 Olympic Geographies - an activity
Paris 2024 Olympic Geographies - an activityParis 2024 Olympic Geographies - an activity
Paris 2024 Olympic Geographies - an activityGeoBlogs
 
Crayon Activity Handout For the Crayon A
Crayon Activity Handout For the Crayon ACrayon Activity Handout For the Crayon A
Crayon Activity Handout For the Crayon AUnboundStockton
 
Contemporary philippine arts from the regions_PPT_Module_12 [Autosaved] (1).pptx
Contemporary philippine arts from the regions_PPT_Module_12 [Autosaved] (1).pptxContemporary philippine arts from the regions_PPT_Module_12 [Autosaved] (1).pptx
Contemporary philippine arts from the regions_PPT_Module_12 [Autosaved] (1).pptxRoyAbrique
 

Recently uploaded (20)

Mastering the Unannounced Regulatory Inspection
Mastering the Unannounced Regulatory InspectionMastering the Unannounced Regulatory Inspection
Mastering the Unannounced Regulatory Inspection
 
Employee wellbeing at the workplace.pptx
Employee wellbeing at the workplace.pptxEmployee wellbeing at the workplace.pptx
Employee wellbeing at the workplace.pptx
 
Separation of Lanthanides/ Lanthanides and Actinides
Separation of Lanthanides/ Lanthanides and ActinidesSeparation of Lanthanides/ Lanthanides and Actinides
Separation of Lanthanides/ Lanthanides and Actinides
 
Código Creativo y Arte de Software | Unidad 1
Código Creativo y Arte de Software | Unidad 1Código Creativo y Arte de Software | Unidad 1
Código Creativo y Arte de Software | Unidad 1
 
The basics of sentences session 2pptx copy.pptx
The basics of sentences session 2pptx copy.pptxThe basics of sentences session 2pptx copy.pptx
The basics of sentences session 2pptx copy.pptx
 
Introduction to AI in Higher Education_draft.pptx
Introduction to AI in Higher Education_draft.pptxIntroduction to AI in Higher Education_draft.pptx
Introduction to AI in Higher Education_draft.pptx
 
Organic Name Reactions for the students and aspirants of Chemistry12th.pptx
Organic Name Reactions  for the students and aspirants of Chemistry12th.pptxOrganic Name Reactions  for the students and aspirants of Chemistry12th.pptx
Organic Name Reactions for the students and aspirants of Chemistry12th.pptx
 
Q4-W6-Restating Informational Text Grade 3
Q4-W6-Restating Informational Text Grade 3Q4-W6-Restating Informational Text Grade 3
Q4-W6-Restating Informational Text Grade 3
 
Model Call Girl in Bikash Puri Delhi reach out to us at 🔝9953056974🔝
Model Call Girl in Bikash Puri  Delhi reach out to us at 🔝9953056974🔝Model Call Girl in Bikash Puri  Delhi reach out to us at 🔝9953056974🔝
Model Call Girl in Bikash Puri Delhi reach out to us at 🔝9953056974🔝
 
Grant Readiness 101 TechSoup and Remy Consulting
Grant Readiness 101 TechSoup and Remy ConsultingGrant Readiness 101 TechSoup and Remy Consulting
Grant Readiness 101 TechSoup and Remy Consulting
 
microwave assisted reaction. General introduction
microwave assisted reaction. General introductionmicrowave assisted reaction. General introduction
microwave assisted reaction. General introduction
 
BASLIQ CURRENT LOOKBOOK LOOKBOOK(1) (1).pdf
BASLIQ CURRENT LOOKBOOK  LOOKBOOK(1) (1).pdfBASLIQ CURRENT LOOKBOOK  LOOKBOOK(1) (1).pdf
BASLIQ CURRENT LOOKBOOK LOOKBOOK(1) (1).pdf
 
Incoming and Outgoing Shipments in 1 STEP Using Odoo 17
Incoming and Outgoing Shipments in 1 STEP Using Odoo 17Incoming and Outgoing Shipments in 1 STEP Using Odoo 17
Incoming and Outgoing Shipments in 1 STEP Using Odoo 17
 
Model Call Girl in Tilak Nagar Delhi reach out to us at 🔝9953056974🔝
Model Call Girl in Tilak Nagar Delhi reach out to us at 🔝9953056974🔝Model Call Girl in Tilak Nagar Delhi reach out to us at 🔝9953056974🔝
Model Call Girl in Tilak Nagar Delhi reach out to us at 🔝9953056974🔝
 
CARE OF CHILD IN INCUBATOR..........pptx
CARE OF CHILD IN INCUBATOR..........pptxCARE OF CHILD IN INCUBATOR..........pptx
CARE OF CHILD IN INCUBATOR..........pptx
 
Paris 2024 Olympic Geographies - an activity
Paris 2024 Olympic Geographies - an activityParis 2024 Olympic Geographies - an activity
Paris 2024 Olympic Geographies - an activity
 
TataKelola dan KamSiber Kecerdasan Buatan v022.pdf
TataKelola dan KamSiber Kecerdasan Buatan v022.pdfTataKelola dan KamSiber Kecerdasan Buatan v022.pdf
TataKelola dan KamSiber Kecerdasan Buatan v022.pdf
 
Crayon Activity Handout For the Crayon A
Crayon Activity Handout For the Crayon ACrayon Activity Handout For the Crayon A
Crayon Activity Handout For the Crayon A
 
Contemporary philippine arts from the regions_PPT_Module_12 [Autosaved] (1).pptx
Contemporary philippine arts from the regions_PPT_Module_12 [Autosaved] (1).pptxContemporary philippine arts from the regions_PPT_Module_12 [Autosaved] (1).pptx
Contemporary philippine arts from the regions_PPT_Module_12 [Autosaved] (1).pptx
 
Staff of Color (SOC) Retention Efforts DDSD
Staff of Color (SOC) Retention Efforts DDSDStaff of Color (SOC) Retention Efforts DDSD
Staff of Color (SOC) Retention Efforts DDSD
 

Statistics

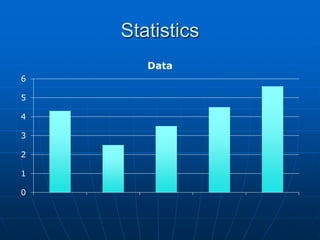
  • 1. Statistics Data 6 5 4 3 2 1 0
  • 2. What is an average? An average is a measure of the "middle" value of a set of data. Mode, Mean, and Median, are all types of averages. They can be used to help summarise a group of data.
  • 3. WALT… …understand what the Mode is and how to identify it in data.
  • 4. Definition of Mode • The “mode” for a set of data is the number (or item) that occurs most frequently. • Sometimes data can have more than one mode. This happens when two or more numbers (or items)occur an equal number of times in the data. • A data set with two modes is called bimodal. • A data set with 3 modes is called Trimodal • It is also possible to have a set of data with no mode.
  • 5. How to find the Mode.  Mode is the most common number  Put the numbers in order  Choose the number that appears the most frequently. Class shoe sizes: 3, 5, 5, 6, 4, 3, 2, 1, 5, 6 Put in order: 1, 2, 3, 3, 4, 5, 5, 5, 6, 6 The class modal shoe size is 5.
  • 6. Find the mode in this data set Class high jump heights (in metres) 1.05, 1.10, 1.05, .95, .85,1.05, 1.10, 1.20, .95, 1.25, 1.30, .75, .80, .90, .75, .80, .85, .90, .95,.95, 1.05,1.05, 1.05, 1.10, 1.10, 1.20, 1.25, 1.30 The mode is 1.05m
  • 7. Mode of non-numerical data Red, green, blue, red, blue, yellow, re d, pink, green, white. Red, red, red, blue, blue, green, green , yellow, pink, white. Mode = red
  • 8. What is the mode in this data? Icecream 10 9 8 7 6 5 4 Icecream 3 2 1 0 strawberry vanilla chocolate neopolitan
  • 9. Bar graph data Mode = Neopolitan
  • 10. Bimodal and trimodal Bimodal Data Set = 2, 5, 2, 3, 5, 4, 7 2, 2, 3, 4, 5, 5, 7 Modes = 2 and 5 Trimodal Data Set = 2, 5, 2, 7, 5, 4, 7 2, 2, 4, 5, 5, 7, 7 Modes = 2, 5, and 7
  • 11. Example Data Set= 3, 5, 6, 4, 7, 8, 9, 2, 1, 0 What is the mode? 0,1,2,3,4,5,6,7,8,9 Is the mode = 0? Mode = no mode
  • 12. When might the Mode be used?  The mode can be useful for dealing with categorical data. For example, if a sandwich shop sells 10 different types of sandwiches, the mode would represent the most popular sandwich.  The mode can be useful for summarising survey data.  The mode can be useful for election votes.
  • 13. Averages  What other ways can we calculate the average of a set of data?  We can use the Mean to give us an average of numerical data.
  • 14. WALT… understand what the Mean is and how to identify it in data.
  • 15. Definition of the Mean  The „Mean‟ is the „Average‟ value of numerical data.  The Mean (or average) is found by adding all scores together and dividing by the number of scores.
  • 16. Example  Class shoe sizes: 3, 5, 5, 6, 4, 3, 2, 1, 5, 6  Add up the numbers:  3 + 5 + 5 + 6 + 4 + 3 + 2 + 1 + 5 + 6 = 40  Divide by how many numbers:  40 ÷ 10 = 4  The class mean shoe size is 4
  • 17. Find the Mean Class high jump heights (in metres) 1.05, 1.10, 1.05, .95, .85,1.05, 1.10, 1.20, .95, 1.2 5, 1.30, .75, .80, .90, 1.05 + 1.10 + 1.05 +.95 + .85 +1.05 + 1.10 + 1.20 + .95 + 1.25 + 1.30 + .75 + .80 + .90 = 14.3m Mean = 14.3 divided by the number of people that jumped (14) 14.3 ÷ 14 = 1.02m
  • 18. Population of NZ Cities 1600000 1400000 1200000 1000000 800000 600000 400000 Population 200000 0 What is the mode? What is the mean?
  • 19. Work it out  Mode = most common – 390,000 is the mode of the population of the NZ Cities on the graph.  Mean = the average population of the NZ cities on the graph – 200,000 + 60,000 + 390,000 + 390,000 + 125,000 + 1355,000 = 2520,000 Mean = 2520,000 ÷ 6 = 420,000
  • 20. When to use the mean…  The mean can give a good average value when the data is fairly evenly distributed as in the high jump heights. Class high jump heights (in metres) 1.05 + 1.10 + 1.05 +.95 + .85 +1.05 + 1.10 + 1.20 + .95 + 1.25 + 1.30 + .75 + .80 + .90 = 14.3m Mean = 14.3 divided by the number of people that jumped (14) 14.3 ÷ 14 = 1.02m
  • 21. However  It is not always suitable to use the mean to get an average of data when there is a huge variation in data.
  • 22. Example Population of NZ Cities 1600000 1400000 1200000 1000000 800000 600000 400000 Population 200000 0
  • 23. What is an average? , . An average is a measure of the "middle" value of a set of data. Mode, Mean, and Median, are all types of averages. They can be used to help summarise a group of data.
  • 24. Recap Definition of Mode – The “Mode” for a set of data is the number (or item) that occurs most frequently. Definition of Mean – The “Mean” is the „Average‟ value of numerical data.
  • 25. Example . Class high jump heights (in metres) 1.05, 1.10, 1.05, .95, .85,1.05, 1.05,1. 20, .95, .50, .80, .65, 1.05, 1.10,.95 .95, 1.25, 1.30, .75, .80, .90, 1.00, 1.1 0, 1.15, 1.25, 1.10, 1.10, 1.15 What is the mode? What is the mean?
  • 26. Answers Mode = 1.05 and 1.10 Mean = 1.00
  • 27. WALT… ..understand what the Median is and how to identify it in data.
  • 28. Definition of Median  The Median is the middle value when numbers are put in order.  To find the Median, place the numbers in numerical order and find the middle number.  If the total number of values in the sample is even, the median is calculated by finding the mean of the two values in the middle.
  • 29. Find the median… Room 19 test scores 56%, 48%, 76%, 78%, 85%, 77%, 91%, 77%, 73 %, 88%, 69%, 67%, 58%, 64%, 88%, 89%, 87%, 83%, 73%, 74%, 92%, 69%, 80%, 80%, 75%, 72 %. In order – 48%, 56%, 58%, 64%, 67%, 69%, 69%, 72%, 73 %, 73%, 74%, 75%, 76%, 77%, 77%, 78%, 80%, 80%, 83%, 85%, 87%, 88%, 88%, 89%, 91%, 92 %,
  • 30. Find the mode How many children in your family? 12 10 8 6 Quantity 4 2 0 Two Three Four Five Six
  • 31. Find the Mean . . How many children in your family? 12 10 8 6 Quantity 4 2 0 Two Three Four Five Six
  • 32. To find the mean… (10 x 2) + (10 x 3) + (5 x 4) + (3 x 5) + (1 x 6) = 91 91 ÷ 29 = 3.13 rounded to 3 Mean = 3
  • 33. Find the. median  . How many children in your family? 12 10 8 6 Quantity 4 2 0 Two Three Four Five Six
  • 34. To find the median…  Put the numbers in order… 2, 2, 2, 2, 2, 2, 2, 2, 2, 2, 3, 3, 3, 3, 3, 3, 3, 3, 3, 3, 4, 4, 4, 4, 4, 5, 5, 5, 6. The Median = 3
  • 35. Range  Range is the gap from the biggest to smallest value.  Put the numbers in order  Take the smallest number away from the largest. Class shoe sizes: 3, 5, 5, 6, 4, 3, 2, 1, 5, 6 Put in order: 1, 2, 3, 3, 4, 5, 5, 5, 6, 6 Subtract smallest from largest: 6 – 1 = 5 Range: 5
  • 36. When should you use the Mean, Mode, or Median?  Use the mean for data which is fairly evenly distributed.  Use the median for data which has extreme differences in scores.  Use the mode in categorical data where the original scores are known.