Teaching and California's future

California’s Teaching Force 2006 Key Issues and Trends The Center for the Future of Teaching and Learning and California State University, Office of the Chancellor Policy Analysis for California Education,University of California, Office of the President WestEd. This research was conducted by SRI International. It is clear from actions taken in 2006 that education is a top priority for California’s legislature and Governor. State policymakers have used increased state revenues to fund a series of initiatives aimed at strengthening the teacher workforce and improving student achievement, especially in the state’s lowest performing schools. It is within this context of persistent challenges and responsive policymaking that the Center for the Future of Teaching and Learning presents its seventh annual report on the status of the teaching profession in California . Although progress has been made in student achievement, the state is falling far short of its overall goals of having all students reach proficiency. Most startling, the achievement gap between African-American and Latino students and their white and Asian peers is not closing. In response and partly because of a favorable budget environment, state policymakers have achieved consensus in a series of legislative and budgetary initiatives targeted at the lowest performing schools and increasing teacher quality throughout the state. Impetus on both these fronts—equity and teacher quality—continues to come from the federal NCLB requirement. This report discusses current trends in the supply, demand, and distribution of teachers. It provides details on the impact of recent policy changes on the teacher development system, and highlights themes that emerge from the new policies and programs and assesses the adequacy of the state’s efforts. It also provides recommendations for next steps to ensure that the state continues to build on the efforts begun this year.

Recommended
More Related Content
Viewers also liked
Viewers also liked (9)
Similar to Teaching and California's future
Similar to Teaching and California's future (20)
More from TeamLease
More from TeamLease (11)
Recently uploaded
Recently uploaded (20)
Teaching and California's future
- 1. TEACHING AND CALIFORNIA’S FUTURE California’s Teaching Force 2006 Key Issues and Trends The Center for the Future of Teaching and Learning and California State University, Office of the Chancellor Policy Analysis for California Education University of California, Office of the President WestEd Research conducted by SRI International Suggested citation: Guha, R., Campbell, A., Humphrey, D., Shields, P., Tiffany-Morales, J., & Wechsler, M. (2006). California’s teaching force 2006: Key issues and trends. Santa Cruz, CA: The Center for the Future of Teaching and Learning. The Center for the Future of Teaching and Learning • 133 Mission Street, Suite 220 Santa Cruz, CA 95060 • (831) 427-3628 • www.cftl.org Copyright © 2006. All rights reserved.
- 3. CONTENTS Exhibits............................................................................................................................................... iii Cosponsors ...........................................................................................................................................v Task Force Members.............................................................................................................................v Advisors ...............................................................................................................................................vi Board of Directors ..............................................................................................................................vii Acknowledgements ..............................................................................................................................ix Abbreviations .......................................................................................................................................xi Chapter 1. Context of California Education..........................................................................................1 Accountability and Achievement in California..................................................................................2 Federal and State Policies to Improve Teacher Quality ....................................................................5 New State Priorities ..........................................................................................................................8 Chapter Summary ..........................................................................................................................10 Chapter 2. Teacher Supply, Demand, and Distribution ......................................................................11 Size of the Teacher Workforce........................................................................................................11 Composition of the Teacher Workforce..........................................................................................11 Distribution of Underprepared and Novice Teachers......................................................................15 A Focus on the Special Education Teacher Workforce....................................................................22 A Focus on the Science and Mathematics Teacher Workforce ........................................................24 Looking Ahead: Future Supply OF and Demand for Teachers .......................................................27 Chapter Summary ..........................................................................................................................34 Chapter 3. Strengthening the Teacher Development System...............................................................35 Teacher Recruitment, Hiring, and Compensation ..........................................................................35 Teacher Preparation........................................................................................................................38 Teacher Induction ..........................................................................................................................42 Professional Development ..............................................................................................................42 Chapter Summary ..........................................................................................................................45 Chapter 4. Conclusions.......................................................................................................................47 Chapter 5. Recommendations.............................................................................................................49 References ...........................................................................................................................................51 Appendix A. Source and Technical Information for Selected Exhibits .................................................55 Appendix B. NCLB Compliant and Noncompliant California Credentials .........................................63 The Center for the Future of Teaching and Learning California’s Teaching Force 2006 i
- 4. The Center for the Future of Teaching and Learning California’s Teaching Force 2006 ii
- 5. EXHIBITS Exhibit 1 CST Results by Ethnicity, 2003-2006...........................................................................2 Exhibit 2 CST Results by Grade and Subject, 2003-2006 ............................................................3 Exhibit 3 Improving Mathematics and Science Education in California .......................................4 Exhibit 4 CST Results for Subgroup Populations, 2003-2006 ......................................................4 Exhibit 5 NCLB Annual Proficiency Targets vs. Student Proficiency on CST ..............................5 Exhibit 6 Progress Toward Meeting Accountability Targets..........................................................6 Exhibit 7 Percent of Fully Credentialed Experienced Teachers with EL Authorization, 1999-2000 to 2005-06..................................................................................................8 Exhibit 8 Number of K-12 Teachers in the California Workforce, 1996-97 to 2005-06.............12 Exhibit 9 Number of Underprepared Teachers, 1997-98 to 2005-06 .........................................13 Exhibit 10 Number of Underprepared Teachers by Credential Type, 1999-2000 to 2005-06 ......13 Exhibit 11 Number of Novice Teachers by Credential Status, 2000-01 to 2005-06......................14 Exhibit 12 Percent of Out-of-Field High School Teachers in Core Subjects, 2005-06 ..................15 Exhibit 13 Percent Distribution of Schools by School-Level Percentage of Underprepared Teachers, 2005-06 ..............................................................................16 Exhibit 14 Top 10 California Counties by Number of Underprepared Teachers and Top 10 California Counties by Percentage of Underprepared Teachers, 2005-06 ....................16 Exhibit 15 Percent Distribution of Schools by School-Level Percentage of Novice Teachers, 2005-06 ......................................................................................................17 Exhibit 16 Percent of Underprepared Teachers in Schools in the Highest and Lowest API Achievement Quartiles, 2000-01 to 2005-06 ..............................................................18 Exhibit 17 Percent Probability of Having Had an Underprepared Teacher by API Achievement Quartiles ................................................................................................18 Exhibit 18 Percent of Underprepared and Novice Teachers by API Achievement Quartiles, 2005-06......................................................................................................19 Exhibit 19 Percent of Underprepared and Novice Teachers by School-Level Percentage of 10th-Grade Students Passing the CAHSEE, 2005-06 .............................................19 Exhibit 20 Percent of Underprepared Teachers in Schools with the Highest and Lowest Percentages of Minority Students, 2000-01 to 2005-06...................................20 Exhibit 21 Percent of Underprepared and Novice Teachers by School-Level Percentage of Minority Students, 2005-06........................................................................................21 Exhibit 22 Percent Distribution of Interns by School-Level Percentage of Minority Students, 2005-06.......................................................................................................21 The Center for the Future of Teaching and Learning California’s Teaching Force 2006 iii
- 6. Exhibit 23 Percent of Underprepared Teachers by Type of Authorization, 1999-2000 to 2005-06................................................................................................22 Exhibit 24 Percent of Underprepared First- and Second-Year Teachers, 2004-05 and 2005-06 ....23 Exhibit 25 Percent of Underprepared Special Education Teachers by School-Level Percentage of Minority Students, 2004-05 and 2005-06 .............................................23 Exhibit 26 Percent of Underprepared Mathematics and Science Teachers, 2001-02 to 2005-06...25 Exhibit 27 Percent of Underprepared First- and Second-Year Mathematics and Science Teachers, 2001-02 to 2005-06........................................................................25 Exhibit 28 Percent of Underprepared Mathematics and Science Teachers by Percentage of Minority Students in Middle and High Schools, 2001-02 to 2005-06 ........................26 Exhibit 29 Percent of Underprepared Mathematics and Science Teachers by Middle and High School API Quartiles, 2001-02 to 2005-06 .................................................26 Exhibit 30 Actual and Projected K-12 Public School Enrollment, 1990-91 to 2014-15................27 Exhibit 31 Projected K-12 Public School Enrollment Change by County, 2004 to 2014 ............28 Exhibit 32 Number of California State Teachers’ Retirement System (CalSTRS) Membership Retirements, 1995-96 to 2004-05 ...............................................................................30 Exhibit 33 Age Distribution of K-12 Public School Teachers, 2005-06........................................30 Exhibit 34 Number of Enrollees in Teacher Preparation Programs, 2000-01 to 2003-04 .............31 Exhibit 35 Number of New University and District Intern Credentials Issued, 1995-96 to 2004-05....................................................................................................31 Exhibit 36 Number of New Preliminary Teaching Credentials Issued, 1997-98 to 2004-05.........33 Exhibit 37 Number of California Credentials Issued to Teachers Trained Out of State, 1999-2000 to 2004-05................................................................................................33 Exhibit 38 Discontinued and Inactive Teacher Recruitment Programs .........................................36 Exhibit 39 Key Initiatives to Improve Recruitment and Hiring ....................................................37 Exhibit 40 Examinations Required to Earn a Preliminary Credential............................................39 Exhibit 41 Performance Assessment for California Teachers.........................................................40 Exhibit 42 Key Changes to Teacher Preparation...........................................................................41 Exhibit 43 Key Changes to Teacher Induction .............................................................................42 Exhibit 44 Updates on Key Professional Development Programs..................................................44 Exhibit 45 Key Changes to Professional Development..................................................................45 Exhibit A-1 Number of Schools by API Quartiles, for API Analyses...............................................57 Exhibit A-2 Number of Schools by School-Level Minority, for Minority Analyses .........................58 Exhibit B-1 NCLB-Compliant Authorizations for Underprepared Teachers ..................................63 Exhibit B-2 NCLB Noncompliant Authorizations for Underprepared Teachers ............................64 The Center for the Future of Teaching and Learning California’s Teaching Force 2006 iv
- 7. COSPONSORS California State University, University of California, Office of the Chancellor Office of the President The Center for the Future of WestEd Teaching and Learning Policy Analysis for California Education TASK FORCE MEMBERS Co-Chair: Co-Chair: Stan Hitomi, Science and Math Coordinator Karl Pister, Chancellor Emeritus San Ramon Valley Unified School District University of California, Santa Cruz Mary Bergan, President Bob Cherry, Associate Executive Director California Federation of Teachers California Teachers Association Diane Cordero de Noriega Sandy Dean, Director Campus Administrator National Board for Professional Standards Resource California State University, Monterey Bay Center, Stanford University Jane Ching Fung, Teacher Ken Futernick, Professor of Education Alexander Science Center School California State University, Sacramento Dave Gordon, Superintendent Susan Hackwood, Executive Director Sacramento County Office of Education California Council on Science and Technology Jerry Hayward, Director Emeritus Ellen Hershey, Senior Program Officer Policy Analysis for California Education Stuart Foundation Donald Kairott, Director (Retired) Harold Levine, Dean Professional Development and School of Education Curriculum Support University of California, Davis California Department of Education Jeannie Oakes, Professor and Director Douglas Miller, Superintendent Institute for Democracy, Education, & Access Panama-Buena Vista Union School District University of California, Los Angeles Gavin Payne, Chief Deputy Superintendent Scott Plotkin, Executive Director Office of the State Superintendent California School Boards Association of Public Instruction The Center for the Future of Teaching and Learning California’s Teaching Force 2006 v
- 8. Luan Rivera, President Diane Siri, Superintendent (Retired) California School Boards Association Santa Cruz County Office of Education Richard Sterling, Executive Director William Thompson, Teacher National Writing Project Aptos High School University of California, Berkeley Jean Treiman, Executive Director Edward Valeau, President California Subject Matter Projects Hartnell Community College Aida Walqui, Director Beverly Young, Assistant Vice Chancellor Teacher Professional Development Teacher Education and Public School Programs, WestEd Programs, California State University System ADVISORS Stephen Blake, Executive Director Davis Campbell, President Governor’s Advisory Committee Governance Institute on Education Excellence California School Boards Association Linda Darling-Hammond Carolyn Ellner, President Professor of Education On the Job Parenting Stanford University School of Education Dale Janssen, Interim Executive Director Milbrey McLaughlin California Commission on Teacher Professor of Education and Public Policy Credentialing Stanford University Michael Ricketts, Deputy Executive Director John Mockler, President California County Superintendents Educational John Mockler and Associates Services Association Richard Simpson, Deputy Chief of Staff James Wilson, Chief Consultant Office of the Speaker of the Assembly Senate Committee on Education The Center for the Future of Teaching and Learning California’s Teaching Force 2006 vi
- 9. BOARD OF DIRECTORS Davis Campbell, President Ken Barker, Assistant Principal Governance Institute Sylmar High School California School Boards Association Sandy Dean, Director Jerry Hayward, Director Emeritus National Board for Professional Standards Policy Analysis for California Education Resource Center, Stanford University Stan Hitomi, Science and Math Coordinator Karl Pister, Chancellor Emeritus San Ramon Valley Unified School District University of California, Santa Cruz Guillermo Rodriguez, Jr., Consultant John Sugiyama, Superintendent Emeritus Pacific Gas & Electric External Relations Dublin School District Aida Walqui, Director Bill Wilson, Assistant Vice Chancellor Teacher Professional Development California State University, Programs, WestEd Office of the Chancellor Victor Young, President The Center for Collaboration and the Future of Schooling The Center for the Future of Teaching and Learning California’s Teaching Force 2006 vii
- 10. The Center for the Future of Teaching and Learning California’s Teaching Force 2006 viii
- 11. ACKNOWLEDGMENTS The SRI International research team consisted of Ashley Campbell, Roneeta Guha, Paul Hu, Daniel Humphrey, Debbie Kim, Patrick Shields, Juliet Tiffany-Morales, and Marjorie Wechsler. We would like to thank the following individuals for their contributions to the editing and production of this report: Eileen Behr, Alix Gallagher, Klaus Krause, June Park, Michael Smith, and the SRI Graphics Services team led by Kathy Wright. In addition, we would like to extend our appreciation to the Teaching and California’s Future Cosponsors, Task Force Members, Advisors, and The Center for the Future of Teaching and Learning’s Board of Directors for their insights and suggestions throughout the development of this report. The Center for the Future of Teaching and Learning California’s Teaching Force 2006 ix
- 12. The Center for the Future of Teaching and Learning California’s Teaching Force 2006 x
- 13. ABBREVIATIONS AB Assembly Bill API Academic Performance Index APLE Assumption Program of Loans for Education AYP Adequate Yearly Progress BCLAD Bilingual, Crosscultural, Language and Academic Development BTSA Beginning Teacher Support and Assessment CAHSEE California High School Exit Examination CalSTRS California State Teachers’ Retirement System CalTeach California Center for Teaching Careers CALTIDES California Longitudinal Teacher Integrated Data Education System CaMSP California Mathematics and Science Partnership Program CBEDS California Basic Educational Data System CBEST California Basic Educational Skills Test CCC California Community Colleges CCST California Council on Science and Technology CCTC California Commission on Teacher Credentialing CDE California Department of Education CDOF California Department of Finance CFASST California Formative Assessment and Support System for Teachers CMIT California Mathematics Initiative for Teaching CSAC California Student Aid Commission CSET California Subject Examination for Teachers CSM Certificated Staff Mentoring CSMP California Subject Matter Projects CST California Standards Test CSTP California Standards for the Teaching Profession CSU California State University CTA California Teachers Association EIA Economic Impact Aid EL English Learner ELD English Language Development ESEA Elementary and Secondary Education Act The Center for the Future of Teaching and Learning California’s Teaching Force 2006 xi
- 14. GRE Graduate Record Examination ITSDR Instructional Time and Staff Development Reform LAO Legislative Analyst’s Office NCLB No Child Left Behind Act PACT Performance Assessment for California Teachers PAIF Professional Assignment Information Form PAR Peer Assistance and Review PMAT Personnel Management Assistance Team PTTP Paraprofessional Teacher Training Program QEIA Quality Education Investment Act RICA Reading Instruction Competence Assessment SAT Scholastic Aptitude Test SB Senate Bill SDAIE Specially Designed Academic Instruction in English SIF School Information Form STAR Standardized Testing and Reporting TAP Teaching as a Priority TCF Teaching and California’s Future TPA Teacher Performance Assessment TPE Teacher Performance Expectation TRIP Teacher Recruitment Incentive Program UC University of California The Center for the Future of Teaching and Learning California’s Teaching Force 2006 xii
- 15. CHAPTER 1 CONTEXT OF CALIFORNIA EDUCATION It is clear from actions taken in 2006 that education is has a qualified teacher. Although California has made a top priority for California’s legislature and Governor. significant gains in reducing the number of State policymakers have used increased state revenues underprepared teachers, thousands of classrooms to fund a series of initiatives aimed at strengthening continue to be staffed by teachers who fail to meet the teacher workforce and improving student minimum state and federal teacher quality achievement, especially in the state’s lowest requirements. performing schools. The 2006-07 state budget It is within this context of persistent challenges and includes $49.1 billion in Proposition 98 funds (the responsive policymaking that the Center for the state’s minimum-funding guarantee) for K-12 Future of Teaching and Learning presents its seventh programs, an increase of $4.5 billion over the 2005-06 annual report on the status of the teaching profession enacted budget. Alongside the increased funding, new in California.1 These reports, part of the Center’s legislation seeks to increase the state’s focus on equity Teaching and California’s Future (TCF) initiative, are “California by targeting additional resources at the lowest meant to provide California policymakers with achieving schools, and to strengthen the teaching educators and objective and timely data on the state’s teacher profession by supporting the recruitment of new workforce. In fact, many core components of this policymakers face teachers, streamlining the credentialing process, year’s legislation stem from the findings and formidable strengthening teacher preparation, and providing recommendations of previous reports. TCF has five greater support for both new and experienced teachers. challenges in their central goals: Of particular note are the omnibus teacher workforce quest to ensure that (1) Every student will have a fully prepared and bill authored by Senator Jack Scott (Senate Bill [SB] all students meet effective teacher. 1209, Chapter 517, Statutes of 2006) and the Quality the state’s high Education Investment Act authored by Senator Tom (2) Every district will be able to attract and retain Torlakson (SB 1133, Chapter 751, Statutes of 2006), fully qualified, effective teachers. achievement which implements the settlement agreement between (3) Every teacher will work in a safe, clean facility standards.” the California Teachers Association (CTA) and the conducive to learning; have adequate materials Governor. with which to teach; and have the guidance and support of a capable leader. The increased funding and legislation are warranted. California educators and policymakers face formidable (4) Every pathway into teaching will provide high- challenges in their quest to ensure that all students quality preparation and be based on California’s meet the state’s high achievement standards, as well as standards for what students should know and be the No Child Left Behind target of 100% of students able to do. proficient in mathematics and English-language arts (5) Every teacher will receive high-quality support as by 2013-14. Currently, fewer than half of California he or she begins teaching, as well as continuing students reach or exceed the proficiency level on state professional development, to ensure that he or she assessments. More troubling, the achievement gap stays current in his or her field. persists between Latino and African-American Research for the reports is conducted by a team at SRI students on the one hand, and white and Asian International, an independent research and consulting students on the other. While well-prepared and organization. This year’s report is based on secondary effective teachers are key to improving student achievement, the state also continues to confront 1 Copies of previous years’ reports can be found at The Center for challenges in its efforts to ensure that every classroom the Future of Teaching and Learning’s Web site: www.cftl.org. The Center for the Future of Teaching and Learning California’s Teaching Force 2006 1
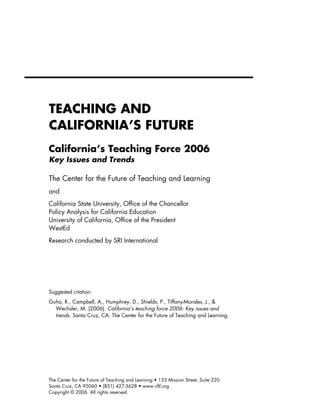
- 16. Exhibit 1 CST Results by Ethnicity, 2003-2006 Mathematics English 100 100 Percent proficient and above Percent proficient and above 80 80 67 64 60 60 55 60 60 53 53 47 40 42 40 40 35 35 30 29 23 22 20 24 20 27 19 20 0 0 2003 2004 2005 2006 2003 2004 2005 2006 A sian White A sian White A ll students Latino A ll students A frican-A merican Latino A frican-A merican (Source: CDE, 2006a) 35% to 42% in English-language arts and from 35% analyses of state teacher databases, reviews of legislative to 40% in mathematics (California Department of and budget documents, and interviews with Education [CDE], 2006a). Despite this overall administrators of the state’s major teacher develop- improvement, the achievement gap between African- ment programs. In the remainder of this first chapter, American and Latino students and their white and we review student achievement trends in the state and Asian peers persists and in fact has grown a bit wider then provide an overview of federal and state policies, (see Exhibit 1). In 2006, only 27% of Latino students including highlights from this year’s budget and were proficient or above on the English-language arts legislation. CST, and only 30% were proficient or above on the mathematics CST. Likewise, just 29% of African- ACCOUNTABILITY AND ACHIEVEMENT IN “. . . the American students were proficient or above in CALIFORNIA English-language arts, and only 24% were proficient achievement gap During the 1990s, California policymakers adopted a or above in mathematics. In contrast, 60% of white between African- set of ambitious standards for what the state’s public students and 64% of Asian students were proficient or American and schoolchildren should know and be able to do across above in English-language arts. In mathematics, the the content areas. These standards are backed up by a numbers were 53% and 67% for white and Asian Latino students comprehensive system, based on both state and federal students, respectively (CDE, 2006a). and their white requirements, that seeks to hold schools, teachers, and Similar patterns of limited progress combined with a and Asian peers students accountable for results. The system includes persistent achievement gap can be seen across most the state’s Academic Performance Index (API) persists and in fact grades and subject areas—although elementary established by the Public Schools Accountability Act has grown a bit students perform appreciably better than their of 1999; the federal Adequate Yearly Progress (AYP) counterparts in middle school and high school (see wider.” requirements established by the No Child Left Behind Exhibit 2). For example, in 2006, 54% of fourth Act of 2001 (NCLB); and, for students, the California graders were proficient or above in mathematics, but High School Exit Examination (CAHSEE), which only 23% of secondary students were proficient or went into effect for the Class of 2006.2 above on the Algebra I CST.3 Moreover, the Since the new standards and accountability systems have been in place, student achievement has improved 3 Students take grade-level CSTs in mathematics from grades 2 modestly. Between 2003 and 2006, the percentage of through 7 that are aligned to the state’s mathematics content students across the state scoring proficient or above on standards. Because the mathematics standards for grades 8 through 12 are organized by discipline, such as algebra and geometry, and the California Standards Tests (CSTs) increased from not by grade level, students take a discipline-specific mathematics CST. The general mathematics test is administered to students in 2 See http://www.cde.ca.gov/ta/ac/ay/documents/overview06.pdf for grades 8 and 9 who are not enrolled in a discipline-specific an overview of California’s accountability progress reporting system. mathematics course. The Center for the Future of Teaching and Learning California’s Teaching Force 2006 2
- 17. Exhibit 2 CST Results by Grade and Subject, 2003-2006 Mathematics English 100 100 Percent proficient and above Percent proficient and above 80 80 50 54 60 60 47 50 45 45 39 41 39 39 32 32 36 36 31 33 40 40 21 18 19 23 20 20 22 22 20 20 0 0 Fourth grade General math Algebra I Fourth grade Eighth grade Elev enth grade 2003 2004 2005 2006 2003 2004 2005 2006 (Source: CDE, 2006a) percentages of students who reached the proficient scoring proficient or above on the CST were level in Algebra I varied widely across racial groups: considerably lower than for the state as a whole (CDE, African-American students (11%), Latino students 2006a). Only about one-quarter of economically (14%), white students (33%), and Asian students disadvantaged students were proficient or above on the (53%) (CDE, 2006b). Nonetheless, more eighth English-language arts CST, and even fewer ELs and graders are taking Algebra I than ever before. In 1999, students receiving special education services were the first year the Algebra I CST was administered, just proficient or above—14% and 13%, respectively, 70,000, or 16% of eighth-grade students, took that compared with 42% of all students. The results in “Similar patterns test. By 2006, that number had increased by more mathematics were similar, with only 30% of than three-fold to exceed 230,000, or 47% of eighth of limited progress economically disadvantaged students, 25% of ELs, and graders (CDE, 2006b). 16% of students receiving special education services combined with a scoring proficient or above, compared with 40% of all The fifth- and eighth-grade science tests provide persistent students (see Exhibit 4). another example of these achievement patterns. On achievement gap the fifth-grade science CST, just 32% of students were How do these results accord with the targets in the proficient or above. Statewide, students performed can be seen across various accountability systems? In the state’s better on the eighth-grade science CST—38% were accountability system, schools are given a composite most grades and proficient or above. However, the gaps among racial score, the API, ranging from 200 to 1000, based on subject areas.” groups were much larger for the eighth-grade test, their students’ scores across grade levels and subject ranging from 21% proficient or above among African- areas.4 Each year, schools are given a growth target American students to 65% proficient or above among meant to put them on a trajectory to meet the Asian students. White students and Latino students statewide target of 800. Currently, the state’s average were at 55% and 23%, respectively (CDE, 2006b). API score is 720. Statewide, in 2005-06, just 52% of Student performance in mathematics and science is schools met their API growth targets—58% of particularly troubling in light of recent publicity elementary schools, 43% of middle schools, and 36% regarding the country’s need for improved education of high schools (CDE, 2006c). in the two fields to compete in today’s global economy (see Exhibit 3). An examination of California’s subgroup populations also shows modest improvements but great disparities in achievement. The percentages of economically disadvantaged students, of students receiving special education services, and of English learners (ELs) 4 The weight given to the various scores differs between grades 2-8 and grades 9-12. The Center for the Future of Teaching and Learning California’s Teaching Force 2006 3
- 18. Exhibit 3 Improving Mathematics and Science Education in California In its highly publicized report, Rising Above the Gathering Storm, the Committee on Prospering in the Global Economy of the 21st Century, established by the National Academies, targeted one of its four central recommendations on the improvement of K-12 mathematics and science education (National Academies Committee on Science, Engineering, and Public Policy, 2006). Specifically, the Committee recommended awarding 4-year scholarships as a means to annually recruit 10,000 science and mathematics teachers, and increasing the number of students who take Advanced Placement and International Baccalaureate science and mathematics examinations to increase the pipeline of students who are prepared to enter college and graduate with degrees in those fields. It also recommended strengthening the skills of 250,000 current teachers through summer institutes, master’s degree programs, and training to teach Advanced Placement and International Baccalaureate courses. The recommendations were implemented in the Protecting America’s Competitive Edge Act, a package of three bills introduced in Congress, and are reflected in President Bush’s 2006 American Competitiveness Initiative. In response to the National Academies report, Governor Arnold Schwarzenegger requested the California Council on Science and Technology (CCST), a nonpartisan, not-for-profit organization, to assist the state in its efforts to ensure continued economic prosperity. CCST has established four industry-led task forces to identify concrete actions that can be taken by the business, government, research, and higher education communities to increase California’s talent pool and research base and improve its business climate. The work of the task forces is scheduled to be completed in late 2006.5 Exhibit 4 CST Results for Subgroup Populations, 2003-2006 Mathematics English Percent proficient and above Percent proficient and above 50 50 42 40 40 40 35 35 30 30 30 27 24 25 20 20 20 20 14 16 13 10 10 13 10 9 0 0 2003 2004 2005 2006 2003 2004 2005 2006 A ll students A ll students Eco no mically disadvantaged students Eco no mically disadvantaged students Students receiving special educatio n services Students receiving special educatio n services English learners English learners (Source: CDE, 2006a) The federal accountability system under NCLB varies the goals in mathematics and reading increase by significantly from the state system in that it requires about 11% annually until they reach 100%. schools to reach absolute achievement targets each The goals for high schools are similar. Importantly, year—or AYP—as opposed to the growth targets in schools must meet these targets for their overall the state system. States must set annual AYP targets for student population, as well as for ethnic minorities, school and district performance that lead to 100% economically disadvantaged students, and students proficiency in mathematics and reading by the 2013- receiving special education services. Recent data 14 school year. For example, from 2004-05 to 2006- indicate that 65% of all schools statewide met AYP 07, California’s AYP goal for elementary and middle requirements (CDE, 2006c). But 2,200 schools—a schools is 26.5% proficiency in mathematics and quarter of all schools in the state—that receive federal 24.4% in reading. From 2007-08 through 2013-14, Title I funds have missed their AYP targets for 2 or more consecutive years and face various sanctions. Further, the state's current achievement trajectories in 5 See http://www.ccst.us/index.php for more information on CCST. The Center for the Future of Teaching and Learning California’s Teaching Force 2006 4
- 19. Exhibit 5 NCLB Annual Proficiency Targets vs. Student Proficiency on CST Mathematics English 100 100 Percent proficient and above Percent proficient and above 80 80 60 60 40 40 20 20 0 0 2001 2003-042005-062007-08 2009-1 201 -1 201 4 -02 0 12 3-1 2001 2003-042005-062007-08 2009-1 201 -1 201 4 -02 0 12 3-1 Federal Target (Elementary/Middle) Federal Target (Elementary/Middle) Federal Target (High) Federal Target (High) Asian Asian White White All students All students African-American African-American Latino Latino (Source: CDE, 2006a; U.S. Department of Education, n.d.) widened (see Exhibit 6). Less than a quarter of mathematics and English, particularly for Latino and students were proficient in Algebra I, a requirement African-American students, suggest that California is for high school graduation, and fewer than half of the not going to reach the 100% proficiency goal by students tested were proficient in science. Almost one- 2013-14 (see Exhibit 5). half of schools did not reach their API growth targets While public schools face greater accountability than under the state accountability system, almost one-third ever before for producing gains in student did not meet AYP under the federal accountability achievement, students themselves are also being held system, and California is not positioned to meet the to higher expectations. Nowhere is this more apparent 100% proficiency goal by 2014. Further, nearly 10% than in the debate this year over the CAHSEE. of students in the Class of 2006 were denied diplomas California, like 24 other states across the nation, because they could not pass the CAHSEE; most of requires students to pass a basic competency test in these were minority students. mathematics and English-language arts content to FEDERAL AND STATE POLICIES TO receive a diploma (Kober, Zabala, Chudowsky, IMPROVE TEACHER QUALITY Chudowsky, Gayler, et al., 2006). Despite court battles over the legality of the CAHSEE, it went into Given the high hurdles the state must surmount to effect for the Class of 2006, the first group of high improve student achievement and the short timeframe school students required to pass the test to graduate. for reaching federal goals, the need for well-prepared An estimated 40,000 seniors, or approximately 9% of and effective teachers is urgent, particularly so in the Class of 2006, did not pass the CAHSEE; 25,000 schools where students are not meeting achievement or 62% of these students were Latino. Passage rates goals. Both federal and state policies have provisions were much lower for Latino (85%) and African- that acknowledge the importance of high-quality American (83%) students, economically disadvantaged teachers. students (86%), and ELs (77%) than for white (97%) No Child Left Behind and “Highly and Asian (95%) students (CDE, 2006d).6 Qualified” Teachers In sum, although achievement on the CST has NCLB shone a national spotlight on teacher quality by improved, a majority of California’s students have not requiring that all teachers of core academic subjects be reached proficiency, and the achievement gap has “highly qualified” by the end of the 2005-06 school year. Consistent with a growing body of research (Cochran-Smith & Zeichner, 2005; Wilson, Floden, 6 SB 517 exempted certain students with disabilities from the & Ferrini-Mundy, 2001), the legislation emphasizes requirement of passing the CAHSEE to be eligible for a diploma. teacher quality as a major factor in improving the The delayed requirement is in effect for 1 year only and applies to students who were on a diploma track for graduation in 2006. The Center for the Future of Teaching and Learning California’s Teaching Force 2006 5
- 20. Exhibit 6 Progress Toward Meeting Accountability Targets Student-level Accountability Indicators Percent of Students Reaching 100% Proficiency English-language arts CST 42 Mathematics CST 30 Algebra I CST 23 Fifth-grade science CST 32 Eighth-grade science CST 38 CAHSEE 91 (passing rate) School-level Accountability Indicators Percent of Schools Reaching Target API growth target 52 AYP 65 (Source: CDE, 2006a, 2006b, 2006c) achievement of all students. In response to NCLB, provision, which mandates that states “ensure that California defined teachers as “highly qualified” if they poor and minority children are not taught at higher (1) hold a bachelor’s degree; (2) have a teaching rates than other children by inexperienced, unqualified or out-of-field teachers.”9 Unlike the “highly qualified” credential or are working toward one through an alternative preparation program; and (3) have teacher provisions, which require states to report the demonstrated subject-matter competency in each distribution of highly qualified teachers by school- assigned subject.7 The NCLB requirements are more poverty levels (i.e., whether poor students are more stringent for secondary special education teachers: they likely than their more affluent peers to be taught by must hold a special education credential and teachers who are not highly qualified), the equity demonstrate subject-matter competency in each core provision requires states to report on (1) whether minority students are disproportionately taught by subject they teach. unqualified teachers, and (2) whether both poor and States were required to develop a plan identifying minority students are disproportionately taught by annual, measurable objectives to meet the “highly inexperienced teachers.10 qualified” teacher goal. However, by the end of the 2005-06 school year, no states, including California, A peer review panel concluded that California’s revised had met the deadline for putting a highly qualified plan, submitted in July 2006, was deficient in a teacher in every core-subject classroom. Although number of areas, including its plan to address the California has made progress toward meeting the goal inequitable distribution of qualified and experienced of having all teachers highly qualified, approximately teachers.11 The federal government concurred with the 8,000 teachers in 2005-06 were teaching with panel’s findings, noting that California had not emergency permits, waivers, or pre-intern certificates adequately explained its plan to and would not be deemed highly qualified under reach the goal of having all classes in core NCLB.8 academic subjects taught by highly qualified Recognizing that states would not meet the 2005-06 teachers by the end of the 2006-07 school year, deadline, the U.S. Department of Education requested that all states submit a revised plan explaining steps to 9 See the Elementary and Secondary Education Act (ESEA) reach the highly qualified goal by the end of the §1111(b)(8)(C). 2006-07 school year. In addition, the revised plans 10 The focus on inexperienced teachers comes from research showing were required to address NCLB’s “teacher equity” that teachers in their first years of teaching are less effective than their veteran peers. See, for example, Hanushek, Kain, O’Brien, and Rikvin (2005). 7 11 See Appendix B for a list of NCLB-compliant and noncompliant A recent review of state equity plans by The Education Trust credentials. (2006) found that only two states, Nevada and Ohio, have provided 8 SRI analysis of California Basic Educational Data System meaningful and measurable goals for achieving the “teacher equity” (CBEDS) data. provision. The Center for the Future of Teaching and Learning California’s Teaching Force 2006 6
- 21. and [ensure] that poor and minority children teaching assignments for which they hold the will be taught at the same rates as other appropriate credentials or certificates. More children by highly qualified and experienced specifically, the settlement legislation: teachers (Johnson, 2006, p. 2). • Requires county superintendents to monitor teacher The state submitted a revised plan in September 2006 assignments more frequently (annually in low- that attempts to correct the deficiencies identified by performing schools), report new data on teachers of the peer reviewers. In addition, CDE is providing ELs, and address hiring and retention practices. targeted technical assistance throughout the year to • Empowers fiscal crisis and management assistance more than 1,700 schools to help them meet the highly teams to assist districts that fall short of teacher qualified teacher goal by the end of the 2006-07 quality goals. school year (CDE, 2006e). • Streamlines procedures for credentialing teachers Despite these efforts, it is uncertain whether the state prepared in other states (including waiving the can meet the new deadline, given the thousands of California Basic Educational Skills Test [CBEST] teachers who still lack the appropriate credentials. and fifth-year program, if the applicant has Under NCLB, districts that do not make progress completed comparable training in another state). toward meeting annual, measurable objectives for 2 • Requires that the Principal Training Program (AB consecutive years must develop an “improvement 75) include training on monitoring and addressing plan” for increasing the percentage of highly qualified teacher quality. teachers; after 3 consecutive years, the state must enter The settlement legislation also established statutory into agreements with districts on the use of federal definitions for teacher “misassignments” and teacher Title II funds and develop professional development “vacancies,” and created new accountability strategies for districts to use in meeting the state’s mechanisms through the Uniform Complaint Process, annual, measurable objectives.12 School Accountability Report Cards, and the The Williams v. California Settlement assignment monitoring process to ensure that all students are taught by qualified teachers.14 Parents, Teacher quality was also one of the issues raised by the students, and community members can file complaints recent Williams v. State of California case, which regarding teacher misassignments and vacancies highlighted the inequitable conditions in many of through the new Uniform Complaint Process, and California’s public schools. The landmark case, which districts must now report teacher misassignments and was settled in August 2004, focused primarily on vacancies on School Accountability Report Cards. In textbooks, school facilities, and teachers. To addition, county superintendents must annually implement the terms of the settlement, state legislators review and correct teacher misassignments in schools passed multiple bills requiring that all students have ranked in deciles 1-3 on the 2003 base API. instructional materials to use in class and at home, clean and safe schools, and qualified teachers.13 In 2005, two omnibus education clean-up bills, AB 831 (Chapter 118, Statutes of 2005) and SB 512 With respect to teacher quality, the settlement (Chapter 677, Statutes of 2005), amended the statutes agreement reiterated California’s established that implemented the settlement. Specifically, the commitment to meeting the NCLB requirement that clean-up legislation: (1) clarified that the definition of all teachers must be “highly qualified” by the end of teacher misassignment includes teachers who lack EL the 2005-06 school year, and the implementing authorization but have at least one EL in the class; (2) legislation expanded the state’s existing assignment allows county superintendents to monitor and review monitoring process to ensure that all teachers have teacher assignments in schools ranked in deciles 1-3 on the 2003 base API on the typical 4-year cycle rather 12 For more information, see the NCLB Teacher Requirements than annually if the county superintendent finds that Resource Guide on the CDE Web site: http://www.cde.ca.gov/nclb/sr/tq/documents/nclbresourceguide.pdf. 13 14 The following bills implemented the settlement legislation: SB 6 A “‘misassignment’ means the placement of a certificated (Chapter 899, Statutes of 2004); SB 550 (Chapter 900, Statutes of employee in a teaching or services position for which the employee 2004); Assembly Bill (AB) 1550 (Chapter 901, Statutes of 2004); does not hold a legally recognized certificate or credential or the AB 3001 (Chapter 902, Statutes of 2004); and AB 2727 (Chapter placement of a certificated employee in a teaching or services 903, Statutes of 2004). See http://www.decentschools.org/index.php position that the employee is not otherwise authorized by statute to for more information on the Williams settlement. hold” (California Education Code §35186). The Center for the Future of Teaching and Learning California’s Teaching Force 2006 7
- 22. Exhibit 7 Percent of Fully Credentialed Experienced Teachers with EL Authorization, 1999-2000 to 2005-06 100 80 Percent of teachers 56 60 48 44 41 38 40 34 29 20 0 1999-2000 2000-01 2001-02 2002-03 2003-04 2004-05 2005-06 Note: “Experienced” teachers are those with more than 5 years of teaching experience. (Source: See Appendix A for source and technical information.) the school had no teacher misassignments or vacancies authorization” (Allen, 2005, p. 6). The report noted for 2 consecutive years (unless the school is likely to an upsurge in the number of veteran teachers seeking have problems with teacher misassignments and EL training and a greater awareness of the requirement vacancies, given past experience or other information); that teachers must hold the appropriate authorization “Among the most and (3) requires the California Commission on if even one student in a class requires EL services. evident results of Teacher Credentialing (CCTC) to provide additional NEW STATE PRIORITIES the Williams teacher certification data at the state, county, and In addition to the more established policies of NCLB district levels in its annual teacher supply report. settlement to date and the Williams settlement, California has invested Although county offices must report the results of the is the marked new monies and passed new legislation to improve assignment monitoring process to CCTC and CDE by increase in the teacher quality and student achievement. After July 1 of each year, data collected during the 2004-05 multiple years of state budget reductions, the 2006-07 and 2005-06 school years have not been released to number of teachers budget finally contains additional resources to address the public. with EL some of the state’s pressing educational challenges. Among the most evident results of the Williams authorization.” With more money available due to a stronger settlement to date is the marked increase in the economy and unanticipated growth in state revenues, number of teachers with EL authorization. Between combined with a consensus in the education 2004-05 and 2005-06, the first 2 years of settlement community, policymakers have both the necessary implementation, the percentage of veteran teachers fiscal and political capital to redouble efforts to (those with more than 5 years of experience) with EL improve teacher quality. authorization rose from 48% to 56% (see Exhibit 7).15 The results are notable: the state is investing A 2005 report on the first year of implementation substantial new funds in K-12 education and has suggests that these numbers may be attributable to passed a series of bills targeted at improving teaching county superintendent monitoring and correction and learning throughout the state. The 2006-07 efforts. The report found that “county superintendents budget package includes $67.1 billion in total K-12 identified hundreds of schools and tens of thousands funding, including $49.1 billion in Proposition 98 of classes in which teachers were teaching English funds, the state’s minimum-funding guarantee for Language Learners without the required training or education. In all, the budget contains $7 billion in new state funding for K-12 education—$4.5 billion 15 SRI analysis of CBEDS data. The Center for the Future of Teaching and Learning California’s Teaching Force 2006 8