SlideShare a Scribd company logo
1 of 15
HATCO
REGRESSION (ENTER)


                               Model Summary

Model             R          R Square       Adjusted R               Std. Error of the
                                              Square                    Estimate
                         a
1                 .895            .801                 .784                       .3979

a. Predictors: (Constant), Usage Level, Price Level, Salesforce Image,
Product Quality, Price Flexibility, Manufacturer Image, Delivery Speed,
Service


                                                             a
                                                  ANOVA

Model                         Sum of Squares           df              Mean Square             F            Sig.
                                                                                                                     b
          Regression                     58.060                  8                7.257       45.843          .000

1         Residual                       14.406             91                      .158

          Total                          72.466             99

a. Dependent Variable: Satisfaction Level
b. Predictors: (Constant), Usage Level, Price Level, Sales force Image, Product Quality, Price
Flexibility, Manufacturer Image, Delivery Speed, Service

                                                                              a
                                                            Coefficients

Model                                Unstandardized                       Standardized              t       Sig.         Collinearity
                                      Coefficients                         Coefficients                                   Statistics

                                 B          Std. Error                         Beta                                Tolerance           VIF

                                                                                                        -
    (Constant)                   -.575                .458                                                  .212
                                                                                                   1.257

    Delivery Speed                .240                .181                                 .370    1.326 .188              .028   35.747

    Price Level                   .176                .188                                 .245     .933 .353              .032   31.636

    Price Flexibility             .293                .049                                 .474    6.018 .000              .352        2.844
1
    Manufacturer
                                  .428                .060                                 .567    7.144 .000              .347        2.880
    Image

    Service                       .139                .361                                 .122     .384 .702              .022   46.008

                                                                                                        -
    Salesforce Image             -.195                .086                                 -.176            .026           .364        2.751
                                                                                                   2.268
-
  Product Quality           -.046           .032   -.084           .164   .606   1.651
                                                           1.404

  Usage Level               -.001           .009   -.009   -.088 .930     .225   4.443

a. Dependent Variable: Satisfaction Level
REGRESSION(STEPWISE)

                              Model Summary

Model           R           R Square     Adjusted R       Std. Error of the
                                          Square             Estimate
                        a
1                .711            .505              .500              .6049
                        b
2                .781            .611              .603              .5393
                        c
3                .830            .689              .679              .4848
                        d
4                .857            .735              .724              .4496
                        e
5                .885            .784              .772              .4082
                        f
6                .885            .783              .774              .4070
                        g
7                .892            .795              .785              .3971

a. Predictors: (Constant), Usage Level
b. Predictors: (Constant), Usage Level, Manufacturer Image
c. Predictors: (Constant), Usage Level, Manufacturer Image, Delivery
Speed
d. Predictors: (Constant), Usage Level, Manufacturer Image, Delivery
Speed, Price Flexibility
e. Predictors: (Constant), Usage Level, Manufacturer Image, Delivery
Speed, Price Flexibility, Service
f. Predictors: (Constant), Manufacturer Image, Delivery Speed, Price
Flexibility, Service


g. Predictors: (Constant), Manufacturer Image, Delivery Speed, Price
Flexibility, Service, Salesforce Image
a
                                                Coefficients

Model                       Unstandardized             Standardized              t    Sig.      Collinearity
                             Coefficients               Coefficients                             Statistics

                        B          Std. Error              Beta                              Tolerance        VIF

    (Constant)          1.653                .318                              5.203 .000
1
    Usage Level          .068                .007                      .711 10.001 .000          1.000    1.000
    (Constant)           .658                .343                              1.916 .058
    Usage Level          .061                .006                      .636    9.782 .000          .950   1.053
2
    Manufacturer
                         .252                .049                      .333    5.128 .000          .950   1.053
    Image
    (Constant)           .800                .310                              2.583 .011
    Usage Level          .035                .008                      .368    4.593 .000          .506   1.976
3 Manufacturer
                         .283                .045                      .374    6.339 .000          .931   1.074
    Image
    Delivery Speed       .248                .051                      .383    4.904 .000          .532   1.881
    (Constant)          -.100                .362                               -.276 .783
    Usage Level          .022                .008                      .236    2.908 .005          .425   2.352
    Manufacturer
4                        .332                .043                      .439    7.700 .000          .859   1.164
    Image
    Delivery Speed       .213                .048                      .328    4.454 .000          .514   1.946
    Price Flexibility    .171                .042                      .277    4.080 .000          .605   1.652
    (Constant)          -.784                .361                              -2.172 .032
    Usage Level         -.006                .009                      -.067    -.676 .501         .237   4.222
    Manufacturer
                         .314                .039                      .415    7.979 .000          .851   1.176
5 Image
    Delivery Speed       .106                .049                      .163    2.146 .034          .399   2.506
    Price Flexibility    .308                .048                      .499    6.378 .000          .375   2.664
    Service              .480                .104                      .421    4.608 .000          .275   3.633
    (Constant)          -.743                .355                              -2.093 .039
    Manufacturer
                         .309                .039                      .408    8.015 .000          .881   1.135
    Image
6
    Delivery Speed       .104                .049                      .161    2.125 .036          .400   2.501
    Price Flexibility    .287                .037                      .465    7.800 .000          .643   1.555
    Service              .433                .077                      .380    5.587 .000          .494   2.023
    (Constant)          -.824                .348                              -2.371 .020

    Manufacturer
7                        .419                .059                      .555    7.071 .000          .354   2.827
    Image
    Delivery Speed       .106                .048                      .164    2.226 .028          .400   2.502
Price Flexibility         .293            .036   .474    8.134 .000    .640   1.561

     Service                   .430            .076   .378    5.692 .000    .494   2.024

     Salesforce Image         -.204            .085   -.184   -2.411 .018   .375   2.665

a.    Dependent Variable: Satisfaction Level
CORRELATION


                                                            Correlations

                            Satisfactio      Deliver Price           Price        Manufactur       Servic       Salesforc Produc Usag
                             n Level           y          Leve Flexibilit          er Image          e          e Image          t           e
                                             Speed          l         y                                                        Quality Level

               Pearson
                                                     **                      **               **           **             **           **          **
               Correlatio              1      .651        .028        .525             .476         .631           .341        -.283        .711

Satisfaction   n

Level          Sig. (2-
                                               .000       .779         .000             .000         .000           .001         .004        .000
               tailed)

               N                   100          100        100            100            100         100            100          100         100
               Pearson                                          -
                                        **                       *           **                            **                          **          **
               Correlatio        .651              1 .349             .509              .050        .612            .077       -.483        .676
                                                                *
Delivery       n
Speed          Sig. (2-
                                  .000                    .000         .000             .618         .000           .446         .000        .000
               tailed)
               N                   100          100        100            100            100         100            100          100         100
               Pearson
                                                     **                      **               **           **                          **
               Correlatio         .028       -.349              1    -.487             .272         .513            .186        .470         .082
               n
Price Level
               Sig. (2-
                                  .779         .000                    .000             .006         .000           .064         .000        .418
               tailed)
               N                   100          100        100            100            100         100            100          100         100
               Pearson                                          -
                                        **           **          *                                                                     **          **
               Correlatio        .525         .509        .487               1         -.116         .067          -.034       -.448        .559
                                                                *
Price          n
Flexibility    Sig. (2-
                                  .000         .000       .000                          .250         .510           .735         .000        .000
               tailed)
               N                   100          100        100            100            100         100            100          100         100
               Pearson                                           *
                                        **
                                                          .272                                             **             **            *           *
               Correlatio        .476          .050             *
                                                                      -.116                   1     .299           .788         .200        .224
Manufactur     n
er Image       Sig. (2-
                                  .000         .618       .006         .250                          .003           .000         .046        .025
               tailed)
               N                   100          100        100            100            100         100            100          100         100
               Pearson                                           *
                                        **           **
                                                          .513                                **                           *                       **
Service        Correlatio        .631         .612              *
                                                                       .067            .299              1         .241         -.055 .701
               n
Sig. (2-
                                     .000         .000         .000              .510        .003                   .016       .586    .000
               tailed)
               N                      100          100          100              100         100         100         100        100     100
               Pearson
                                            **                                                     **           *                             *
               Correlatio           .341          .077         .186             -.034       .788        .241           1       .177    .256
Salesforce     n
Image          Sig. (2-
                                     .001         .446         .064              .735        .000        .016                  .078    .010
               tailed)
               N                      100          100          100              100         100         100         100        100     100
               Pearson                                                *
                                            **            **
                                                               .470                    **           *
               Correlatio           -.283        -.483            *
                                                                               -.448        .200        -.055       .177          1    -.192
Product        n
Quality        Sig. (2-
                                     .004         .000         .000              .000        .046        .586       .078               .055
               tailed)
               N                      100          100          100              100         100         100         100        100     100
               Pearson
                                            **            **                           **           *          **          *
               Correlatio           .711         .676          .082             .559        .224        .701        .256       -.192      1

Usage          n

Level          Sig. (2-
                                     .000         .000         .418              .000        .025        .000       .010       .055
               tailed)

               N                      100          100          100              100         100         100         100        100     100

**. Correlation is significant at the 0.01 level (2-tailed).
*. Correlation is significant at the 0.05 level (2-tailed).


FACTOR ANALYSIS
                                                      a
                    Rotated Component Matrix

                                            Component

                                1                 2                       3

Service                             .952              .191                    .127
Usage Level                         .848           -.285                      .198
Delivery Speed                      .702           -.582                      .034
Price Level                         .366              .871                    .089
Price Flexibility                   .292           -.782                  -.009
Product Quality                  -.170                .713                    .200
Salesforce Image                    .111              .053                    .941
Manufacturer Image                  .145              .154                    .915

Extraction Method: Principal Component Analysis.
Rotation Method: Varimax with Kaiser Normalization.
a. Rotation converged in 5 iterations.
HBAT
MULTIPLE REGRESSION (ENTER)

                               Model Summary

Model             R          R Square          Adjusted R             Std. Error of the
                                                Square                   Estimate
                         a
1                 .897            .804                     .774                    .5663

a. Predictors: (Constant), X18 - Delivery Speed, X8 - Technical
Support, X6 - Product Quality, X15 - New Products, X7 - E-Commerce
Activities, X10 - Advertising, X13 - Competitive Pricing, X16 - Order &
Billing, X17 - Price Flexibility, X14 - Warranty & Claims, X12 -
Salesforce Image, X9 - Complaint Resolution, X11 - Product Line


                                                                 a
                                                      ANOVA

Model                         Sum of Squares               df           Mean Square             F            Sig.
                                                                                                                      b
          Regression                    113.044                  13                8.696       27.111          .000

1         Residual                          27.584               86                  .321

          Total                         140.628                  99

a. Dependent Variable: X19 - Satisfaction
b. Predictors: (Constant), X18 - Delivery Speed, X8 - Technical Support, X6 - Product Quality,
X15 - New Products, X7 - E-Commerce Activities, X10 - Advertising, X13 - Competitive Pricing,
X16 - Order & Billing, X17 - Price Flexibility, X14 - Warranty & Claims, X12 - Salesforce Image,
X9 - Complaint Resolution, X11 - Product Line


                                                                               a
                                                                Coefficients

Model                                   Unstandardized                       Standardized            t       Sig.         Collinearity
                                            Coefficients                     Coefficients                                  Statistics

                                        B            Std. Error                    Beta                             Tolerance       VIF

                                                                                                         -
    (Constant)                      -1.336                 1.120                                             .236
                                                                                                    1.192

    X6 - Product Quality                 .377                   .053                        .442    7.161 .000              .598    1.672
1
    X7 - E-Commerce                                                                                      -
                                        -.456                   .137                        -.268            .001           .354    2.823
    Activities                                                                                      3.341
    X8 - Technical Support               .035                   .065                        .045     .542 .589              .328    3.047
X9 - Complaint
                                   .154        .104   .156    1.489 .140   .207    4.838
     Resolution

     X10 - Advertising            -.034        .063   -.033   -.548 .585   .646    1.547

     X11 - Product Line            .362        .267   .400    1.359 .178   .026   37.978

     X12 - Salesforce Image        .827        .101   .744    8.155 .000   .274    3.654

     X13 - Competitive
                                  -.047        .048   -.062   -.985 .328   .584    1.712
     Pricing

     X14 - Warranty &
                                  -.107        .126   -.074   -.852 .397   .306    3.268
     Claims

     X15 - New Products           -.003        .040   -.004   -.074 .941   .930    1.075

     X16 - Order & Billing         .143        .105   .111    1.369 .175   .344    2.909

     X17 - Price Flexibility       .238        .272   .241     .873 .385   .030   33.332

     X18 - Delivery Speed         -.249        .514   -.154   -.485 .629   .023   44.004

a.    Dependent Variable: X19 – Satisfaction
MULTIPLE REGRESSION (STEPWISE)


                              Model Summary

Model            R          R Square           Adjusted R          Std. Error of the
                                                Square                Estimate
                        a
1                .603            .364                    .357                   .9554
                        b
2                .738            .544                    .535                   .8129
                        c
3                .868            .753                    .745                   .6020
                        d
4                .879            .773                    .763                   .5802
                        e
5                .889            .791                    .780                   .5595
a. Predictors: (Constant), X9 - Complaint Resolution
b. Predictors: (Constant), X9 - Complaint Resolution, X6 - Product
Quality
c. Predictors: (Constant), X9 - Complaint Resolution, X6 - Product
Quality, X12 - Salesforce Image
d. Predictors: (Constant), X9 - Complaint Resolution, X6 - Product
Quality, X12 - Salesforce Image, X7 - E-Commerce Activities
e. Predictors: (Constant), X9 - Complaint Resolution, X6 - Product
Quality, X12 - Salesforce Image, X7 - E-Commerce Activities, X11 -
Product Line


                                                                            a
                                                            Coefficients

Model                                  Unstandardized                    Standardized             t    Sig.      Collinearity
                                         Coefficients                     Coefficients                            Statistics
                                   B              Std. Error                    Beta                          Tolerance        VIF

    (Constant)                     3.680                    .443                                8.310 .000
1 X9 - Complaint
                                        .595                .079                         .603   7.488 .000        1.000    1.000
    Resolution
    (Constant)                     1.077                    .564                                1.909 .059
    X9 - Complaint
2                                       .550                .068                         .558   8.092 .000         .989    1.011
    Resolution
    X6 - Product Quality                .364                .059                         .427   6.193 .000         .989    1.011
    (Constant)                     -1.569                   .511                                -3.069 .003
    X9 - Complaint
3                                       .433                .052                         .439   8.329 .000         .927    1.079
    Resolution
    X6 - Product Quality                .437                .044                         .512   9.861 .000         .956    1.046
X12 - Salesforce Image       .530       .059   .477   8.992 .000    .916   1.092
    (Constant)                 -1.106       .518          -2.134 .035
    X9 - Complaint
                                 .423       .050   .429   8.430 .000    .923   1.084
    Resolution
4 X6 - Product Quality           .435       .043   .509 10.177 .000     .956   1.046
    X12 - Salesforce Image       .736       .091   .663   8.074 .000    .356   2.813
    X7 - E-Commerce
                                 -.395      .137   -.232 -2.890 .005    .372   2.692
    Activities
    (Constant)                 -1.151       .500          -2.303 .023

    X9 - Complaint
                                 .319       .061   .323   5.256 .000    .588   1.701
    Resolution

    X6 - Product Quality         .369       .047   .432   7.820 .000    .728   1.373
5
    X12 - Salesforce Image       .775       .089   .697   8.711 .000    .347   2.880

    X7 - E-Commerce
                                 -.417      .132   -.245 -3.162 .002    .370   2.701
    Activities

    X11 - Product Line           .174       .061   .192   2.860 .005    .492   2.033

a. Dependent Variable: X19 - Satisfaction
CORRELATION


FACTOR ANALYSIS
                                                              a
                                Rotated Component Matrix

                                                           Component

                                    1           2             3           4          5

X18 - Delivery Speed                     .945       .024          .170        .001       .056
X9 - Complaint Resolution                .928       .078          .111        .053       .001
X16 - Order & Billing                    .869       .017          .096        .092       .022
X6 - Product Quality                     .039       .823          -.010   -.048          .054
X17 - Price Flexibility                  .490   -.758             .221    -.147          .079
X11 - Product Line                       .559       .714          -.037       .133       .008
X13 - Competitive Pricing            -.117      -.688             .223    -.232          .035
X12 - Salesforce Image                   .129   -.159             .902        .074   -.013
X7 - E-Commerce Activities               .054   -.106             .879        .038   -.103
X10 - Advertising                        .160   -.050             .722    -.071          .144
X8 - Technical Support                   .025       .102          -.023       .936   -.068
X14 - Warranty & Claims                  .099       .123          .060        .932       .057
X15 - New Products                       .051   -.001             .020    -.008          .987

Extraction Method: Principal Component Analysis.
Rotation Method: Varimax with Kaiser Normalization.
a. Rotation converged in 5 iterations.
NIKE
MULTIPLE REGRESSION(ENTER)

                                    Model Summary

Model             R            R Square         Adjusted R             Std. Error of the
                                                 Square                   Estimate
                         a
1                 .767                .588                .541                    1.164

a. Predictors: (Constant), Attitude, Intention, Preference, Awareness

                                                               a
                                                      ANOVA

Model                           Sum of Squares            df             Mean Square             F           Sig.
                                                                                                                       b
          Regression                         67.592                4              16.898         12.482         .000

1         Residual                           47.383            35                  1.354

          Total                           114.975              39

a. Dependent Variable: Loyalty
b. Predictors: (Constant), Attitude, Intention, Preference, Awareness

                                                                            a
                                                        Coefficients

Model             Unstandardized Coefficients Standardized Coefficients                      t       Sig. Collinearity Statistics

                         B             Std. Error                        Beta                               Tolerance      VIF

    (Constant)               .526                .692                                       .760 .452

    Awareness                .031                .172                                .034   .180 .858               .328   3.045

1 Preference                 .059                .156                                .055   .380 .706               .571   1.752

    Intention                .784                .117                                .757 6.728 .000                .930   1.075

    Attitude             -.034                   .166                              -.038 -.206 .838                 .339   2.948

a. Dependent Variable: Loyalty
MULTIPLE REGRESSION(STEPWISE)


                                 Model Summary

Model             R          R Square        Adjusted R               Std. Error of the
                                                Square                   Estimate
                         a
1                 .765             .585                  .574                    1.121

a. Predictors: (Constant), Intention


                                                              a
                                                    ANOVA

Model                           Sum of Squares           df             Mean Square             F            Sig.
                                                                                                                      b
          Regression                      67.222                  1              67.222         53.494         .000

1         Residual                        47.753              38                  1.257

          Total                         114.975               39

a. Dependent Variable: Loyalty
b. Predictors: (Constant), Intention


                                                                           a
                                                     Coefficients

Model             Unstandardized Coefficients Standardized Coefficients                     t       Sig. Collinearity Statistics

                      B            Std. Error                          Beta                                Tolerance      VIF

    (Constant)           .737                .483                                         1.526 .135
1
    Intention            .792                .108                                  .765 7.314 .000              1.000     1.000
a. Dependent Variable: Loyalty
CORRELATION


                                                    Correlations

                                                Loyalty        Awareness        Preference       Intention       Attitude
                                                                                                            **
                 Pearson Correlation                      1          .068             .193           .759             .081

Loyalty          Sig. (2-tailed)                                     .664             .215            .000            .604

                 N                                    44              43                43              43              43
                                                                                            **                              **
                 Pearson Correlation                .068               1             .596             .031          .790
Awareness        Sig. (2-tailed)                    .664                              .000            .846            .000
                 N                                    43              44                43              43              43
                                                                           **                                               **
                 Pearson Correlation                .193            .596                 1            .226          .601
Preference       Sig. (2-tailed)                    .215             .000                             .145            .000
                 N                                    43              43                44              43              43
                                                          **
                 Pearson Correlation               .759              .031             .226               1            .102
Intention        Sig. (2-tailed)                    .000             .846             .145                            .513
                 N                                    43              43                43              44              43
                                                                           **               **
                 Pearson Correlation                .081            .790             .601             .102                  1

Attitude         Sig. (2-tailed)                    .604             .000             .000            .513

                 N                                    43              43                43              43              44

**. Correlation is significant at the 0.01 level (2-tailed).


FACTOR ANALYSIS

                                     a
     Rotated Component Matrix

                       Component
                      1             2

Awareness                 .922       -.080
Attitude                  .914       -.023
Preference                .798           .282
Intention                 .031           .984

Extraction Method: Principal
Component Analysis.
Rotation Method: Varimax with Kaiser
Normalization.
a. Rotation converged in 3 iterations.

More Related Content

Similar to Amr

Exercise data 2_-_forecasting
Exercise data 2_-_forecastingExercise data 2_-_forecasting
Exercise data 2_-_forecastingKerfalla Kourouma
 
SPICE MODEL of 2SJ493 (Professional+BDP Model) in SPICE PARK
SPICE MODEL of 2SJ493 (Professional+BDP Model) in SPICE PARKSPICE MODEL of 2SJ493 (Professional+BDP Model) in SPICE PARK
SPICE MODEL of 2SJ493 (Professional+BDP Model) in SPICE PARKTsuyoshi Horigome
 
SPICE MODEL of TPC6103 (Standard+BDS Model) in SPICE PARK
SPICE MODEL of TPC6103 (Standard+BDS Model) in SPICE PARKSPICE MODEL of TPC6103 (Standard+BDS Model) in SPICE PARK
SPICE MODEL of TPC6103 (Standard+BDS Model) in SPICE PARKTsuyoshi Horigome
 
SPICE MODEL of 2SJ493 (Standard+BDS Model) in SPICE PARK
SPICE MODEL of 2SJ493 (Standard+BDS Model) in SPICE PARKSPICE MODEL of 2SJ493 (Standard+BDS Model) in SPICE PARK
SPICE MODEL of 2SJ493 (Standard+BDS Model) in SPICE PARKTsuyoshi Horigome
 
SPICE MODEL of 2SJ380 (Professional+BDP Model) in SPICE PARK
SPICE MODEL of 2SJ380 (Professional+BDP Model) in SPICE PARKSPICE MODEL of 2SJ380 (Professional+BDP Model) in SPICE PARK
SPICE MODEL of 2SJ380 (Professional+BDP Model) in SPICE PARKTsuyoshi Horigome
 
SPICE MODEL of TPCF8104 (Professional+BDP Model) in SPICE PARK
SPICE MODEL of TPCF8104 (Professional+BDP Model) in SPICE PARKSPICE MODEL of TPCF8104 (Professional+BDP Model) in SPICE PARK
SPICE MODEL of TPCF8104 (Professional+BDP Model) in SPICE PARKTsuyoshi Horigome
 
SPICE MODEL of 2SK3108 (Professional+BDP Model) in SPICE PARK
SPICE MODEL of 2SK3108 (Professional+BDP Model) in SPICE PARKSPICE MODEL of 2SK3108 (Professional+BDP Model) in SPICE PARK
SPICE MODEL of 2SK3108 (Professional+BDP Model) in SPICE PARKTsuyoshi Horigome
 
SPICE MODEL of 2SK3108 (Standard+BDS Model) in SPICE PARK
SPICE MODEL of 2SK3108 (Standard+BDS Model) in SPICE PARKSPICE MODEL of 2SK3108 (Standard+BDS Model) in SPICE PARK
SPICE MODEL of 2SK3108 (Standard+BDS Model) in SPICE PARKTsuyoshi Horigome
 
SPICE MODEL of 2SJ567 (Professional+BDP Model) in SPICE PARK
SPICE MODEL of 2SJ567 (Professional+BDP Model) in SPICE PARKSPICE MODEL of 2SJ567 (Professional+BDP Model) in SPICE PARK
SPICE MODEL of 2SJ567 (Professional+BDP Model) in SPICE PARKTsuyoshi Horigome
 
SPICE MODEL of SSM6K203FE (Standard+BDS Model) in SPICE PARK
SPICE MODEL of SSM6K203FE (Standard+BDS Model) in SPICE PARKSPICE MODEL of SSM6K203FE (Standard+BDS Model) in SPICE PARK
SPICE MODEL of SSM6K203FE (Standard+BDS Model) in SPICE PARKTsuyoshi Horigome
 
SPICE MODEL of 2SJ567 (Standard+BDS Model) in SPICE PARK
SPICE MODEL of 2SJ567 (Standard+BDS Model) in SPICE PARKSPICE MODEL of 2SJ567 (Standard+BDS Model) in SPICE PARK
SPICE MODEL of 2SJ567 (Standard+BDS Model) in SPICE PARKTsuyoshi Horigome
 
SPICE MODEL of 2SK2611 (Standard+BDS Model) in SPICE PARK
SPICE MODEL of 2SK2611 (Standard+BDS Model) in SPICE PARKSPICE MODEL of 2SK2611 (Standard+BDS Model) in SPICE PARK
SPICE MODEL of 2SK2611 (Standard+BDS Model) in SPICE PARKTsuyoshi Horigome
 
SPICE MODEL of TPC8A02-H (Professional+ZDSP Model) in SPICE PARK
SPICE MODEL of TPC8A02-H (Professional+ZDSP Model) in SPICE PARKSPICE MODEL of TPC8A02-H (Professional+ZDSP Model) in SPICE PARK
SPICE MODEL of TPC8A02-H (Professional+ZDSP Model) in SPICE PARKTsuyoshi Horigome
 
SPICE MODEL of 2SK3110 (Professional+BDP Model) in SPICE PARK
SPICE MODEL of 2SK3110 (Professional+BDP Model) in SPICE PARKSPICE MODEL of 2SK3110 (Professional+BDP Model) in SPICE PARK
SPICE MODEL of 2SK3110 (Professional+BDP Model) in SPICE PARKTsuyoshi Horigome
 
SPICE MODEL of 2SK3863 (Professional+BDP Model) in SPICE PARK
SPICE MODEL of 2SK3863 (Professional+BDP Model) in SPICE PARKSPICE MODEL of 2SK3863 (Professional+BDP Model) in SPICE PARK
SPICE MODEL of 2SK3863 (Professional+BDP Model) in SPICE PARKTsuyoshi Horigome
 
SPICE MODEL of TPC6004 (Standard+BDS Model) in SPICE PARK
SPICE MODEL of TPC6004 (Standard+BDS Model) in SPICE PARKSPICE MODEL of TPC6004 (Standard+BDS Model) in SPICE PARK
SPICE MODEL of TPC6004 (Standard+BDS Model) in SPICE PARKTsuyoshi Horigome
 
SPICE MODEL of TPCP8002 (Professional+BDP Model) in SPICE PARK
SPICE MODEL of TPCP8002 (Professional+BDP Model) in SPICE PARKSPICE MODEL of TPCP8002 (Professional+BDP Model) in SPICE PARK
SPICE MODEL of TPCP8002 (Professional+BDP Model) in SPICE PARKTsuyoshi Horigome
 
SPICE MODEL of 2SK3110 (Standard+BDS Model) in SPICE PARK
SPICE MODEL of 2SK3110 (Standard+BDS Model) in SPICE PARKSPICE MODEL of 2SK3110 (Standard+BDS Model) in SPICE PARK
SPICE MODEL of 2SK3110 (Standard+BDS Model) in SPICE PARKTsuyoshi Horigome
 
SPICE MODEL of 2SK3435 (Standard+BDS Model) in SPICE PARK
SPICE MODEL of 2SK3435 (Standard+BDS Model) in SPICE PARKSPICE MODEL of 2SK3435 (Standard+BDS Model) in SPICE PARK
SPICE MODEL of 2SK3435 (Standard+BDS Model) in SPICE PARKTsuyoshi Horigome
 
SPICE MODEL of TPCP8102 (Professional+BDP Model) in SPICE PARK
SPICE MODEL of TPCP8102 (Professional+BDP Model) in SPICE PARKSPICE MODEL of TPCP8102 (Professional+BDP Model) in SPICE PARK
SPICE MODEL of TPCP8102 (Professional+BDP Model) in SPICE PARKTsuyoshi Horigome
 

Similar to Amr (20)

Exercise data 2_-_forecasting
Exercise data 2_-_forecastingExercise data 2_-_forecasting
Exercise data 2_-_forecasting
 
SPICE MODEL of 2SJ493 (Professional+BDP Model) in SPICE PARK
SPICE MODEL of 2SJ493 (Professional+BDP Model) in SPICE PARKSPICE MODEL of 2SJ493 (Professional+BDP Model) in SPICE PARK
SPICE MODEL of 2SJ493 (Professional+BDP Model) in SPICE PARK
 
SPICE MODEL of TPC6103 (Standard+BDS Model) in SPICE PARK
SPICE MODEL of TPC6103 (Standard+BDS Model) in SPICE PARKSPICE MODEL of TPC6103 (Standard+BDS Model) in SPICE PARK
SPICE MODEL of TPC6103 (Standard+BDS Model) in SPICE PARK
 
SPICE MODEL of 2SJ493 (Standard+BDS Model) in SPICE PARK
SPICE MODEL of 2SJ493 (Standard+BDS Model) in SPICE PARKSPICE MODEL of 2SJ493 (Standard+BDS Model) in SPICE PARK
SPICE MODEL of 2SJ493 (Standard+BDS Model) in SPICE PARK
 
SPICE MODEL of 2SJ380 (Professional+BDP Model) in SPICE PARK
SPICE MODEL of 2SJ380 (Professional+BDP Model) in SPICE PARKSPICE MODEL of 2SJ380 (Professional+BDP Model) in SPICE PARK
SPICE MODEL of 2SJ380 (Professional+BDP Model) in SPICE PARK
 
SPICE MODEL of TPCF8104 (Professional+BDP Model) in SPICE PARK
SPICE MODEL of TPCF8104 (Professional+BDP Model) in SPICE PARKSPICE MODEL of TPCF8104 (Professional+BDP Model) in SPICE PARK
SPICE MODEL of TPCF8104 (Professional+BDP Model) in SPICE PARK
 
SPICE MODEL of 2SK3108 (Professional+BDP Model) in SPICE PARK
SPICE MODEL of 2SK3108 (Professional+BDP Model) in SPICE PARKSPICE MODEL of 2SK3108 (Professional+BDP Model) in SPICE PARK
SPICE MODEL of 2SK3108 (Professional+BDP Model) in SPICE PARK
 
SPICE MODEL of 2SK3108 (Standard+BDS Model) in SPICE PARK
SPICE MODEL of 2SK3108 (Standard+BDS Model) in SPICE PARKSPICE MODEL of 2SK3108 (Standard+BDS Model) in SPICE PARK
SPICE MODEL of 2SK3108 (Standard+BDS Model) in SPICE PARK
 
SPICE MODEL of 2SJ567 (Professional+BDP Model) in SPICE PARK
SPICE MODEL of 2SJ567 (Professional+BDP Model) in SPICE PARKSPICE MODEL of 2SJ567 (Professional+BDP Model) in SPICE PARK
SPICE MODEL of 2SJ567 (Professional+BDP Model) in SPICE PARK
 
SPICE MODEL of SSM6K203FE (Standard+BDS Model) in SPICE PARK
SPICE MODEL of SSM6K203FE (Standard+BDS Model) in SPICE PARKSPICE MODEL of SSM6K203FE (Standard+BDS Model) in SPICE PARK
SPICE MODEL of SSM6K203FE (Standard+BDS Model) in SPICE PARK
 
SPICE MODEL of 2SJ567 (Standard+BDS Model) in SPICE PARK
SPICE MODEL of 2SJ567 (Standard+BDS Model) in SPICE PARKSPICE MODEL of 2SJ567 (Standard+BDS Model) in SPICE PARK
SPICE MODEL of 2SJ567 (Standard+BDS Model) in SPICE PARK
 
SPICE MODEL of 2SK2611 (Standard+BDS Model) in SPICE PARK
SPICE MODEL of 2SK2611 (Standard+BDS Model) in SPICE PARKSPICE MODEL of 2SK2611 (Standard+BDS Model) in SPICE PARK
SPICE MODEL of 2SK2611 (Standard+BDS Model) in SPICE PARK
 
SPICE MODEL of TPC8A02-H (Professional+ZDSP Model) in SPICE PARK
SPICE MODEL of TPC8A02-H (Professional+ZDSP Model) in SPICE PARKSPICE MODEL of TPC8A02-H (Professional+ZDSP Model) in SPICE PARK
SPICE MODEL of TPC8A02-H (Professional+ZDSP Model) in SPICE PARK
 
SPICE MODEL of 2SK3110 (Professional+BDP Model) in SPICE PARK
SPICE MODEL of 2SK3110 (Professional+BDP Model) in SPICE PARKSPICE MODEL of 2SK3110 (Professional+BDP Model) in SPICE PARK
SPICE MODEL of 2SK3110 (Professional+BDP Model) in SPICE PARK
 
SPICE MODEL of 2SK3863 (Professional+BDP Model) in SPICE PARK
SPICE MODEL of 2SK3863 (Professional+BDP Model) in SPICE PARKSPICE MODEL of 2SK3863 (Professional+BDP Model) in SPICE PARK
SPICE MODEL of 2SK3863 (Professional+BDP Model) in SPICE PARK
 
SPICE MODEL of TPC6004 (Standard+BDS Model) in SPICE PARK
SPICE MODEL of TPC6004 (Standard+BDS Model) in SPICE PARKSPICE MODEL of TPC6004 (Standard+BDS Model) in SPICE PARK
SPICE MODEL of TPC6004 (Standard+BDS Model) in SPICE PARK
 
SPICE MODEL of TPCP8002 (Professional+BDP Model) in SPICE PARK
SPICE MODEL of TPCP8002 (Professional+BDP Model) in SPICE PARKSPICE MODEL of TPCP8002 (Professional+BDP Model) in SPICE PARK
SPICE MODEL of TPCP8002 (Professional+BDP Model) in SPICE PARK
 
SPICE MODEL of 2SK3110 (Standard+BDS Model) in SPICE PARK
SPICE MODEL of 2SK3110 (Standard+BDS Model) in SPICE PARKSPICE MODEL of 2SK3110 (Standard+BDS Model) in SPICE PARK
SPICE MODEL of 2SK3110 (Standard+BDS Model) in SPICE PARK
 
SPICE MODEL of 2SK3435 (Standard+BDS Model) in SPICE PARK
SPICE MODEL of 2SK3435 (Standard+BDS Model) in SPICE PARKSPICE MODEL of 2SK3435 (Standard+BDS Model) in SPICE PARK
SPICE MODEL of 2SK3435 (Standard+BDS Model) in SPICE PARK
 
SPICE MODEL of TPCP8102 (Professional+BDP Model) in SPICE PARK
SPICE MODEL of TPCP8102 (Professional+BDP Model) in SPICE PARKSPICE MODEL of TPCP8102 (Professional+BDP Model) in SPICE PARK
SPICE MODEL of TPCP8102 (Professional+BDP Model) in SPICE PARK
 

Amr

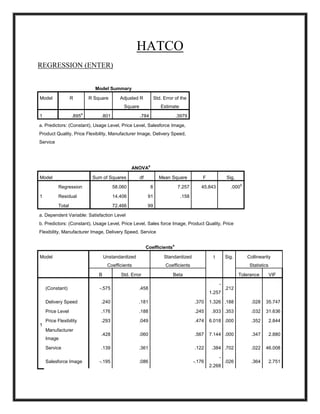
  • 1. HATCO REGRESSION (ENTER) Model Summary Model R R Square Adjusted R Std. Error of the Square Estimate a 1 .895 .801 .784 .3979 a. Predictors: (Constant), Usage Level, Price Level, Salesforce Image, Product Quality, Price Flexibility, Manufacturer Image, Delivery Speed, Service a ANOVA Model Sum of Squares df Mean Square F Sig. b Regression 58.060 8 7.257 45.843 .000 1 Residual 14.406 91 .158 Total 72.466 99 a. Dependent Variable: Satisfaction Level b. Predictors: (Constant), Usage Level, Price Level, Sales force Image, Product Quality, Price Flexibility, Manufacturer Image, Delivery Speed, Service a Coefficients Model Unstandardized Standardized t Sig. Collinearity Coefficients Coefficients Statistics B Std. Error Beta Tolerance VIF - (Constant) -.575 .458 .212 1.257 Delivery Speed .240 .181 .370 1.326 .188 .028 35.747 Price Level .176 .188 .245 .933 .353 .032 31.636 Price Flexibility .293 .049 .474 6.018 .000 .352 2.844 1 Manufacturer .428 .060 .567 7.144 .000 .347 2.880 Image Service .139 .361 .122 .384 .702 .022 46.008 - Salesforce Image -.195 .086 -.176 .026 .364 2.751 2.268
  • 2. - Product Quality -.046 .032 -.084 .164 .606 1.651 1.404 Usage Level -.001 .009 -.009 -.088 .930 .225 4.443 a. Dependent Variable: Satisfaction Level
  • 3. REGRESSION(STEPWISE) Model Summary Model R R Square Adjusted R Std. Error of the Square Estimate a 1 .711 .505 .500 .6049 b 2 .781 .611 .603 .5393 c 3 .830 .689 .679 .4848 d 4 .857 .735 .724 .4496 e 5 .885 .784 .772 .4082 f 6 .885 .783 .774 .4070 g 7 .892 .795 .785 .3971 a. Predictors: (Constant), Usage Level b. Predictors: (Constant), Usage Level, Manufacturer Image c. Predictors: (Constant), Usage Level, Manufacturer Image, Delivery Speed d. Predictors: (Constant), Usage Level, Manufacturer Image, Delivery Speed, Price Flexibility e. Predictors: (Constant), Usage Level, Manufacturer Image, Delivery Speed, Price Flexibility, Service f. Predictors: (Constant), Manufacturer Image, Delivery Speed, Price Flexibility, Service g. Predictors: (Constant), Manufacturer Image, Delivery Speed, Price Flexibility, Service, Salesforce Image
  • 4. a Coefficients Model Unstandardized Standardized t Sig. Collinearity Coefficients Coefficients Statistics B Std. Error Beta Tolerance VIF (Constant) 1.653 .318 5.203 .000 1 Usage Level .068 .007 .711 10.001 .000 1.000 1.000 (Constant) .658 .343 1.916 .058 Usage Level .061 .006 .636 9.782 .000 .950 1.053 2 Manufacturer .252 .049 .333 5.128 .000 .950 1.053 Image (Constant) .800 .310 2.583 .011 Usage Level .035 .008 .368 4.593 .000 .506 1.976 3 Manufacturer .283 .045 .374 6.339 .000 .931 1.074 Image Delivery Speed .248 .051 .383 4.904 .000 .532 1.881 (Constant) -.100 .362 -.276 .783 Usage Level .022 .008 .236 2.908 .005 .425 2.352 Manufacturer 4 .332 .043 .439 7.700 .000 .859 1.164 Image Delivery Speed .213 .048 .328 4.454 .000 .514 1.946 Price Flexibility .171 .042 .277 4.080 .000 .605 1.652 (Constant) -.784 .361 -2.172 .032 Usage Level -.006 .009 -.067 -.676 .501 .237 4.222 Manufacturer .314 .039 .415 7.979 .000 .851 1.176 5 Image Delivery Speed .106 .049 .163 2.146 .034 .399 2.506 Price Flexibility .308 .048 .499 6.378 .000 .375 2.664 Service .480 .104 .421 4.608 .000 .275 3.633 (Constant) -.743 .355 -2.093 .039 Manufacturer .309 .039 .408 8.015 .000 .881 1.135 Image 6 Delivery Speed .104 .049 .161 2.125 .036 .400 2.501 Price Flexibility .287 .037 .465 7.800 .000 .643 1.555 Service .433 .077 .380 5.587 .000 .494 2.023 (Constant) -.824 .348 -2.371 .020 Manufacturer 7 .419 .059 .555 7.071 .000 .354 2.827 Image Delivery Speed .106 .048 .164 2.226 .028 .400 2.502
  • 5. Price Flexibility .293 .036 .474 8.134 .000 .640 1.561 Service .430 .076 .378 5.692 .000 .494 2.024 Salesforce Image -.204 .085 -.184 -2.411 .018 .375 2.665 a. Dependent Variable: Satisfaction Level
  • 6. CORRELATION Correlations Satisfactio Deliver Price Price Manufactur Servic Salesforc Produc Usag n Level y Leve Flexibilit er Image e e Image t e Speed l y Quality Level Pearson ** ** ** ** ** ** ** Correlatio 1 .651 .028 .525 .476 .631 .341 -.283 .711 Satisfaction n Level Sig. (2- .000 .779 .000 .000 .000 .001 .004 .000 tailed) N 100 100 100 100 100 100 100 100 100 Pearson - ** * ** ** ** ** Correlatio .651 1 .349 .509 .050 .612 .077 -.483 .676 * Delivery n Speed Sig. (2- .000 .000 .000 .618 .000 .446 .000 .000 tailed) N 100 100 100 100 100 100 100 100 100 Pearson ** ** ** ** ** Correlatio .028 -.349 1 -.487 .272 .513 .186 .470 .082 n Price Level Sig. (2- .779 .000 .000 .006 .000 .064 .000 .418 tailed) N 100 100 100 100 100 100 100 100 100 Pearson - ** ** * ** ** Correlatio .525 .509 .487 1 -.116 .067 -.034 -.448 .559 * Price n Flexibility Sig. (2- .000 .000 .000 .250 .510 .735 .000 .000 tailed) N 100 100 100 100 100 100 100 100 100 Pearson * ** .272 ** ** * * Correlatio .476 .050 * -.116 1 .299 .788 .200 .224 Manufactur n er Image Sig. (2- .000 .618 .006 .250 .003 .000 .046 .025 tailed) N 100 100 100 100 100 100 100 100 100 Pearson * ** ** .513 ** * ** Service Correlatio .631 .612 * .067 .299 1 .241 -.055 .701 n
  • 7. Sig. (2- .000 .000 .000 .510 .003 .016 .586 .000 tailed) N 100 100 100 100 100 100 100 100 100 Pearson ** ** * * Correlatio .341 .077 .186 -.034 .788 .241 1 .177 .256 Salesforce n Image Sig. (2- .001 .446 .064 .735 .000 .016 .078 .010 tailed) N 100 100 100 100 100 100 100 100 100 Pearson * ** ** .470 ** * Correlatio -.283 -.483 * -.448 .200 -.055 .177 1 -.192 Product n Quality Sig. (2- .004 .000 .000 .000 .046 .586 .078 .055 tailed) N 100 100 100 100 100 100 100 100 100 Pearson ** ** ** * ** * Correlatio .711 .676 .082 .559 .224 .701 .256 -.192 1 Usage n Level Sig. (2- .000 .000 .418 .000 .025 .000 .010 .055 tailed) N 100 100 100 100 100 100 100 100 100 **. Correlation is significant at the 0.01 level (2-tailed). *. Correlation is significant at the 0.05 level (2-tailed). FACTOR ANALYSIS a Rotated Component Matrix Component 1 2 3 Service .952 .191 .127 Usage Level .848 -.285 .198 Delivery Speed .702 -.582 .034 Price Level .366 .871 .089 Price Flexibility .292 -.782 -.009 Product Quality -.170 .713 .200 Salesforce Image .111 .053 .941 Manufacturer Image .145 .154 .915 Extraction Method: Principal Component Analysis. Rotation Method: Varimax with Kaiser Normalization. a. Rotation converged in 5 iterations.
  • 8. HBAT MULTIPLE REGRESSION (ENTER) Model Summary Model R R Square Adjusted R Std. Error of the Square Estimate a 1 .897 .804 .774 .5663 a. Predictors: (Constant), X18 - Delivery Speed, X8 - Technical Support, X6 - Product Quality, X15 - New Products, X7 - E-Commerce Activities, X10 - Advertising, X13 - Competitive Pricing, X16 - Order & Billing, X17 - Price Flexibility, X14 - Warranty & Claims, X12 - Salesforce Image, X9 - Complaint Resolution, X11 - Product Line a ANOVA Model Sum of Squares df Mean Square F Sig. b Regression 113.044 13 8.696 27.111 .000 1 Residual 27.584 86 .321 Total 140.628 99 a. Dependent Variable: X19 - Satisfaction b. Predictors: (Constant), X18 - Delivery Speed, X8 - Technical Support, X6 - Product Quality, X15 - New Products, X7 - E-Commerce Activities, X10 - Advertising, X13 - Competitive Pricing, X16 - Order & Billing, X17 - Price Flexibility, X14 - Warranty & Claims, X12 - Salesforce Image, X9 - Complaint Resolution, X11 - Product Line a Coefficients Model Unstandardized Standardized t Sig. Collinearity Coefficients Coefficients Statistics B Std. Error Beta Tolerance VIF - (Constant) -1.336 1.120 .236 1.192 X6 - Product Quality .377 .053 .442 7.161 .000 .598 1.672 1 X7 - E-Commerce - -.456 .137 -.268 .001 .354 2.823 Activities 3.341 X8 - Technical Support .035 .065 .045 .542 .589 .328 3.047
  • 9. X9 - Complaint .154 .104 .156 1.489 .140 .207 4.838 Resolution X10 - Advertising -.034 .063 -.033 -.548 .585 .646 1.547 X11 - Product Line .362 .267 .400 1.359 .178 .026 37.978 X12 - Salesforce Image .827 .101 .744 8.155 .000 .274 3.654 X13 - Competitive -.047 .048 -.062 -.985 .328 .584 1.712 Pricing X14 - Warranty & -.107 .126 -.074 -.852 .397 .306 3.268 Claims X15 - New Products -.003 .040 -.004 -.074 .941 .930 1.075 X16 - Order & Billing .143 .105 .111 1.369 .175 .344 2.909 X17 - Price Flexibility .238 .272 .241 .873 .385 .030 33.332 X18 - Delivery Speed -.249 .514 -.154 -.485 .629 .023 44.004 a. Dependent Variable: X19 – Satisfaction
  • 10. MULTIPLE REGRESSION (STEPWISE) Model Summary Model R R Square Adjusted R Std. Error of the Square Estimate a 1 .603 .364 .357 .9554 b 2 .738 .544 .535 .8129 c 3 .868 .753 .745 .6020 d 4 .879 .773 .763 .5802 e 5 .889 .791 .780 .5595 a. Predictors: (Constant), X9 - Complaint Resolution b. Predictors: (Constant), X9 - Complaint Resolution, X6 - Product Quality c. Predictors: (Constant), X9 - Complaint Resolution, X6 - Product Quality, X12 - Salesforce Image d. Predictors: (Constant), X9 - Complaint Resolution, X6 - Product Quality, X12 - Salesforce Image, X7 - E-Commerce Activities e. Predictors: (Constant), X9 - Complaint Resolution, X6 - Product Quality, X12 - Salesforce Image, X7 - E-Commerce Activities, X11 - Product Line a Coefficients Model Unstandardized Standardized t Sig. Collinearity Coefficients Coefficients Statistics B Std. Error Beta Tolerance VIF (Constant) 3.680 .443 8.310 .000 1 X9 - Complaint .595 .079 .603 7.488 .000 1.000 1.000 Resolution (Constant) 1.077 .564 1.909 .059 X9 - Complaint 2 .550 .068 .558 8.092 .000 .989 1.011 Resolution X6 - Product Quality .364 .059 .427 6.193 .000 .989 1.011 (Constant) -1.569 .511 -3.069 .003 X9 - Complaint 3 .433 .052 .439 8.329 .000 .927 1.079 Resolution X6 - Product Quality .437 .044 .512 9.861 .000 .956 1.046
  • 11. X12 - Salesforce Image .530 .059 .477 8.992 .000 .916 1.092 (Constant) -1.106 .518 -2.134 .035 X9 - Complaint .423 .050 .429 8.430 .000 .923 1.084 Resolution 4 X6 - Product Quality .435 .043 .509 10.177 .000 .956 1.046 X12 - Salesforce Image .736 .091 .663 8.074 .000 .356 2.813 X7 - E-Commerce -.395 .137 -.232 -2.890 .005 .372 2.692 Activities (Constant) -1.151 .500 -2.303 .023 X9 - Complaint .319 .061 .323 5.256 .000 .588 1.701 Resolution X6 - Product Quality .369 .047 .432 7.820 .000 .728 1.373 5 X12 - Salesforce Image .775 .089 .697 8.711 .000 .347 2.880 X7 - E-Commerce -.417 .132 -.245 -3.162 .002 .370 2.701 Activities X11 - Product Line .174 .061 .192 2.860 .005 .492 2.033 a. Dependent Variable: X19 - Satisfaction
  • 12. CORRELATION FACTOR ANALYSIS a Rotated Component Matrix Component 1 2 3 4 5 X18 - Delivery Speed .945 .024 .170 .001 .056 X9 - Complaint Resolution .928 .078 .111 .053 .001 X16 - Order & Billing .869 .017 .096 .092 .022 X6 - Product Quality .039 .823 -.010 -.048 .054 X17 - Price Flexibility .490 -.758 .221 -.147 .079 X11 - Product Line .559 .714 -.037 .133 .008 X13 - Competitive Pricing -.117 -.688 .223 -.232 .035 X12 - Salesforce Image .129 -.159 .902 .074 -.013 X7 - E-Commerce Activities .054 -.106 .879 .038 -.103 X10 - Advertising .160 -.050 .722 -.071 .144 X8 - Technical Support .025 .102 -.023 .936 -.068 X14 - Warranty & Claims .099 .123 .060 .932 .057 X15 - New Products .051 -.001 .020 -.008 .987 Extraction Method: Principal Component Analysis. Rotation Method: Varimax with Kaiser Normalization. a. Rotation converged in 5 iterations.
  • 13. NIKE MULTIPLE REGRESSION(ENTER) Model Summary Model R R Square Adjusted R Std. Error of the Square Estimate a 1 .767 .588 .541 1.164 a. Predictors: (Constant), Attitude, Intention, Preference, Awareness a ANOVA Model Sum of Squares df Mean Square F Sig. b Regression 67.592 4 16.898 12.482 .000 1 Residual 47.383 35 1.354 Total 114.975 39 a. Dependent Variable: Loyalty b. Predictors: (Constant), Attitude, Intention, Preference, Awareness a Coefficients Model Unstandardized Coefficients Standardized Coefficients t Sig. Collinearity Statistics B Std. Error Beta Tolerance VIF (Constant) .526 .692 .760 .452 Awareness .031 .172 .034 .180 .858 .328 3.045 1 Preference .059 .156 .055 .380 .706 .571 1.752 Intention .784 .117 .757 6.728 .000 .930 1.075 Attitude -.034 .166 -.038 -.206 .838 .339 2.948 a. Dependent Variable: Loyalty
  • 14. MULTIPLE REGRESSION(STEPWISE) Model Summary Model R R Square Adjusted R Std. Error of the Square Estimate a 1 .765 .585 .574 1.121 a. Predictors: (Constant), Intention a ANOVA Model Sum of Squares df Mean Square F Sig. b Regression 67.222 1 67.222 53.494 .000 1 Residual 47.753 38 1.257 Total 114.975 39 a. Dependent Variable: Loyalty b. Predictors: (Constant), Intention a Coefficients Model Unstandardized Coefficients Standardized Coefficients t Sig. Collinearity Statistics B Std. Error Beta Tolerance VIF (Constant) .737 .483 1.526 .135 1 Intention .792 .108 .765 7.314 .000 1.000 1.000 a. Dependent Variable: Loyalty
  • 15. CORRELATION Correlations Loyalty Awareness Preference Intention Attitude ** Pearson Correlation 1 .068 .193 .759 .081 Loyalty Sig. (2-tailed) .664 .215 .000 .604 N 44 43 43 43 43 ** ** Pearson Correlation .068 1 .596 .031 .790 Awareness Sig. (2-tailed) .664 .000 .846 .000 N 43 44 43 43 43 ** ** Pearson Correlation .193 .596 1 .226 .601 Preference Sig. (2-tailed) .215 .000 .145 .000 N 43 43 44 43 43 ** Pearson Correlation .759 .031 .226 1 .102 Intention Sig. (2-tailed) .000 .846 .145 .513 N 43 43 43 44 43 ** ** Pearson Correlation .081 .790 .601 .102 1 Attitude Sig. (2-tailed) .604 .000 .000 .513 N 43 43 43 43 44 **. Correlation is significant at the 0.01 level (2-tailed). FACTOR ANALYSIS a Rotated Component Matrix Component 1 2 Awareness .922 -.080 Attitude .914 -.023 Preference .798 .282 Intention .031 .984 Extraction Method: Principal Component Analysis. Rotation Method: Varimax with Kaiser Normalization. a. Rotation converged in 3 iterations.