





































Ir para o conteúdo principal
Brazil SaaS Landscape 2017:
Lessons from a deep dive into 400+
Brazilian SaaS Startups
RESEARCH PARTNERSRESEARCH PRODUCERS
Welcome to the first edition of the Brazil SaaS Landscape!
This research was developed by SaaSholic and Rock Content with
support from Signal Hill and Redpoint eventures.
In this first edition, we seek to collect data and understand growth,
funding and focus to develop a better understanding of the local SaaS
ecosystem.
The research surveyed 597 respondents in May 2017. 49% of
respondents were SaaS CEOs and that's the segment we focused our
research on.
We'd like to thank all partners and companies that helped promote and
answer the survey. This will be very important for the development of
our ecosystem and for future benchmarks.
We're commited to make this an annual research so we can track this
emerging startup category in Brazil.
For feedback/suggestions, mail me at diego@rockcontent.com or
Tweet at me at @dttg.
All the best,
Diego Gomes
KEY TAKEWAYS FROM OF
BRAZIL SaaS LANDSCAPE 2017
#1 Enterprise SaaS companies in Brazil grow faster
than B2C or SME focused startups;
#2 60% of companies have more than R$1m ARR(˜
$300k) and take less than 6 months to recover CAC
costs;
#3 67% of companies have an LTV/CAC ratio
superior to 3;
#4 The Brazilian SaaS startup takes a median 2 years
to get to R$1m ARR (˜$300k);
KEY TAKEWAYS FROM OF
BRAZIL SaaS LANDSCAPE 2017
#5 Inside sales is the the preferred go-to market
strategy of SaaS startups. field sales and channel
sales are rated the most efficient;
#6 26% of the companies surveyed have a
marketplace component;
#7 71% of the Brazilian SaaS startups are
bootstrapped and have never raised any funding.
#8 SaaS is still in is early stages in Brazil, but the
companies are maturing and showing healthy unit
economics.
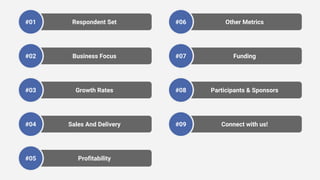
Respondent Set#01
Business Focus#02
Growth Rates#03
Sales And Delivery#04
Profitability#05
Other Metrics#06
Funding#07
Participants & Sponsors#08
Connect with us!#09
RESPONDENT SET#01
#01 | RESPONDENT SET
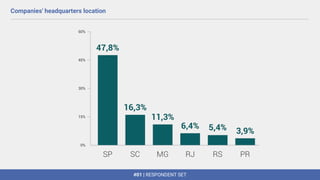
Companies' headquarters location
São Paulo is home to almost 50% of
Brazilian SaaS companies. The states of
Santa Catarina and Minas Gerais are
second and third place, respectively.
#01 | RESPONDENT SET
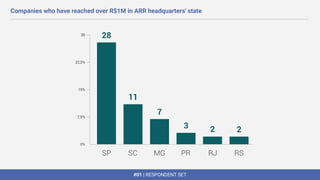
Companies who have reached over R$1M in ARR headquarters' state
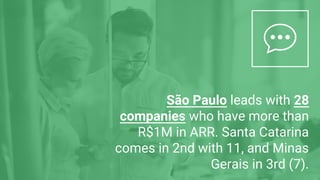
São Paulo leads with 28
companies who have more than
R$1M in ARR. Santa Catarina
comes in 2nd with 11, and Minas
Gerais in 3rd (7).
#01 | RESPONDENT SET
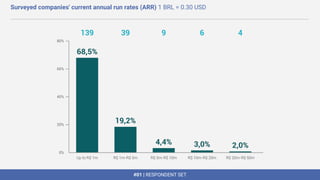
Surveyed companies' current annual run rates (ARR) 1 BRL = 0.30 USD
#01 | RESPONDENT SET
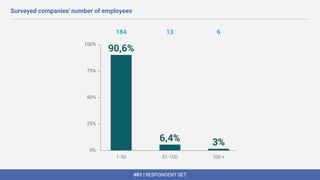
Surveyed companies' number of employees
#01 | RESPONDENT SET
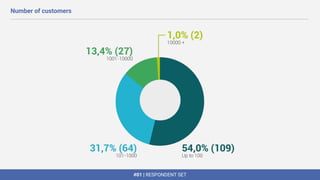
Number of customers
#01 | RESPONDENT SET
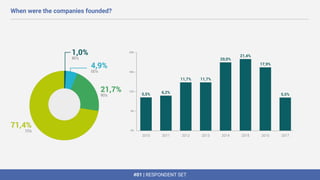
When were the companies founded?
54% of surveyed companies
started their activities after
2013.
32% began in 2015.
#01 | RESPONDENT SET
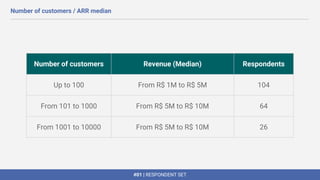
Number of customers / ARR median
Number of customers Revenue (Median) Respondents
Up to 100 From R$ 1M to R$ 5M 104
From 101 to 1000 From R$ 5M to R$ 10M 64
From 1001 to 10000 From R$ 5M to R$ 10M 26
#01 | RESPONDENT SET
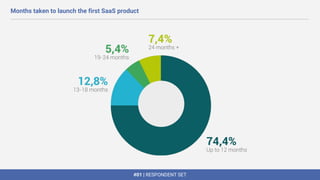
Months taken to launch the first SaaS product
#01 | RESPONDENT SET
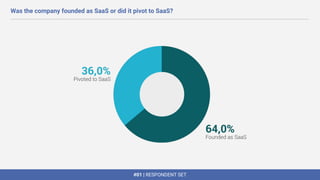
Was the company founded as SaaS or did it pivot to SaaS?
#01 | RESPONDENT SET
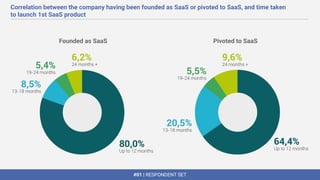
Correlation between the company having been founded as SaaS or pivoted to SaaS, and time taken
to launch 1st SaaS product
Founded as SaaS Pivoted to SaaS
Companies founded as
SaaS develop products with
higher speed than those
who pivoted to SaaS.
35% of companies that pivoted to
SaaS took more than 12 months
to launch their product, in
contrast to 20% of companies
founded as SaaS.
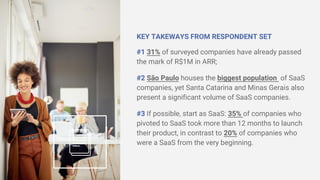
KEY TAKEWAYS FROM RESPONDENT SET
#1 31% of surveyed companies have already passed
the mark of R$1M in ARR;
#2 São Paulo houses the biggest population of SaaS
companies, yet Santa Catarina and Minas Gerais also
present a significant volume of SaaS companies.
#3 If possible, start as SaaS: 35% of companies who
pivoted to SaaS took more than 12 months to launch
their product, in contrast to 20% of companies who
were a SaaS from the very beginning.
BUSINESS FOCUS
MARKET AND PRODUCT
FOCUS OF THE RESPONDENTS
#02
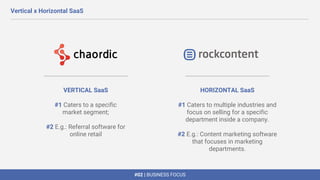
VERTICAL SaaS
#1 Caters to a specific
market segment;
#2 E.g.: Referral software for
online retail
HORIZONTAL SaaS
#1 Caters to multiple industries and
focus on selling for a specific
department inside a company.
#2 E.g.: Content marketing software
that focuses in marketing
departments.
#02 | BUSINESS FOCUS
Vertical x Horizontal SaaS
#02 | BUSINESS FOCUS
Vertical x Horizontal SaaS
#02 | BUSINESS FOCUS
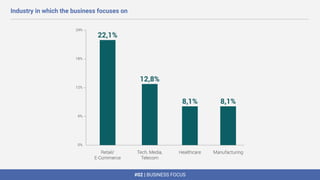
Industry in which the business focuses on
Retail is the industry that
consumes more SaaS products,
followed by Tech/Telecom.
#02 | BUSINESS FOCUS
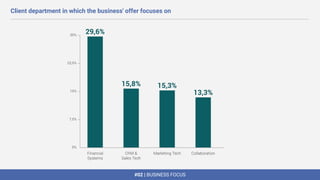
Client department in which the business' offer focuses on
Management, Finance and
Tech are the departments
inside a company that
consume more SaaS
products.
#02 | BUSINESS FOCUS
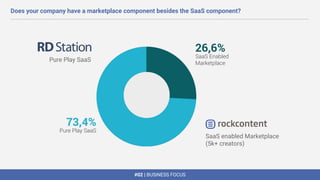
Does your company have a marketplace component besides the SaaS component?
Pure Play SaaS
SaaS enabled Marketplace
(5k+ creators)
#02 | BUSINESS FOCUS
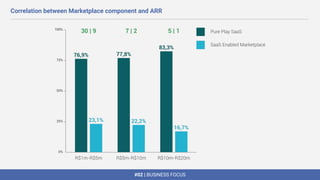
Correlation between Marketplace component and ARR
Among the companies who
have reached R$1M ARR, 24%
of them have a Marketplace
component.
#02 | BUSINESS FOCUS
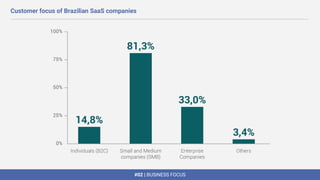
Customer focus of Brazilian SaaS companies
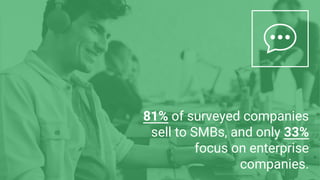
81% of surveyed companies
sell to SMBs, and only 33%
focus on enterprise
companies.
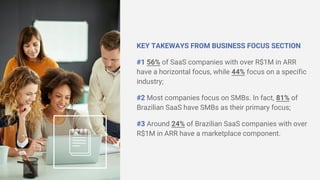
KEY TAKEWAYS FROM BUSINESS FOCUS SECTION
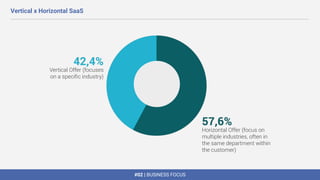
#1 56% of SaaS companies with over R$1M in ARR
have a horizontal focus, while 44% focus on a specific
industry;
#2 Most companies focus on SMBs. In fact, 81% of
Brazilian SaaS have SMBs as their primary focus;
#3 Around 24% of Brazilian SaaS companies with over
R$1M in ARR have a marketplace component.
GROWTH RATES
GROWTH PROFILE OF
THE RESPONDENT SET
#03
#03 | GROWTH RATES
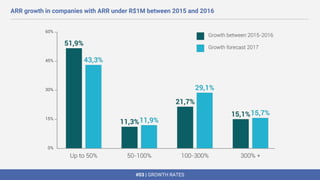
ARR growth in companies with ARR under R$1M between 2015 and 2016
42% of companies with ARR
under R$1M forecast a growth
of over 100% in 2017.
#03 | GROWTH RATES
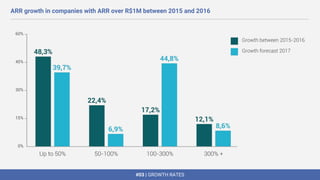
ARR growth in companies with ARR over R$1M between 2015 and 2016
53% of companies with ARR
>R$1M forecast a growth of
over 100% in 2017.
#03 | GROWTH RATES
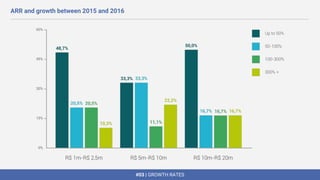
ARR and growth between 2015 and 2016
Only 33% of SaaS
companies are able to
grow more than 100% a
year after they reach
R$10M ARR.
#03 | GROWTH RATES
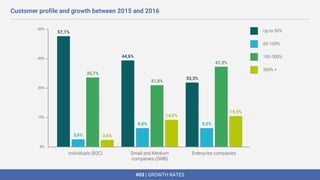
Customer profile and growth between 2015 and 2016
Companies that focus on enterprise customers
grow at a higher speed. 57% had a growth rate of
over 100% in 2016, in contrast to 46% of those
who focus on SMB.
#03 | GROWTH RATES
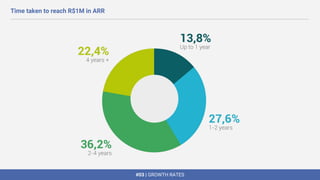
Time taken to reach R$1M in ARR
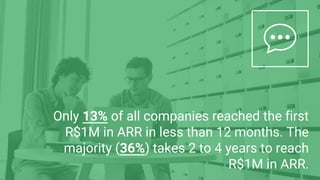
Only 13% of all companies reached the first
R$1M in ARR in less than 12 months. The
majority (36%) takes 2 to 4 years to reach
R$1M in ARR.
KEY TAKEWAYS FROM GROWTH RATES SECTION
#1 Companies that focus on the enterprise market
grow at a higher speed. Over 57% of them saw a
growth rate of over 100% in 2016, while those that
focus on SMB grew 46% YoY.
#2 After R$10M in ARR, companies face greater
hardships in growth. Only 33% are able to grow over
100% YoY.
SALES AND DELIVERY
CHANNELS AND
DELIVERY METHODS
#04
#04 | SALES AND DELIVERY
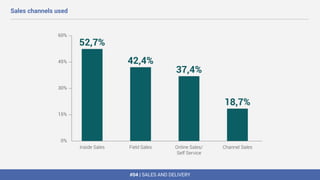
Sales channels used
Inside Sales is the most used sales
model, followed by field sales. Only 18%
of surveyed companies use channel
sales.
#04 | SALES AND DELIVERY
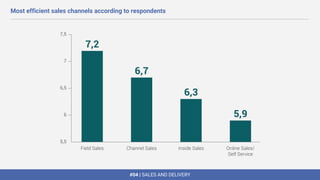
Most efficient sales channels according to respondents
However, field sales and channel
sales are considered the most
efficient distribution models by
surveyed companies.
#04 | SALES AND DELIVERY
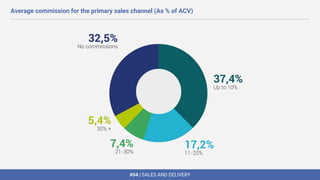
Average commission for the primary sales channel (As % of ACV)
Most companies pay up to
10% of the contract value in
commissions. 32% don't
adopt commissions at all.
#04 | SALES AND DELIVERY
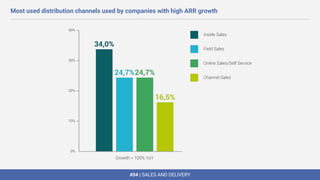
Most used distribution channels used by companies with high ARR growth
Inside Sales is the favorite sales
model for high growth companies.
Self Service Sales and Field Sales
are tied in second place.
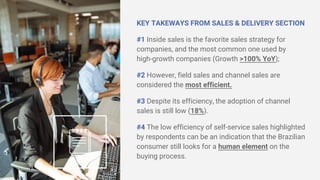
KEY TAKEWAYS FROM SALES & DELIVERY SECTION
#1 Inside sales is the favorite sales strategy for
companies, and the most common one used by
high-growth companies (Growth >100% YoY);
#2 However, field sales and channel sales are
considered the most efficient.
#3 Despite its efficiency, the adoption of channel
sales is still low (18%).
#4 The low efficiency of self-service sales highlighted
by respondents can be an indication that the Brazilian
consumer still looks for a human element on the
buying process.
PROFITABILITY COSTS
AND MARGIN DRIVERS
OF RESPONDENTS
#05
#05 | PROFITABILITY
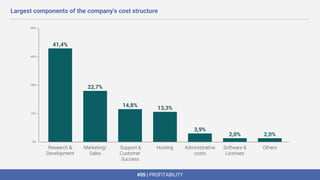
Largest components of the company's cost structure
R&D, marketing/sales and
support/CS are the largest
components of the cost
structure of a SaaS company.
#05 | PROFITABILITY
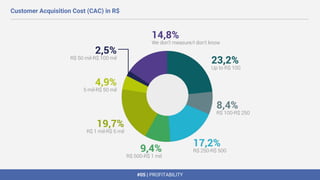
Customer Acquisition Cost (CAC) in R$
58% of companies spend
less than R$1K to acquire a
new customer.
#05 | PROFITABILITY
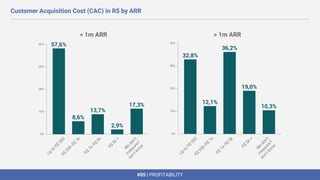
Customer Acquisition Cost (CAC) in R$ by ARR
< 1m ARR > 1m ARR
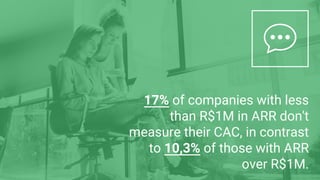
17% of companies with less
than R$1M in ARR don't
measure their CAC, in contrast
to 10,3% of those with ARR
over R$1M.
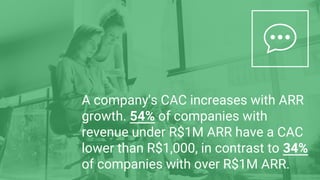
A company's CAC increases with ARR
growth. 54% of companies with
revenue under R$1M ARR have a CAC
lower than R$1,000, in contrast to 34%
of companies with over R$1M ARR.
#05 | PROFITABILITY
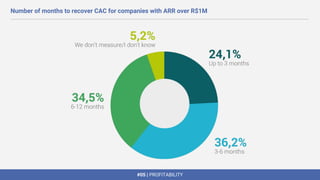
Number of months to recover CAC for companies with ARR over R$1M
Over 60% of companies
(>R$1M ARR) recover
their CAC in less than 6
months.
#05 | PROFITABILITY
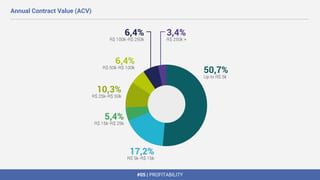
Annual Contract Value (ACV)
Over 50% of surveyed
companies have annual
contract values of less
than R$5K.
#05 | PROFITABILITY
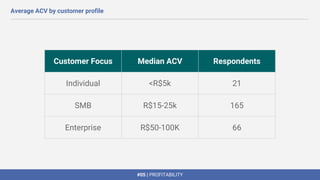
Customer Focus Median ACV Respondents
Individual <R$5k 21
SMB R$15-25k 165
Enterprise R$50-100K 66
Average ACV by customer profile
#06 | OTHER METRICS
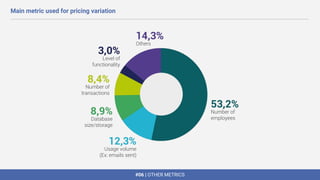
Main metric used for pricing variation
#05 | PROFITABILITY
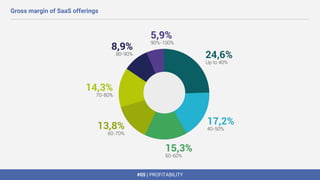
Gross margin of SaaS offerings
The median gross
margin a SaaS in Brazil
is between 70-80%.
#05 | PROFITABILITY
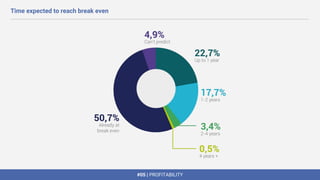
Time expected to reach break even
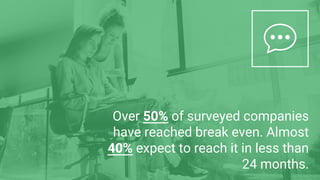
Over 50% of surveyed companies
have reached break even. Almost
40% expect to reach it in less than
24 months.
KEY TAKEWAYS FROM PROFITABILITY SECTION
#1 Brazilian companies don't operate as leveraged as
the American market. Over 50% of the country's
companies recover their CAC in less than 6 months.
#2 Over 50% of companies find themselves in break
even and 40% expect to reach it within the next 24
months.
#3 The SaaS service margins in Brazil are aligned with
American benchmarks, between 70-80%;
#4 CAC increases significantly after the first R$1M
ARR.
OTHER METRICS
SaaS KPIs#06
#06 | OTHER METRICS
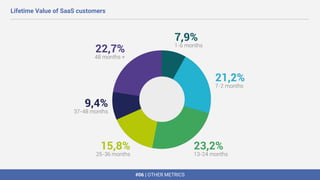
Lifetime Value of SaaS customers
The median LTV of a
SaaS in Brazil is 37 to
48 months.
#06 | OTHER METRICS
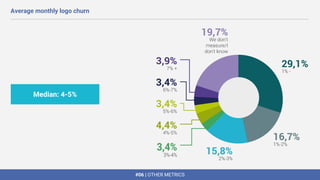
Average monthly logo churn
Median: 4-5%
#06 | OTHER METRICS
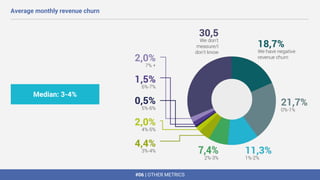
Average monthly revenue churn
Median: 3-4%
30% of companies don't
measure revenue churn, and
only 18% get to negative
revenue churn.
The median revenue churn in
Brazilian companies is 3-4%.
#06 | OTHER METRICS
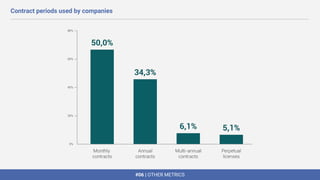
Contract periods used by companies
Monthly contracts are still
the rule, although annual
contracts are adopted by
34% of companies.
#06 | OTHER METRICS
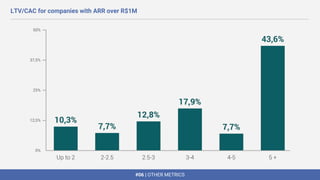
LTV/CAC for companies with ARR over R$1M
67% of surveyed companies
have a ratio of LTV/CAC > 3.
#06 | OTHER METRICS
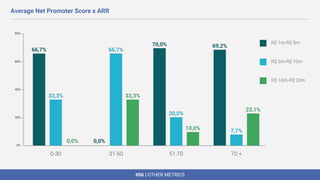
Average Net Promoter Score x ARR
No company with an NPS
under 30 has passed the
mark of R$10M ARR!
#06 | OTHER METRICS
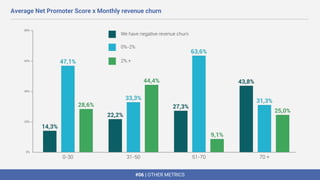
Average Net Promoter Score x Monthly revenue churn
There is a clear correlation
between NPS and Churn. 48%
of companies with an NPS
above 70 have negative
revenue churn.
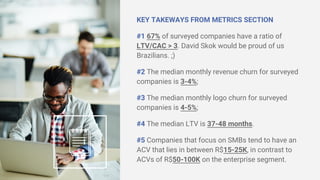
KEY TAKEWAYS FROM METRICS SECTION
#1 67% of surveyed companies have a ratio of
LTV/CAC > 3. David Skok would be proud of us
Brazilians. ;)
#2 The median monthly revenue churn for surveyed
companies is 3-4%;
#3 The median monthly logo churn for surveyed
companies is 4-5%;
#4 The median LTV is 37-48 months.
#5 Companies that focus on SMBs tend to have an
ACV that lies in between R$15-25K, in contrast to
ACVs of R$50-100K on the enterprise segment.
FUNDING
FUNDING AND VALUATION#07
#07 | OTHER METRICS
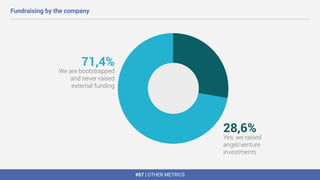
Fundraising by the company
SaaS and Bootstrapping
seem to work well together in
Brazil. 71% of companies
have never raised funds.
#07 | OTHER METRICS
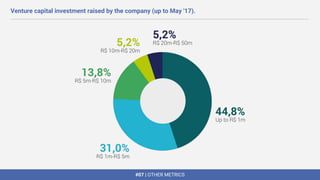
Venture capital investment raised by the company (up to May '17).
Only 10,4% have
raised over
R$10M.
#07 | OTHER METRICS
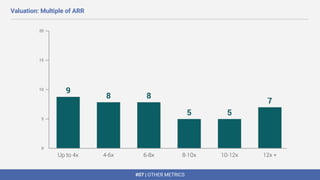
Valuation: Multiple of ARR
The median of
SaaS valuations
in Brazil is
between 6 to 8X
ARR.