Ir para o conteúdo principal
WWF
LIVING
PLANET
REPORT
2024
1
A System in Peril
A System in Peril
2024
LIVING
PLANET
REPORT
A System in Peril
WWF
LIVING
PLANET
REPORT
2024
2
WWF
WWF is an independent conservation organisation,
with more than 38 million followers and a global network
active through local leadership in over 100 countries.
Our mission is to stop the degradation of the planet’s
natural environment and to build a future in which people
live in harmony with nature, by conserving the world’s
biological diversity, ensuring that the use of renewable
natural resources is sustainable, and promoting the
reduction of pollution and wasteful consumption.
ZSL (Zoological Society of London) Institute of Zoology
Founded in 1826, ZSL is an international conservation
charity, driven by science, working to restore wildlife in the
UK and around the world; by protecting critical species,
restoring ecosystems, helping people and wildlife live
together and inspiring support for nature. Through our
leading conservation zoos, London and Whipsnade, we
bring people closer to nature and use our expertise to
protect wildlife today, while inspiring a lifelong love of
animals in the conservationists of tomorrow.
ZSL manages the Living Planet Index in a collaborative
partnership with WWF.
Citation
WWF (2024) Living Planet Report 2024 – A System in
Peril. WWF, Gland, Switzerland.
Design and infographics by: Sylvia Weir / Weirdesign
Cover image: © pilli / Adobe Stock
ISBN: 978-2-88085-319-8
Living Planet Report® and Living Planet Index®
are registered trademarks of WWF International.
WWF
LIVING
PLANET
REPORT
2024
3
CONTENTS
Executivesummary
ForewordbyKirstenSchuijt
ForewordbyMaríaSusanaMuhamadGonzález
1.Measuringnature’sdecline
What is biodiversity and why is it important?
How do we measure nature?
• 
Nature narratives: using indicators to understand 		
change over different timescales
• 
Nature narratives: from populations to
ecosystem function
The global Living Planet Index 2024
Understanding drivers of change to nature through
regional perspectives
Case studies
2.Tippingpoints
Early warning signals
• 
North America: fire suppression, drought
and invasive species
• 
Great Barrier Reef: overfishing, pollution and
warming waters
• 
India: wetland loss, drought and flooding
Tipping points with global significance
A wake-up call
3.Globalgoalsandprogress

Reaching 2030 on the pathway to a
sustainable future
4.Sustainablesolutions
Nature conservation
• 
Evolving approaches to conservation
• 
Transforming conservation
The food system
• 
Challenges with the current food system
• 
Food system transformation: what’s needed?
The energy system
• 
Challenges with the current energy system
• 
Energy transformation: what’s needed?
• 
How do we achieve a transformation that is
faster, greener and fairer?
Green finance
• 
Financing green
• 
Greening finance
5.Makingithappen

Tracking progress
The final push
Photocredits
References
6
14
16
18
19
20
20
22
24
26
32
34
36
36
38
40
41
43
44
46
50
51
51
52
61
62
65
70
71
72
74
77
80
81
84
85
85
86
87
WWF
LIVING
PLANET
REPORT
2024
4
Acknowledgements
Editorial Team
Rebecca Shaw (WWF-Global Science): Editor-in-chief
Kimberley Marchant (WWF-Global Science): Managing editor
Amanda Kegu (WWF-Global Science): Editorial manager
Alex Batka (WWF-Global Science): Editor
Kate Graves (WWF-Global Science): Production manager
Samantha Cheng (WWF-Global Science): Evidence lead
Mabel Baez Schon, Emily Mills and Nasser Olwero (WWF-Global Science):
Editorial support
Barney Jeffries (swim2birds.co.uk): Writer and editor
Sylvia Weir (Weirdesign): Graphic designer
Steering Committee
Zach Abraham (WWF International), Mike Barrett (WWF-United Kingdom),
Katie Gough (WWF International), Chris Hallam (WWF-Greater Mekong),
Else Hendel (WWF-Norway), Aimée Leslie (WWF-Peru), Rebecca Shaw
(WWF-Global Science) and Jeff Worden (WWF International)
Authors
Maud Abdelli (WWF-Switzerland), Zach Abraham (WWF International),
Dominic Andradi-Brown (WWF-United States), Mike Barrett (WWF-United
Kingdom), Nathan Bennett (WWF-Global Science), Becky Chaplin-Kramer
(WWF-Global Science), Samantha Cheng (WWF-Global Science),
Stefanie Deinet (Zoological Society of London), Robin Freeman
(Zoological Society of London), Sarah Glaser (WWF-United States),
Rachel Golden-Kroner (WWF-United States), Brent Loken (WWF-Global
Science), Valentina Marconi (Zoological Society of London), Louise McRae
(Zoological Society of London), Ravic Nijbroek (WWF-Netherlands),
Jeff Opperman (WWF-Global Science), Pablo Pacheco (WWF-Global
Science), Hannah Puleston (Zoological Society of London), Stephanie Roe
(WWF-Global Science), Lucia Ruiz (WWF-United States), Kirsten Schuijt
(WWF International), Abel Valdivia (WWF-United States), Aaron Vermeulen
(WWF International) and Daniel Viana (WWF-United States)
WWF contributors
This report is the result of extensive consultation and contributions
from our colleagues across the WWF Network. WWF staff offered
their expertise, knowledge and feedback on the content of this Living
Planet Report. We express our profound gratitude and respect for their
invaluable contributions to this report.
Special thanks
We are grateful for the valuable insight and input provided by our
collaborators at the University of Exeter: Jesse Abrams, Tim Lenton,
Tom Powell and Steve Smith as well as advisers: Rosamunde Almond
and Winnie De’Ath.
We would also like to thank everyone who kindly added data to the
Living Planet Database (www.livingplanetindex.org) and specifically those
who supported data collection in the last two years: data for Brazil:
Filipe Serrano (University of São Paulo, Brazil) and Helga Correa
Wiederhecker (WWF-Brazil); data for migratory freshwater fish:
Zeb Hogan (University of Nevada, United States), Samol Chhuoy
(Royal University of Agriculture  Royal University of Phnom Penh,
Cambodia) and Peng Bun Ngor (Royal University of Agriculture,
Cambodia). We would also like to acknowledge the attendees of
the Living Planet Index (LPI) development workshop held at ZSL in
September 2023 and their contributions to the short and long-term
recommendations for LPI development.
WWF
LIVING
PLANET
REPORT
2024
5
WWF
LIVING
PLANET
REPORT
2024
6
EXECUTIVE
SUMMARY
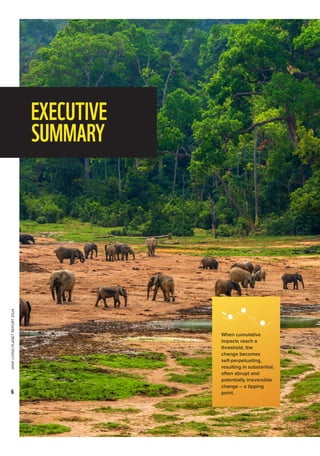
When cumulative
impacts reach a
threshold, the
change becomes
self-perpetuating,
resulting in substantial,
often abrupt and
potentially irreversible
change – a tipping
point.
WWF
LIVING
PLANET
REPORT
2024
7
EXECUTIVE
SUMMARY
Nature is being lost – with huge
implications for us all
Biodiversity sustains human life and underpins our societies. Yet every indicator that tracks the state of nature
on a global scale shows a decline.
Over the past 50 years (1970–2020), the average size of monitored wildlife populations has shrunk by 73%,
as measured by the Living Planet Index (LPI). This is based on almost 35,000 population trends and 5,495
species of amphibians, birds, fish, mammals and reptiles. Freshwater populations have suffered the heaviest
declines, falling by 85%, followed by terrestrial (69%) and marine populations (56%).
At a regional level, the fastest declines have been seen in Latin America and the Caribbean – a concerning
95% decline – followed by Africa (76%) and the Asia and the Pacific (60%). Declines have been less dramatic
in Europe and Central Asia (35%) and North America (39%), but this reflects the fact that large-scale impacts
on nature were already apparent before 1970 in these regions: some populations have stabilized or increased
thanks to conservation efforts and species reintroductions. Habitat degradation and loss, driven primarily by
our food system, is the most reported threat in each region, followed by overexploitation, invasive species
and disease. Other threats include climate change (most cited in Latin America and the Caribbean) and
pollution (particularly in North America and Asia and the Pacific).
By monitoring changes in the size of species populations over time, the LPI is an early warning indicator for
extinction risk and helps us understand the health of ecosystems. When a population falls below a certain
level, that species may not be able to perform its usual role within the ecosystem – whether that’s seed
dispersal, pollination, grazing, nutrient cycling or the many other processes that keep ecosystems functioning.
Stable populations over the long term provide resilience against disturbances like disease and extreme
weather events; a decline in populations, as shown in the global LPI, decreases resilience and threatens the
functioning of the ecosystem. This in turn undermines the benefits that ecosystems provide to people – from
food, clean water and carbon storage for a stable climate to the broader contributions that nature makes to
our cultural, social and spiritual well-being.
Dangerous tipping points are approaching
The LPI and similar indicators all show that nature is disappearing at an alarming rate. While some changes
may be small and gradual, their cumulative impacts can trigger a larger, faster change. When cumulative
impacts reach a threshold, the change becomes self-perpetuating, resulting in substantial, often abrupt and
potentially irreversible change. This is called a tipping point.
In the natural world, a number of tipping points are highly likely if current trends are left to continue, with
potentially catastrophic consequences. These include global tipping points that pose grave threats to
humanity and most species, and would damage Earth’s life-support systems and destabilize societies
everywhere. Early warning signs indicate that several global tipping points are fast approaching:
	 n 
In the biosphere, the mass die-off of coral reefs would destroy fisheries and storm protection for
hundreds of millions of people living on the coasts. The Amazon rainforest tipping point would
release tonnes of carbon into the atmosphere and disrupt weather patterns around the globe.
	 n 
In ocean circulation, the collapse of the subpolar gyre, a circular current south of Greenland,
would dramatically change weather patterns in Europe and North America.
	 n 
In the cryosphere (the frozen parts of the planet), the melting of the Greenland and West Antarctic
ice sheets would unleash many metres of sea level rise, while large-scale thawing of permafrost
would trigger vast emissions of carbon dioxide and methane.
WWF
LIVING
PLANET
REPORT
2024
8
Global tipping points can be hard to comprehend – but
we’re already seeing tipping points approaching at local and
regional levels, with severe ecological, social and economic
consequences:
	 n 
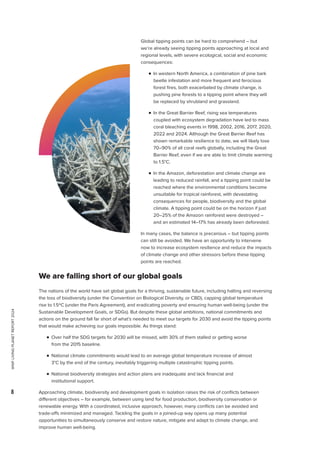
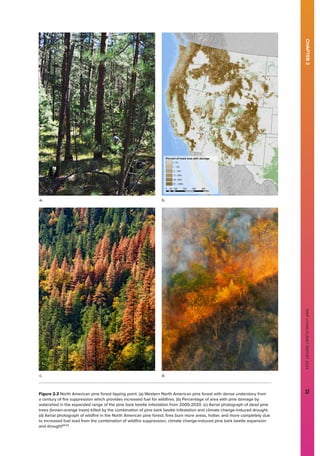
In western North America, a combination of pine bark
beetle infestation and more frequent and ferocious
forest fires, both exacerbated by climate change, is
pushing pine forests to a tipping point where they will
be replaced by shrubland and grassland.
	 n 
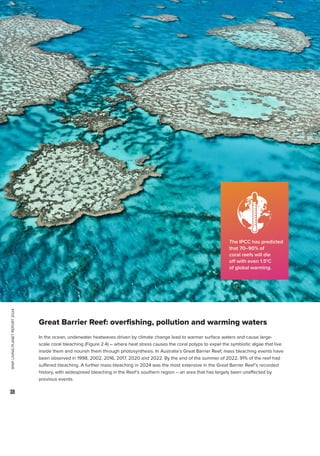
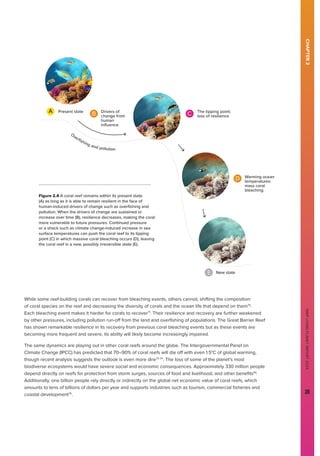
In the Great Barrier Reef, rising sea temperatures
coupled with ecosystem degradation have led to mass
coral bleaching events in 1998, 2002, 2016, 2017, 2020,
2022 and 2024. Although the Great Barrier Reef has
shown remarkable resilience to date, we will likely lose
70–90% of all coral reefs globally, including the Great
Barrier Reef, even if we are able to limit climate warming
to 1.5°C.
	 n 
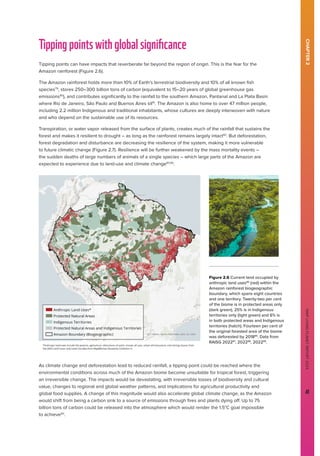
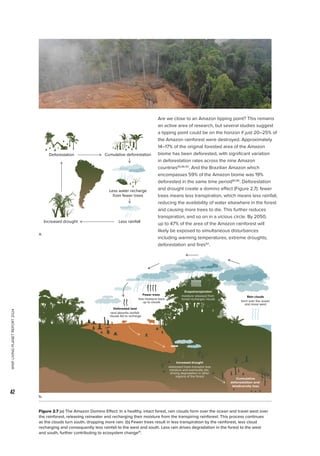
In the Amazon, deforestation and climate change are
leading to reduced rainfall, and a tipping point could be
reached where the environmental conditions become
unsuitable for tropical rainforest, with devastating
consequences for people, biodiversity and the global
climate. A tipping point could be on the horizon if just
20–25% of the Amazon rainforest were destroyed –
and an estimated 14–17% has already been deforested.
In many cases, the balance is precarious – but tipping points
can still be avoided. We have an opportunity to intervene
now to increase ecosystem resilience and reduce the impacts
of climate change and other stressors before these tipping
points are reached.
We are falling short of our global goals
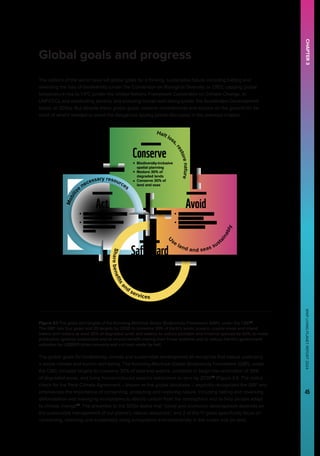
The nations of the world have set global goals for a thriving, sustainable future, including halting and reversing
the loss of biodiversity (under the Convention on Biological Diversity, or CBD), capping global temperature
rise to 1.5ºC (under the Paris Agreement), and eradicating poverty and ensuring human well-being (under the
Sustainable Development Goals, or SDGs). But despite these global ambitions, national commitments and
actions on the ground fall far short of what’s needed to meet our targets for 2030 and avoid the tipping points
that would make achieving our goals impossible. As things stand:
	 n 
Over half the SDG targets for 2030 will be missed, with 30% of them stalled or getting worse
from the 2015 baseline.
	 n 
National climate commitments would lead to an average global temperature increase of almost
3°C by the end of the century, inevitably triggering multiple catastrophic tipping points.
	 n 
National biodiversity strategies and action plans are inadequate and lack financial and
institutional support.
Approaching climate, biodiversity and development goals in isolation raises the risk of conflicts between
different objectives – for example, between using land for food production, biodiversity conservation or
renewable energy. With a coordinated, inclusive approach, however, many conflicts can be avoided and
trade-offs minimized and managed. Tackling the goals in a joined-up way opens up many potential
opportunities to simultaneously conserve and restore nature, mitigate and adapt to climate change, and
improve human well-being.
WWF
LIVING
PLANET
REPORT
2024
9
The scale of the challenge demands transformation
To maintain a living planet where people and nature thrive, we need action that meets the scale of the
challenge. We need more, and more effective, conservation efforts, while also systematically addressing
the major drivers of nature loss. That will require nothing less than a transformation of our food, energy and
finance systems.
Transforming conservation
Despite the alarming overall decline in wildlife populations shown in the LPI, many populations have stabilized
or increased as a result of conservation efforts. But isolated successes and merely slowing the decline of
nature are not enough. Equally, conservation efforts that don’t take account of the rights, needs and values
of people are not likely to succeed in the long run.
Protected areas have been the cornerstone of traditional conservation efforts, and currently cover 16% of
the planet’s lands and 8% of its oceans – though their distribution is uneven and many are not effectively
managed. Target 3 of the Kunming-Montreal Global Biodiversity Framework (GBF) calls for 30% of lands,
waters and sea to be protected by 2030, while Target 2 aims to restore 30% of degraded areas by 2030.
This is an unmissable opportunity to scale up effective conservation to unprecedented levels.
Countries need to extend, enhance, connect and properly fund their systems of protected areas, while
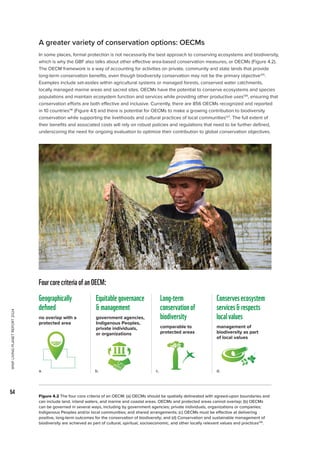
respecting the rights and needs of the people affected. Formal protection is not always the best approach,
however, which is why the GBF target also allows for other effective area-based conservation measures, or
OECMs. Supporting the rights of Indigenous Peoples and local communities may be one of the most effective
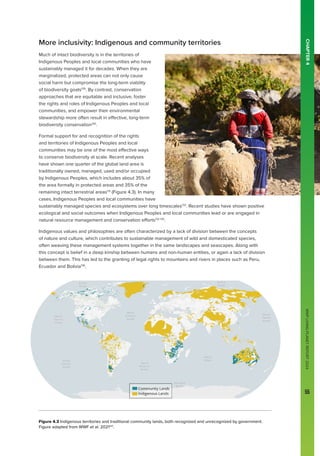
ways to conserve biodiversity at scale. A quarter of the global land area is traditionally owned, managed,
used and/or occupied by Indigenous Peoples, which includes about 35% of the area formally in protected
areas and 35% of the remaining intact terrestrial areas.
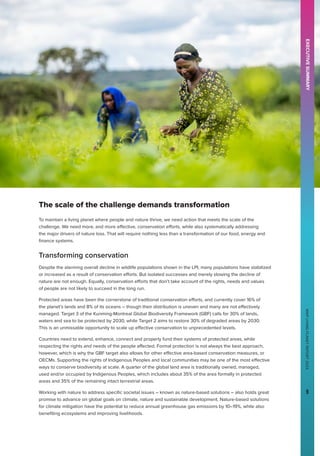
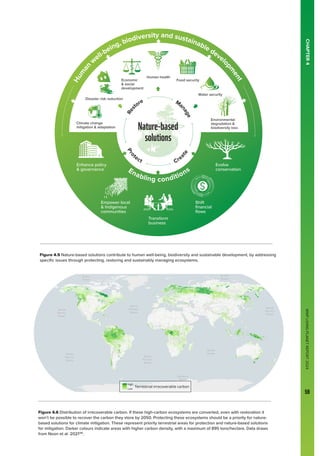
Working with nature to address specific societal issues – known as nature-based solutions – also holds great
promise to advance on global goals on climate, nature and sustainable development. Nature-based solutions
for climate mitigation have the potential to reduce annual greenhouse gas emissions by 10–19%, while also
benefiting ecosystems and improving livelihoods.
WWF
LIVING
PLANET
REPORT
2024
9
EXECUTIVE
SUMMARY
WWF
LIVING
PLANET
REPORT
2024
10
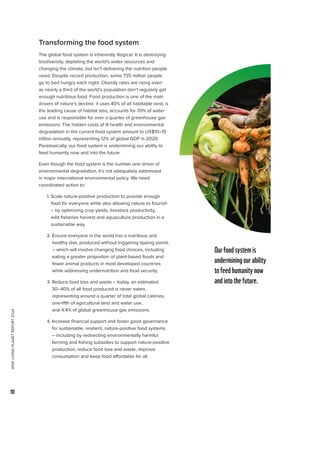
Transforming the food system
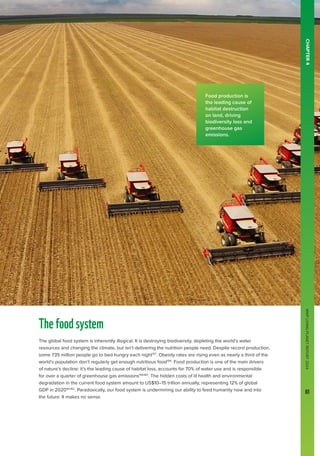
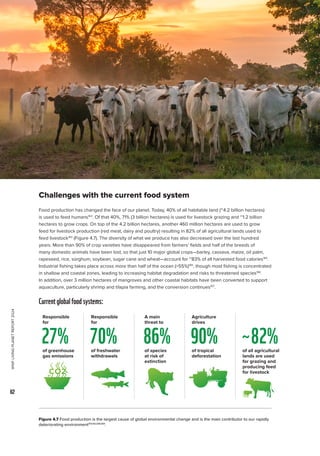
The global food system is inherently illogical. It is destroying
biodiversity, depleting the world’s water resources and
changing the climate, but isn’t delivering the nutrition people
need. Despite record production, some 735 million people
go to bed hungry each night. Obesity rates are rising even
as nearly a third of the world’s population don’t regularly get
enough nutritious food. Food production is one of the main
drivers of nature’s decline: it uses 40% of all habitable land, is
the leading cause of habitat loss, accounts for 70% of water
use and is responsible for over a quarter of greenhouse gas
emissions. The hidden costs of ill health and environmental
degradation in the current food system amount to US$10–15
trillion annually, representing 12% of global GDP in 2020.
Paradoxically, our food system is undermining our ability to
feed humanity now and into the future.
Even though the food system is the number one driver of
environmental degradation, it’s not adequately addressed
in major international environmental policy. We need
coordinated action to:
1. 
Scale nature-positive production to provide enough
food for everyone while also allowing nature to flourish
– by optimizing crop yields, livestock productivity,
wild fisheries harvest and aquaculture production in a
sustainable way.
2. 
Ensure everyone in the world has a nutritious and
healthy diet, produced without triggering tipping points
– which will involve changing food choices, including
eating a greater proportion of plant-based foods and
fewer animal products in most developed countries
while addressing undernutrition and food security.
3. 
Reduce food loss and waste – today, an estimated
30–40% of all food produced is never eaten,
representing around a quarter of total global calories,
one-fifth of agricultural land and water use,
and 4.4% of global greenhouse gas emissions.
4. 
Increase financial support and foster good governance
for sustainable, resilient, nature-positive food systems
– including by redirecting environmentally harmful
farming and fishing subsidies to support nature-positive
production, reduce food loss and waste, improve
consumption and keep food affordable for all.
Ourfoodsystemis
underminingourability
tofeedhumanitynow
andintothefuture.
WWF
LIVING
PLANET
REPORT
2024
11
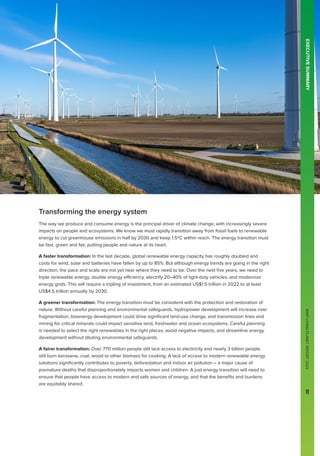
Transforming the energy system
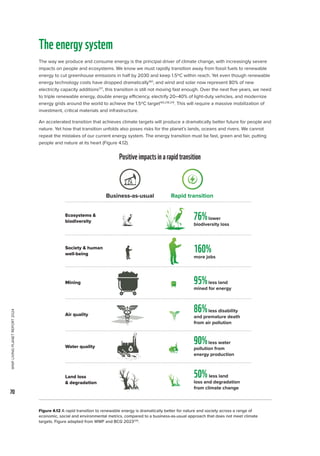
The way we produce and consume energy is the principal driver of climate change, with increasingly severe
impacts on people and ecosystems. We know we must rapidly transition away from fossil fuels to renewable
energy to cut greenhouse emissions in half by 2030 and keep 1.5ºC within reach. The energy transition must
be fast, green and fair, putting people and nature at its heart.
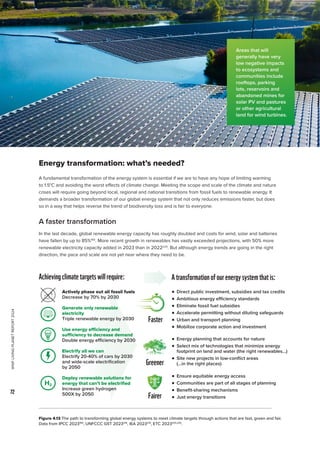
A faster transformation: In the last decade, global renewable energy capacity has roughly doubled and
costs for wind, solar and batteries have fallen by up to 85%. But although energy trends are going in the right
direction, the pace and scale are not yet near where they need to be. Over the next five years, we need to
triple renewable energy, double energy efficiency, electrify 20–40% of light-duty vehicles, and modernize
energy grids. This will require a tripling of investment, from an estimated US$1.5 trillion in 2022 to at least
US$4.5 trillion annually by 2030.
A greener transformation: The energy transition must be consistent with the protection and restoration of
nature. Without careful planning and environmental safeguards, hydropower development will increase river
fragmentation, bioenergy development could drive significant land-use change, and transmission lines and
mining for critical minerals could impact sensitive land, freshwater and ocean ecosystems. Careful planning
is needed to select the right renewables in the right places, avoid negative impacts, and streamline energy
development without diluting environmental safeguards.
A fairer transformation: Over 770 million people still lack access to electricity and nearly 3 billion people
still burn kerosene, coal, wood or other biomass for cooking. A lack of access to modern renewable energy
solutions significantly contributes to poverty, deforestation and indoor air pollution – a major cause of
premature deaths that disproportionately impacts women and children. A just energy transition will need to
ensure that people have access to modern and safe sources of energy, and that the benefits and burdens
are equitably shared.
EXECUTIVE
SUMMARY
WWF
LIVING
PLANET
REPORT
2024
11
WWF
LIVING
PLANET
REPORT
2024
12
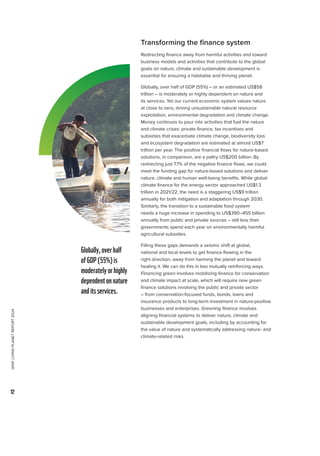
Transforming the finance system
Redirecting finance away from harmful activities and toward
business models and activities that contribute to the global
goals on nature, climate and sustainable development is
essential for ensuring a habitable and thriving planet.
Globally, over half of GDP (55%) – or an estimated US$58
trillion – is moderately or highly dependent on nature and
its services. Yet our current economic system values nature
at close to zero, driving unsustainable natural resource
exploitation, environmental degradation and climate change.
Money continues to pour into activities that fuel the nature
and climate crises: private finance, tax incentives and
subsidies that exacerbate climate change, biodiversity loss
and ecosystem degradation are estimated at almost US$7
trillion per year. The positive financial flows for nature-based
solutions, in comparison, are a paltry US$200 billion. By
redirecting just 7.7% of the negative finance flows, we could
meet the funding gap for nature-based solutions and deliver
nature, climate and human well-being benefits. While global
climate finance for the energy sector approached US$1.3
trillion in 2021/22, the need is a staggering US$9 trillion
annually for both mitigation and adaptation through 2030.
Similarly, the transition to a sustainable food system
needs a huge increase in spending to US$390–455 billion
annually from public and private sources – still less than
governments spend each year on environmentally harmful
agricultural subsidies.
Filling these gaps demands a seismic shift at global,
national and local levels to get finance flowing in the
right direction, away from harming the planet and toward
healing it. We can do this in two mutually reinforcing ways.
Financing green involves mobilizing finance for conservation
and climate impact at scale, which will require new green
finance solutions involving the public and private sector
– from conservation-focused funds, bonds, loans and
insurance products to long-term investment in nature-positive
businesses and enterprises. Greening finance involves
aligning financial systems to deliver nature, climate and
sustainable development goals, including by accounting for
the value of nature and systematically addressing nature- and
climate-related risks.
Globally,overhalf
ofGDP(55%)is
moderatelyorhighly
dependentonnature
anditsservices.
WWF
LIVING
PLANET
REPORT
2024
13
EXECUTIVE
SUMMARY
Making it happen
With every issue of the WWF Living Planet Report, we see a further decline in the state of nature and a
destabilization of the climate. This cannot continue.
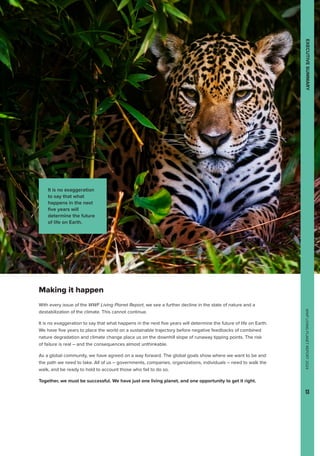
It is no exaggeration to say that what happens in the next five years will determine the future of life on Earth.
We have five years to place the world on a sustainable trajectory before negative feedbacks of combined
nature degradation and climate change place us on the downhill slope of runaway tipping points. The risk
of failure is real – and the consequences almost unthinkable.
As a global community, we have agreed on a way forward. The global goals show where we want to be and
the path we need to take. All of us – governments, companies, organizations, individuals – need to walk the
walk, and be ready to hold to account those who fail to do so.
Together, we must be successful. We have just one living planet, and one opportunity to get it right.
EXECUTIVE
SUMMARY
WWF
LIVING
PLANET
REPORT
2024
13
It is no exaggeration
to say that what
happens in the next
five years will
determine the future
of life on Earth.
WWF
LIVING
PLANET
REPORT
2024
14
FOREWORD
A system in peril.
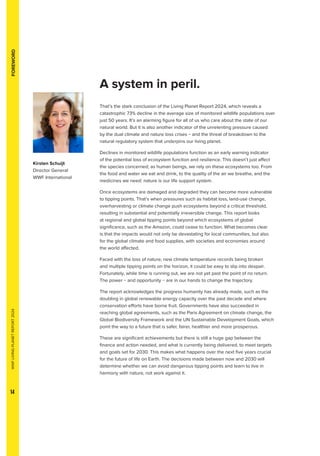
That’s the stark conclusion of the Living Planet Report 2024, which reveals a
catastrophic 73% decline in the average size of monitored wildlife populations over
just 50 years. It’s an alarming figure for all of us who care about the state of our
natural world. But it is also another indicator of the unrelenting pressure caused
by the dual climate and nature loss crises − and the threat of breakdown to the
natural regulatory system that underpins our living planet.
Declines in monitored wildlife populations function as an early warning indicator
of the potential loss of ecosystem function and resilience. This doesn’t just affect
the species concerned; as human beings, we rely on these ecosystems too. From
the food and water we eat and drink, to the quality of the air we breathe, and the
medicines we need: nature is our life support system.
Once ecosystems are damaged and degraded they can become more vulnerable
to tipping points. That’s when pressures such as habitat loss, land-use change,
overharvesting or climate change push ecosystems beyond a critical threshold,
resulting in substantial and potentially irreversible change. This report looks
at regional and global tipping points beyond which ecosystems of global
significance, such as the Amazon, could cease to function. What becomes clear
is that the impacts would not only be devastating for local communities, but also
for the global climate and food supplies, with societies and economies around
the world affected.
Faced with the loss of nature, new climate temperature records being broken
and multiple tipping points on the horizon, it could be easy to slip into despair.
Fortunately, while time is running out, we are not yet past the point of no return.
The power − and opportunity − are in our hands to change the trajectory.
The report acknowledges the progress humanity has already made, such as the
doubling in global renewable energy capacity over the past decade and where
conservation efforts have borne fruit. Governments have also succeeded in
reaching global agreements, such as the Paris Agreement on climate change, the
Global Biodiversity Framework and the UN Sustainable Development Goals, which
point the way to a future that is safer, fairer, healthier and more prosperous.
These are significant achievements but there is still a huge gap between the
finance and action needed, and what is currently being delivered, to meet targets
and goals set for 2030. This makes what happens over the next five years crucial
for the future of life on Earth. The decisions made between now and 2030 will
determine whether we can avoid dangerous tipping points and learn to live in
harmony with nature, not work against it.
Kirsten Schuijt
Director General
WWF International
WWF
LIVING
PLANET
REPORT
2024
15
FOREWORD
To guide us in this endeavour, we can look to nature itself as well as to the
Indigenous Peoples and local communities whose knowledge of and deep
respect for nature guide their stewardship of it. A quarter of the global land area
is traditionally owned, managed or used by Indigenous Peoples, and when these
communities are engaged in or lead remedial action we see positive results.
Nature-based solutions − approaches which benefit biodiversity, climate and
human well-being at the same time − also hold significant potential to advance
progress on the global goals.
These efforts can only succeed if we simultaneously tackle the drivers of nature
loss and climate change by transforming our energy, food and finance systems
in a coordinated way. Let’s consider, for example, the food system: it is the
leading cause of habitat loss, accounts for 70% of water use and is responsible
for over a quarter of greenhouse gas emissions. Yet, nearly a third of the
world’s population don’t regularly get enough nutritious food and many farmers
are struggling to make ends meet. Scaling up nature-positive production and
reducing waste could allow everyone access to a nutritious and healthy diet,
produced without triggering tipping points.
The opportunities are enormous across society and sectors, but only if finance
is redirected away from fossil fuels, deforestation and unsustainable food
production towards solutions that fairly address the challenges we face. The
international biodiversity and climate summits taking place soon – COP16 and
COP29 – are an opportunity for countries to rise to the scale of the challenge by
making progress on actioning more ambitious national climate and nature plans
and driving funding − public and private − to the people that need it most.
We know what needs to be done and how to do it but it will take bold leadership
and a huge collective effort from governments, businesses and the whole of
society to meet these global goals by 2030. We can avoid the tipping points,
nature can start to recover and temperatures can be stabilized, but we must
act now, push for change and hold each other accountable. By confronting
this challenge together, we can secure a living planet for current and future
generations.
Theseeffortscan
onlysucceedifwe
simultaneouslytackle
thedriversofnatureloss
andclimatechangeby
transformingourenergy,
foodandfinancesystems
inacoordinatedway.
WWF
LIVING
PLANET
REPORT
2024
16
FOREWORD
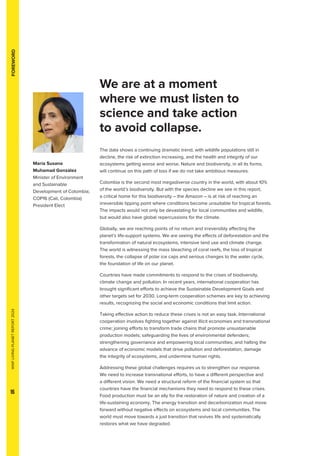
We are at a moment
where we must listen to
science and take action
to avoid collapse.
The data shows a continuing dramatic trend, with wildlife populations still in
decline, the risk of extinction increasing, and the health and integrity of our
ecosystems getting worse and worse. Nature and biodiversity, in all its forms,
will continue on this path of loss if we do not take ambitious measures.
Colombia is the second most megadiverse country in the world, with about 10%
of the world’s biodiversity. But with the species decline we see in this report,
a critical home for this biodiversity – the Amazon – is at risk of reaching an
irreversible tipping point where conditions become unsuitable for tropical forests.
The impacts would not only be devastating for local communities and wildlife,
but would also have global repercussions for the climate.
Globally, we are reaching points of no return and irreversibly affecting the
planet’s life-support systems. We are seeing the effects of deforestation and the
transformation of natural ecosystems, intensive land use and climate change.
The world is witnessing the mass bleaching of coral reefs, the loss of tropical
forests, the collapse of polar ice caps and serious changes to the water cycle,
the foundation of life on our planet.
Countries have made commitments to respond to the crises of biodiversity,
climate change and pollution. In recent years, international cooperation has
brought significant efforts to achieve the Sustainable Development Goals and
other targets set for 2030. Long-term cooperation schemes are key to achieving
results, recognizing the social and economic conditions that limit action.
Taking effective action to reduce these crises is not an easy task. International
cooperation involves fighting together against illicit economies and transnational
crime; joining efforts to transform trade chains that promote unsustainable
production models; safeguarding the lives of environmental defenders;
strengthening governance and empowering local communities; and halting the
advance of economic models that drive pollution and deforestation, damage
the integrity of ecosystems, and undermine human rights.
Addressing these global challenges requires us to strengthen our response.
We need to increase transnational efforts, to have a different perspective and
a different vision. We need a structural reform of the financial system so that
countries have the financial mechanisms they need to respond to these crises.
Food production must be an ally for the restoration of nature and creation of a
life-sustaining economy. The energy transition and decarbonization must move
forward without negative effects on ecosystems and local communities. The
world must move towards a just transition that revives life and systematically
restores what we have degraded.
María Susana
Muhamad González
Minister of Environment
and Sustainable
Development of Colombia;
COP16 (Cali, Colombia)
President Elect
WWF
LIVING
PLANET
REPORT
2024
17
FOREWORD
Nature has to be seen as our main ally; we must look to nature for solutions.
Technological solutions should not cloud our judgement or encourage the
world to continue on the same destructive path. It is urgent that we address
global problems in a comprehensive way – the struggles cannot be separated.
Investments in conservation, restoration and environmental processes are futile
if climate change continues to advance at the pace we are facing and economic
systems do not substantially contribute to changing the trajectory.
Conserving biodiversity requires the same commitment we must undertake
to decarbonize economies. We are challenged to ensure that emission
reduction targets and energy transition processes go hand in hand with nature
conservation and restoration goals. The new economic models of transition
cannot be the cause of a new era of extractivism and degradation; we must
prove that we can do better. This is about establishing a new Commons-
Public Partnership to value, learn and engage the active voice from traditional
knowledge of ethnic communities, smallholders and grassroots. We must
jointly develop and call for an innovative and transformative type of economic
system that is built around the cycles of nature with people – an economy that
reproduces life instead of destroying it. It is mandatory to shift the economic
system and rules to a nature-positive and equitable finance one.
That is why Colombia wants to invite the world to make peace with nature.
From our country’s history we know conservation, human rights and peace
must go hand in hand. Nature and conflict are increasingly interacting
since environmental degradation and biodiversity loss are drivers for social
inequalities. Conflict and insecurity contribute to degradation and these
interactions form the nature and security linkages. Nature should be at the centre
to promote peace, security, social welfare, and therefore, reduce biodiversity
loss and climate change. Making peace with nature is about understanding and
learning how we can achieve a way of living in all societies, in all cultures, in all
countries without exceeding planetary limits.
At the COP16 UN biodiversity conference, we are encouraging the broadest
possible participation of all society. We invite you all to Cali to discuss the reality
of the crisis of nature and to put these reflections at the centre of the decisions
we make. Colombia invites you to join us to create a new path together – a path
to making peace with nature, to reclaiming our relationship with the living world,
and to building the future we want.
Theworldmustmove
towardsajusttransition
thatreviveslifeand
systematicallyrestores
whatwehavedegraded.
WWF
LIVING
PLANET
REPORT
2024
18
CHAPTER1
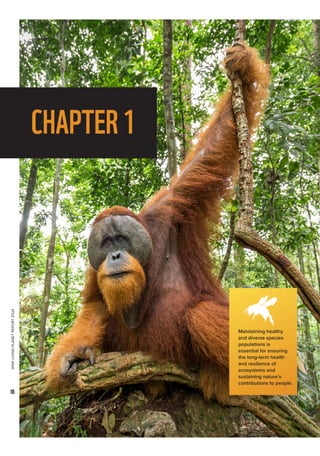
Maintaining healthy
and diverse species
populations is
essential for ensuring
the long-term health
and resilience of
ecosystems and
sustaining nature’s
contributions to people.
WWF
LIVING
PLANET
REPORT
2024
19
CHAPTER
1
Whatisbiodiversityandwhyisitimportant?
Biodiversity is the heartbeat of our living planet. The astonishing array of life on Earth is the greatest marvel in
the known universe. It also, directly and indirectly, sustains human life – from the food we eat to the fuel and
medicines we need for survival, from clean air and water to a stable climate. Our economies, our societies,
our civilizations: biodiversity underpins them all.
Biodiversity is defined as “the variability among living organisms including terrestrial, marine and other aquatic
ecosystems and the ecological complexes of which they are a part”1
. That variability includes differences
within species and ecosystems, as outlined in Box 1.1. Biodiversity, in all its forms, has direct and indirect
effects on our quality of life2
– sometimes referred to as “nature’s contributions to people”.

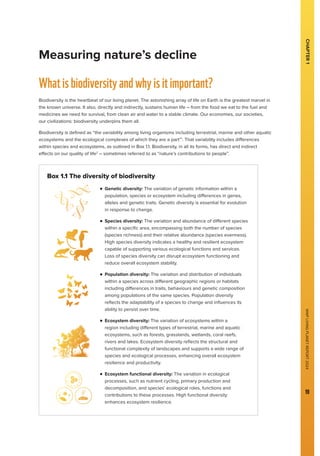
n 
Genetic diversity: The variation of genetic information within a
population, species or ecosystem including differences in genes,
alleles and genetic traits. Genetic diversity is essential for evolution
in response to change.

n 
Species diversity: The variation and abundance of different species
within a specific area, encompassing both the number of species
(species richness) and their relative abundance (species evenness).
High species diversity indicates a healthy and resilient ecosystem
capable of supporting various ecological functions and services.
Loss of species diversity can disrupt ecosystem functioning and
reduce overall ecosystem stability.

n 
Population diversity: The variation and distribution of individuals
within a species across different geographic regions or habitats
including differences in traits, behaviours and genetic composition
among populations of the same species. Population diversity
reflects the adaptability of a species to change and influences its
ability to persist over time.

n 
Ecosystem diversity: The variation of ecosystems within a
region including different types of terrestrial, marine and aquatic
ecosystems, such as forests, grasslands, wetlands, coral reefs,
rivers and lakes. Ecosystem diversity reflects the structural and
functional complexity of landscapes and supports a wide range of
species and ecological processes, enhancing overall ecosystem
resilience and productivity.

n 
Ecosystem functional diversity: The variation in ecological
processes, such as nutrient cycling, primary production and
decomposition, and species’ ecological roles, functions and
contributions to these processes. High functional diversity
enhances ecosystem resilience.
Measuring nature’s decline
Box 1.1 The diversity of biodiversity
WWF
LIVING
PLANET
REPORT
2024
20
“Nature” is a more holistic term than biodiversity that has a multitude of meanings for different peoples and
cultures around the globe, though the two terms are often used interchangeably. People perceive, experience
and interact with nature in ways that shape their understanding of how it contributes to their quality of life. As
the world’s cultures are diverse, so too is the range of values related to nature.
Nature is increasingly managed and harvested to keep pace with rising global demands for food, water,
energy, timber, fibre and more. This accelerating appropriation of nature is fraying the fabric of life on which
we all depend3
. Today’s policies and practices often disregard the multiple values of nature in favour of a
narrow set of market values focused on short-term economic growth. Non-market values associated with
nature’s contributions to people – like regulating the climate, providing water, healthy soils, or the joy and
wonder that nature inspires – are overlooked and undermined. For our own sakes, we need to embrace
the diverse values of nature and ensure these are reflected in public policy, private sector investments and
individual actions at local, national and global scales4
.
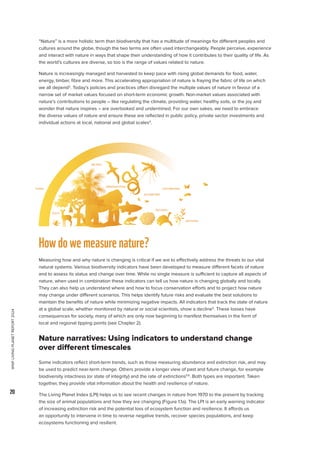
Howdowemeasurenature?
Measuring how and why nature is changing is critical if we are to effectively address the threats to our vital
natural systems. Various biodiversity indicators have been developed to measure different facets of nature
and to assess its status and change over time. While no single measure is sufficient to capture all aspects of
nature, when used in combination these indicators can tell us how nature is changing globally and locally.
They can also help us understand where and how to focus conservation efforts and to project how nature
may change under different scenarios. This helps identify future risks and evaluate the best solutions to
maintain the benefits of nature while minimizing negative impacts. All indicators that track the state of nature
at a global scale, whether monitored by natural or social scientists, show a decline3
. These losses have
consequences for society, many of which are only now beginning to manifest themselves in the form of
local and regional tipping points (see Chapter 2).
Nature narratives: Using indicators to understand change
over different timescales
Some indicators reflect short-term trends, such as those measuring abundance and extinction risk, and may
be used to predict near-term change. Others provide a longer view of past and future change, for example
biodiversity intactness (or state of integrity) and the rate of extinctions5,6
. Both types are important. Taken
together, they provide vital information about the health and resilience of nature.
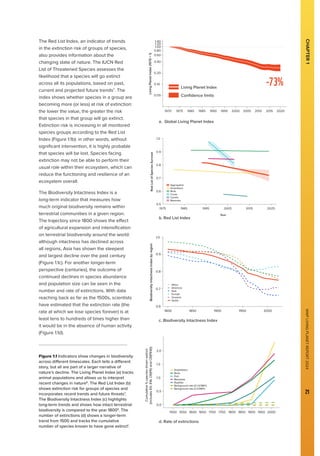
The Living Planet Index (LPI) helps us to see recent changes in nature from 1970 to the present by tracking
the size of animal populations and how they are changing (Figure 1.1a). The LPI is an early warning indicator
of increasing extinction risk and the potential loss of ecosystem function and resilience. It affords us
an opportunity to intervene in time to reverse negative trends, recover species populations, and keep
ecosystems functioning and resilient.
METRES
KILOMETRES
YEARS
ARCHIVES
DAYS
DECADES
OBSERVATIONS
CENTIMETRES
WWF
LIVING
PLANET
REPORT
2024
21
The Red List Index, an indicator of trends
in the extinction risk of groups of species,
also provides information about the
changing state of nature. The IUCN Red
List of Threatened Species assesses the
likelihood that a species will go extinct
across all its populations, based on past,
current and projected future trends7
. The
index shows whether species in a group are
becoming more (or less) at risk of extinction:
the lower the value, the greater the risk
that species in that group will go extinct.
Extinction risk is increasing in all monitored
species groups according to the Red List
Index (Figure 1.1b): in other words, without
significant intervention, it is highly probable
that species will be lost. Species facing
extinction may not be able to perform their
usual role within their ecosystem, which can
reduce the functioning and resilience of an
ecosystem overall.
The Biodiversity Intactness Index is a
long-term indicator that measures how
much original biodiversity remains within
terrestrial communities in a given region.
The trajectory since 1800 shows the effect
of agricultural expansion and intensification
on terrestrial biodiversity around the world:
although intactness has declined across
all regions, Asia has shown the steepest
and largest decline over the past century
(Figure 1.1c). For another longer-term
perspective (centuries), the outcome of
continued declines in species abundance
and population size can be seen in the
number and rate of extinctions. With data
reaching back as far as the 1500s, scientists
have estimated that the extinction rate (the
rate at which we lose species forever) is at
least tens to hundreds of times higher than
it would be in the absence of human activity
(Figure 1.1d).
Figure 1.1 Indicators show changes in biodiversity
across different timescales. Each tells a different
story, but all are part of a larger narrative of
nature’s decline. The Living Planet Index (a) tracks
animal populations and allows us to interpret
recent changes in nature8
. The Red List Index (b)
shows extinction risk for groups of species and
incorporates recent trends and future threats7
.
The Biodiversity Intactness Index (c) highlights
long-term trends and shows how intact terrestrial
biodiversity is compared to the year 18009
. The
number of extinctions (d) shows a longer-term
trend from 1500 and tracks the cumulative
number of species known to have gone extinct1
.
CHAPTER
1
0.5
0.7
0.8
0.9
1.0
0.6
1975 1985 1995 2005 2015 2025
Year
Red
List
of
Species
Survival
Aggregated
Amphibians
Birds
Corals
Cycads
Mammals
Africa
Americas
Asia
Europe
Globe
Oceania
0.6
0.8
0.9
1.0
0.7
1800 1850 1900 1950 2000
Year
Biodiversity
Intactness
Index
by
region
0.0
1.0
1.5
2.0
0.5
1500 1550 1600 1650 1700 1750 1800 1850 1900 1950 2000
Year
Cumulative
%
species
driven
extinct
(includes
EX,
EW,
CR(PE)
and
CR(PEW))
Amphibians
Background rate (0.1 E/SMY)
Background rate (2 E/SMY)
Birds
Fish
Mammals
Reptiles
a. Global Living Planet Index
b. Red List Index
c. Biodiversity Intactness Index
d. Rate of extinctions
Living Planet Index
Confidence limits
0.05
0.10
0.20
0.40
0.60
0.80
1.00
1.40
1.20
1970 1975 1980 1985 1990 1995 2000 2005 2010 2015 2020
Year
Living
Planet
Index
(1970
=
1)
Global Living Planet Index
-73%
WWF
LIVING
PLANET
REPORT
2024
22
Nature narratives: from populations to ecosystem function
Species populations contribute to the functioning of ecosystems and provide vital contributions to people
through their interactions with each other and their environment (Box 1.2). Maintaining healthy and diverse
populations is essential for ensuring the long-term health and resilience of ecosystems and sustaining
nature’s contributions to people.
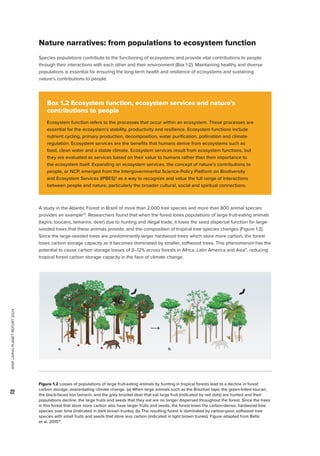
A study in the Atlantic Forest in Brazil of more than 2,000 tree species and more than 800 animal species
provides an example10
. Researchers found that when the forest loses populations of large fruit-eating animals
(tapirs, toucans, tamarins, deer) due to hunting and illegal trade, it loses the seed dispersal function for large-
seeded trees that these animals provide, and the composition of tropical tree species changes (Figure 1.2).
Since the large-seeded trees are predominantly larger hardwood trees which store more carbon, the forest
loses carbon storage capacity as it becomes dominated by smaller, softwood trees. This phenomenon has the
potential to cause carbon storage losses of 2–12% across forests in Africa, Latin America and Asia11
, reducing
tropical forest carbon storage capacity in the face of climate change.
Box 1.2 Ecosystem function, ecosystem services and nature’s
contributions to people
Ecosystem function refers to the processes that occur within an ecosystem. These processes are
essential for the ecosystem’s stability, productivity and resilience. Ecosystem functions include
nutrient cycling, primary production, decomposition, water purification, pollination and climate
regulation. Ecosystem services are the benefits that humans derive from ecosystems such as
food, clean water and a stable climate. Ecosystem services result from ecosystem functions, but
they are evaluated as services based on their value to humans rather than their importance to
the ecosystem itself. Expanding on ecosystem services, the concept of nature’s contributions to
people, or NCP, emerged from the Intergovernmental Science-Policy Platform on Biodiversity
and Ecosystem Services (IPBES)3
as a way to recognize and value the full range of interactions
between people and nature, particularly the broader cultural, social and spiritual connections.
Figure 1.2 Losses of populations of large fruit-eating animals by hunting in tropical forests lead to a decline in forest
carbon storage, exacerbating climate change. (a) When large animals such as the Brazilian tapir, the green-billed toucan,
the black-faced lion tamarin, and the grey brocket deer that eat large fruit (indicated by red dots) are hunted and their
populations decline, the large fruits and seeds that they eat are no longer dispersed throughout the forest. Since the trees
in this forest that store more carbon also have larger fruits and seeds, the forest loses the carbon-dense, hardwood tree
species over time (indicated in dark brown trunks). (b) The resulting forest is dominated by carbon-poor, softwood tree
species with small fruits and seeds that store less carbon (indicated in light brown trunks). Figure adapted from Bello
et al. 201510
.
a. b.
WWF
LIVING
PLANET
REPORT
2024
23
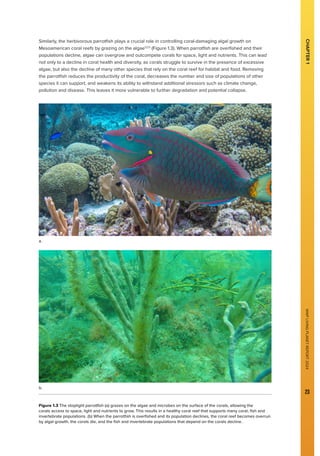
Similarly, the herbivorous parrotfish plays a crucial role in controlling coral-damaging algal growth on
Mesoamerican coral reefs by grazing on the algae12,13
(Figure 1.3). When parrotfish are overfished and their
populations decline, algae can overgrow and outcompete corals for space, light and nutrients. This can lead
not only to a decline in coral health and diversity, as corals struggle to survive in the presence of excessive
algae, but also the decline of many other species that rely on the coral reef for habitat and food. Removing
the parrotfish reduces the productivity of the coral, decreases the number and size of populations of other
species it can support, and weakens its ability to withstand additional stressors such as climate change,
pollution and disease. This leaves it more vulnerable to further degradation and potential collapse.
Figure 1.3 The stoplight parrotfish (a) grazes on the algae and microbes on the surface of the corals, allowing the
corals access to space, light and nutrients to grow. This results in a healthy coral reef that supports many coral, fish and
invertebrate populations. (b) When the parrotfish is overfished and its population declines, the coral reef becomes overrun
by algal growth, the corals die, and the fish and invertebrate populations that depend on the corals decline.
CHAPTER
1
a.
b.
WWF
LIVING
PLANET
REPORT
2024
24
TheglobalLivingPlanetIndex2024
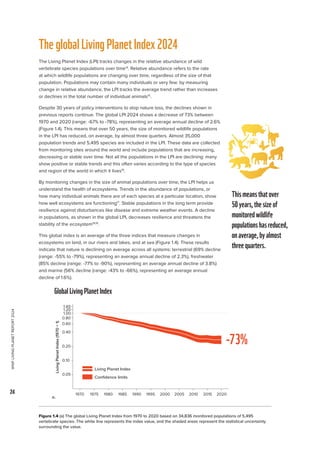
The Living Planet Index (LPI) tracks changes in the relative abundance of wild
vertebrate species populations over time14
. Relative abundance refers to the rate
at which wildlife populations are changing over time, regardless of the size of that
population. Populations may contain many individuals or very few: by measuring
change in relative abundance, the LPI tracks the average trend rather than increases
or declines in the total number of individual animals15
.
Despite 30 years of policy interventions to stop nature loss, the declines shown in
previous reports continue. The global LPI 2024 shows a decrease of 73% between
1970 and 2020 (range: -67% to -78%), representing an average annual decline of 2.6%
(Figure 1.4). This means that over 50 years, the size of monitored wildlife populations
in the LPI has reduced, on average, by almost three quarters. Almost 35,000
population trends and 5,495 species are included in the LPI. These data are collected
from monitoring sites around the world and include populations that are increasing,
decreasing or stable over time. Not all the populations in the LPI are declining: many
show positive or stable trends and this often varies according to the type of species
and region of the world in which it lives16
.
By monitoring changes in the size of animal populations over time, the LPI helps us
understand the health of ecosystems. Trends in the abundance of populations, or
how many individual animals there are of each species at a particular location, show
how well ecosystems are functioning17
. Stable populations in the long term provide
resilience against disturbances like disease and extreme weather events. A decline
in populations, as shown in the global LPI, decreases resilience and threatens the
stability of the ecosystem18,19
.
This global index is an average of the three indices that measure changes in
ecosystems on land, in our rivers and lakes, and at sea (Figure 1.4). These results
indicate that nature is declining on average across all systems: terrestrial (69% decline
(range: -55% to -79%), representing an average annual decline of 2.3%), freshwater
(85% decline (range: -77% to -90%), representing an average annual decline of 3.8%)
and marine (56% decline (range: -43% to -66%), representing an average annual
decline of 1.6%).
Figure 1.4 (a) The global Living Planet Index from 1970 to 2020 based on 34,836 monitored populations of 5,495
vertebrate species. The white line represents the index value, and the shaded areas represent the statistical uncertainty
surrounding the value.
0.05
0.10
0.20
0.40
0.60
0.80
1.00
1.40
1.20
1970 1975 1980 1985 1990 1995 2000 2005 2010 2015 2020
Year
Living
Planet
Index
(1970
=
1)
Global Living Planet Index
GlobalLivingPlanetIndex
-73%
a.
Thismeansthatover
50years,thesizeof
monitoredwildlife
populationshasreduced,
onaverage,byalmost
threequarters.
Living Planet Index
Confidence limits
WWF
LIVING
PLANET
REPORT
2024
25
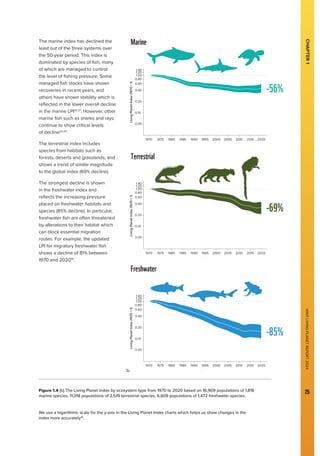
The marine index has declined the
least out of the three systems over
the 50-year period. This index is
dominated by species of fish, many
of which are managed to control
the level of fishing pressure. Some
managed fish stocks have shown
recoveries in recent years, and
others have shown stability which is
reflected in the lower overall decline
in the marine LPI20,21
. However, other
marine fish such as sharks and rays
continue to show critical levels
of decline22,23
.
The terrestrial index includes
species from habitats such as
forests, deserts and grasslands, and
shows a trend of similar magnitude
to the global index (69% decline).
The strongest decline is shown
in the freshwater index and
reflects the increasing pressure
placed on freshwater habitats and
species (85% decline). In particular,
freshwater fish are often threatened
by alterations to their habitat which
can block essential migration
routes. For example, the updated
LPI for migratory freshwater fish
shows a decline of 81% between
1970 and 202016
.
CHAPTER
1
0.05
0.10
0.20
0.40
0.60
0.80
1.00
1.40
1.20
1970 1975 1980 1985 1990 1995 2000 2005 2010 2015 2020
Year
Living
Planet
Index
(1970
=
1)
Freshwater Index
0.05
0.10
0.20
0.40
0.60
0.80
1.00
1.40
1.20
1970 1975 1980 1985 1990 1995 2000 2005 2010 2015 2020
Year
Living
Planet
Index
(1970
=
1)
Marine Index
0.05
0.10
0.20
0.40
0.60
0.80
1.00
1.40
1.20
1970 1975 1980 1985 1990 1995 2000 2005 2010 2015 2020
Year
Living
Planet
Index
(1970
=
1)
Terrestrial LPI
Freshwater
Marine
Terrestrial
-85%
-69%
-56%
b.
Figure 1.4 (b) The Living Planet Index by ecosystem type from 1970 to 2020 based on 16,909 populations of 1,816
marine species, 11,318 populations of 2,519 terrestrial species, 6,609 populations of 1,472 freshwater species.
We use a logarithmic scale for the y-axis in the Living Planet Index charts which helps us show changes in the
index more accurately16
.
WWF
LIVING
PLANET
REPORT
2024
26
Understandingdriversofchangetonature
throughregionalperspectives
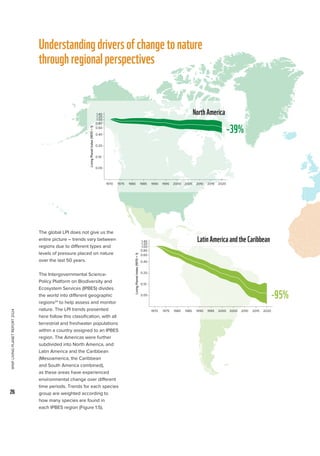
The global LPI does not give us the
entire picture – trends vary between
regions due to different types and
levels of pressure placed on nature
over the last 50 years.
The Intergovernmental Science-
Policy Platform on Biodiversity and
Ecosystem Services (IPBES) divides
the world into different geographic
regions24
to help assess and monitor
nature. The LPI trends presented
here follow this classification, with all
terrestrial and freshwater populations
within a country assigned to an IPBES
region. The Americas were further
subdivided into North America, and
Latin America and the Caribbean
(Mesoamerica, the Caribbean
and South America combined),
as these areas have experienced
environmental change over different
time periods. Trends for each species
group are weighted according to
how many species are found in
each IPBES region (Figure 1.5).
0.05
0.10
0.20
0.40
0.60
0.80
1.00
1.40
1.20
1970 1975 1980 1985 1990 1995 2000 2005 2010 2015 2020
Year
Living
Planet
Index
(1970
=
1)
North America LPI
NorthAmerica
-39%
0.05
0.10
0.20
0.40
0.60
0.80
1.00
1.40
1.20
1970 1975 1980 1985 1990 1995 2000 2005 2010 2015 2020
Year
Living
Planet
Index
(1970
=
1)
Latin America  the Caribbean LPI
LatinAmericaandtheCaribbean
-95%
WWF
LIVING
PLANET
REPORT
2024
27
CHAPTER
1
0.05
0.10
0.20
0.40
0.60
0.80
1.00
1.40
1.20
1970 1975 1980 1985 1990 1995 2000 2005 2010 2015 2020
Year
Living
Planet
Index
(1970
=
1)
Africa LPI
0.05
0.10
0.20
0.40
0.60
0.80
1.00
1.40
1.20
1970 1975 1980 1985 1990 1995 2000 2005 2010 2015 2020
Year
Living
Planet
Index
(1970
=
1)
Asia and the Pacific LPI
0.05
0.10
0.20
0.40
0.60
0.80
1.00
1.40
1.20
1970 1975 1980 1985 1990 1995 2000 2005 2010 2015 2020
Year
Living
Planet
Index
(1970
=
1)
Europe  Central Asia LPI
Africa
AsiaandthePacific
EuropeandCentralAsia
-76%
-60%
-35%
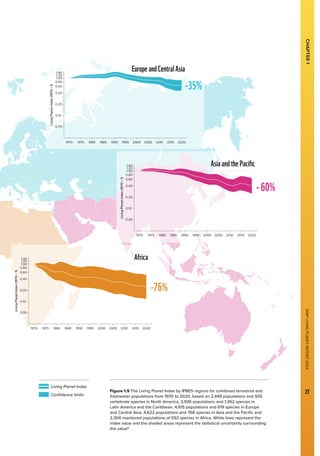
Figure 1.5 The Living Planet Index by IPBES regions for combined terrestrial and
freshwater populations from 1970 to 2020, based on 2,449 populations and 935
vertebrate species in North America, 3,936 populations and 1,362 species in
Latin America and the Caribbean, 4,615 populations and 619 species in Europe
and Central Asia, 4,622 populations and 768 species in Asia and the Pacific and
2,304 monitored populations of 552 species in Africa. White lines represent the
index value and the shaded areas represent the statistical uncertainty surrounding
the value8
.
Living Planet Index
Confidence limits
WWF
LIVING
PLANET
REPORT
2024
28
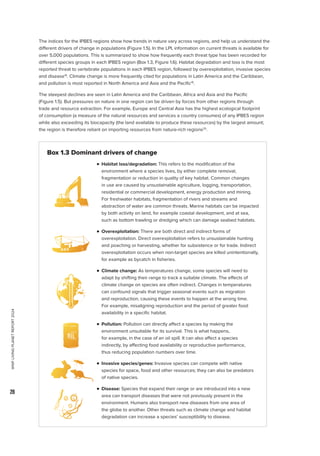
The indices for the IPBES regions show how trends in nature vary across regions, and help us understand the
different drivers of change in populations (Figure 1.5). In the LPI, information on current threats is available for
over 5,000 populations. This is summarized to show how frequently each threat type has been recorded for
different species groups in each IPBES region (Box 1.3, Figure 1.6). Habitat degradation and loss is the most
reported threat to vertebrate populations in each IPBES region, followed by overexploitation, invasive species
and disease16
. Climate change is more frequently cited for populations in Latin America and the Caribbean,
and pollution is most reported in North America and Asia and the Pacific16
.
The steepest declines are seen in Latin America and the Caribbean, Africa and Asia and the Pacific
(Figure 1.5). But pressures on nature in one region can be driven by forces from other regions through
trade and resource extraction. For example, Europe and Central Asia has the highest ecological footprint
of consumption (a measure of the natural resources and services a country consumes) of any IPBES region
while also exceeding its biocapacity (the land available to produce these resources) by the largest amount;
the region is therefore reliant on importing resources from nature-rich regions25
.

n 
Habitat loss/degradation: This refers to the modification of the
environment where a species lives, by either complete removal,
fragmentation or reduction in quality of key habitat. Common changes
in use are caused by unsustainable agriculture, logging, transportation,
residential or commercial development, energy production and mining.
For freshwater habitats, fragmentation of rivers and streams and
abstraction of water are common threats. Marine habitats can be impacted
by both activity on land, for example coastal development, and at sea,
such as bottom trawling or dredging which can damage seabed habitats.

n 
Overexploitation: There are both direct and indirect forms of
overexploitation. Direct overexploitation refers to unsustainable hunting
and poaching or harvesting, whether for subsistence or for trade. Indirect
overexploitation occurs when non-target species are killed unintentionally,
for example as bycatch in fisheries.

n 
Climate change: As temperatures change, some species will need to
adapt by shifting their range to track a suitable climate. The effects of
climate change on species are often indirect. Changes in temperatures
can confound signals that trigger seasonal events such as migration
and reproduction, causing these events to happen at the wrong time.
For example, misaligning reproduction and the period of greater food
availability in a specific habitat.
n 
Pollution: Pollution can directly affect a species by making the
environment unsuitable for its survival. This is what happens,
for example, in the case of an oil spill. It can also affect a species
indirectly, by affecting food availability or reproductive performance,
thus reducing population numbers over time.
n 
Invasive species/genes: Invasive species can compete with native
species for space, food and other resources; they can also be predators
of native species.

n 
Disease: Species that expand their range or are introduced into a new
area can transport diseases that were not previously present in the
environment. Humans also transport new diseases from one area of
the globe to another. Other threats such as climate change and habitat
degradation can increase a species’ susceptibility to disease.
Box 1.3 Dominant drivers of change
WWF
LIVING
PLANET
REPORT
2024
29

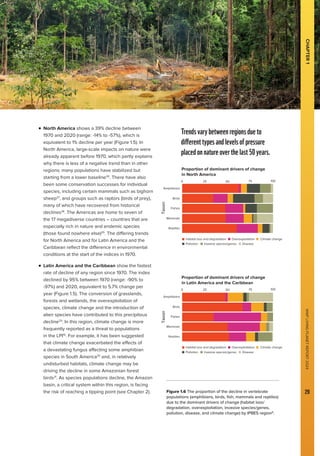
n 
North America shows a 39% decline between
1970 and 2020 (range: -14% to -57%), which is
equivalent to 1% decline per year (Figure 1.5). In
North America, large-scale impacts on nature were
already apparent before 1970, which partly explains
why there is less of a negative trend than in other
regions: many populations have stabilized but
starting from a lower baseline26
. There have also
been some conservation successes for individual
species, including certain mammals such as bighorn
sheep27
, and groups such as raptors (birds of prey),
many of which have recovered from historical
declines28
. The Americas are home to seven of
the 17 megadiverse countries – countries that are
especially rich in nature and endemic species
(those found nowhere else)29
. The differing trends
for North America and for Latin America and the
Caribbean reflect the difference in environmental
conditions at the start of the indices in 1970.
n 
Latin America and the Caribbean show the fastest
rate of decline of any region since 1970. The index
declined by 95% between 1970 (range: -90% to
-97%) and 2020, equivalent to 5.7% change per
year (Figure 1.5). The conversion of grasslands,
forests and wetlands, the overexploitation of
species, climate change and the introduction of
alien species have contributed to this precipitous
decline29
. In this region, climate change is more
frequently reported as a threat to populations
in the LPI16
. For example, it has been suggested
that climate change exacerbated the effects of
a devastating fungus affecting some amphibian
species in South America30
and, in relatively
undisturbed habitats, climate change may be
driving the decline in some Amazonian forest
birds31
. As species populations decline, the Amazon
basin, a critical system within this region, is facing
the risk of reaching a tipping point (see Chapter 2). Figure 1.6 The proportion of the decline in vertebrate
populations (amphibians, birds, fish, mammals and reptiles)
due to the dominant drivers of change (habitat loss/
degradation, overexploitation, invasive species/genes,
pollution, disease, and climate change) by IPBES region8
.
0 25 50 75 100
Amphibians
Taxon
Birds
Fishes
Mammals
Reptiles
Proportion of dominant drivers of change
in North America
Pollution
Overexploitation
Invasive species/genes
Habitat loss and degradation
Disease
Climate change
0 25 50 75 100
Amphibians
Taxon
Birds
Fishes
Mammals
Reptiles
Proportion of dominant drivers of change
in Latin America and the Caribbean
Pollution
Overexploitation
Invasive species/genes
Habitat loss and degradation
Disease
Climate change
CHAPTER
1
WWF
LIVING
PLANET
REPORT
2024
29
Trendsvarybetweenregionsdueto
differenttypesandlevelsofpressure
placedonnatureoverthelast50years.
WWF
LIVING
PLANET
REPORT
2024
30
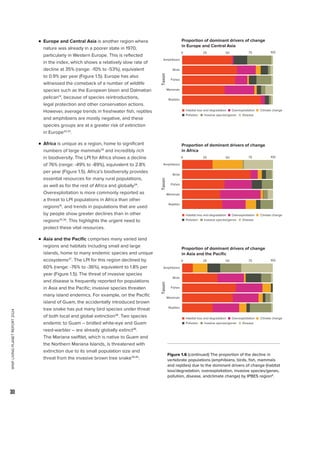
n 
Europe and Central Asia is another region where
nature was already in a poorer state in 1970,
particularly in Western Europe. This is reflected
in the index, which shows a relatively slow rate of
decline at 35% (range: -10% to -53%), equivalent
to 0.9% per year (Figure 1.5). Europe has also
witnessed the comeback of a number of wildlife
species such as the European bison and Dalmatian
pelican14
, because of species reintroductions,
legal protection and other conservation actions.
However, average trends in freshwater fish, reptiles
and amphibians are mostly negative, and these
species groups are at a greater risk of extinction
in Europe32,33
.
n Africa is unique as a region, home to significant
numbers of large mammals34
and incredibly rich
in biodiversity. The LPI for Africa shows a decline
of 76% (range: -49% to -89%), equivalent to 2.8%
per year (Figure 1.5). Africa’s biodiversity provides
essential resources for many rural populations,
as well as for the rest of Africa and globally34
.
Overexploitation is more commonly reported as
a threat to LPI populations in Africa than other
regions16
, and trends in populations that are used
by people show greater declines than in other
regions35,36
. This highlights the urgent need to
protect these vital resources.
n 
Asia and the Pacific comprises many varied land
regions and habitats including small and large
islands, home to many endemic species and unique
ecosystems37
. The LPI for this region declined by
60% (range: -76% to -36%), equivalent to 1.8% per
year (Figure 1.5). The threat of invasive species
and disease is frequently reported for populations
in Asia and the Pacific; invasive species threaten
many island endemics. For example, on the Pacific
island of Guam, the accidentally introduced brown
tree snake has put many bird species under threat
of both local and global extinction38
. Two species
endemic to Guam – bridled white-eye and Guam
reed-warbler – are already globally extinct38
.
The Mariana swiftlet, which is native to Guam and
the Northern Mariana Islands, is threatened with
extinction due to its small population size and
threat from the invasive brown tree snake39,40
.
0 25 50 75 100
Amphibians
Taxon
Birds
Fishes
Mammals
Reptiles
Proportion of dominant drivers of change
in Europe and Central Asia
Pollution
Overexploitation
Invasive species/genes
Habitat loss and degradation
Disease
Climate change
0 25 50 75 100
Amphibians
Taxon
Birds
Fishes
Mammals
Reptiles
Proportion of dominant drivers of change
in Asia and the Pacific
Pollution
Overexploitation
Invasive species/genes
Habitat loss and degradation
Disease
Climate change
0 25 50 75 100
Amphibians
Taxon
Birds
Fishes
Mammals
Reptiles
Proportion of dominant drivers of change
in Africa
Pollution
Overexploitation
Invasive species/genes
Habitat loss and degradation
Disease
Climate change
Figure 1.6 (continued) The proportion of the decline in
vertebrate populations (amphibians, birds, fish, mammals
and reptiles) due to the dominant drivers of change (habitat
loss/degradation, overexploitation, invasive species/genes,
pollution, disease, andclimate change) by IPBES region8
.
WWF
LIVING
PLANET
REPORT
2024
31
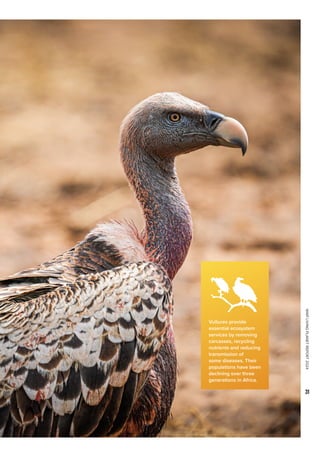
Vultures provide
essential ecosystem
services by removing
carcasses, recycling
nutrients and reducing
transmission of
some diseases. Their
populations have been
declining over three
generations in Africa.
WWF
LIVING
PLANET
REPORT
2024
32
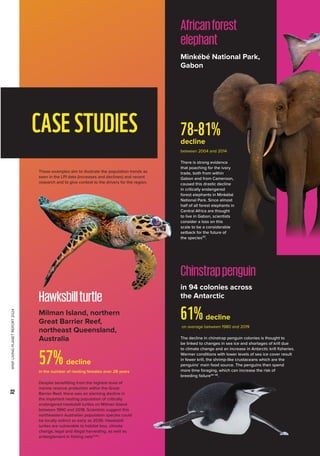
CASESTUDIES
These examples aim to illustrate the population trends as
seen in the LPI data (increases and declines) and recent
research and to give context to the drivers for the region.
Milman Island, northern
Great Barrier Reef,
northeast Queensland,
Australia
57%decline
in the number of nesting females over 28 years
Despite benefitting from the highest level of
marine reserve protection within the Great
Barrier Reef, there was an alarming decline in
the important nesting population of critically
endangered hawksbill turtles on Milman Island
between 1990 and 2018. Scientists suggest this
northeastern Australian population species could
be locally extinct as early as 2036. Hawksbill
turtles are vulnerable to habitat loss, climate
change, legal and illegal harvesting, as well as
entanglement in fishing nets41,42
.
Minkébé National Park,
Gabon
78-81%
decline
between 2004 and 2014
There is strong evidence
that poaching for the ivory
trade, both from within
Gabon and from Cameroon,
caused this drastic decline
in critically endangered
forest elephants in Minkébé
National Park. Since almost
half of all forest elephants in
Central Africa are thought
to live in Gabon, scientists
consider a loss on this
scale to be a considerable
setback for the future of
the species43
.
Hawksbillturtle
Africanforest
elephant
in 94 colonies across
the Antarctic
61%decline
on average between 1980 and 2019
The decline in chinstrap penguin colonies is thought to
be linked to changes in sea ice and shortages of krill due
to climate change and an increase in Antarctic krill fisheries.
Warmer conditions with lower levels of sea ice cover result
in fewer krill, the shrimp-like crustaceans which are the
penguins’ main food source. The penguins then spend
more time foraging, which can increase the risk of
breeding failure44–46
.
Chinstrappenguin
WWF
LIVING
PLANET
REPORT
2024
33
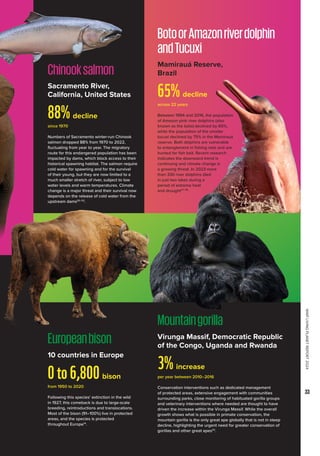
BotoorAmazonriverdolphin
andTucuxi
Chinooksalmon
Mountaingorilla
Europeanbison
10 countries in Europe
0to6,800bison
from 1950 to 2020
from 1950 to 2020
Following this species’ extinction in the wild
in 1927, this comeback is due to large-scale
breeding, reintroductions and translocations.
Most of the bison (91–100%) live in protected
areas, and the species is protected
throughout Europe14
.
Sacramento River,
California, United States
88%decline
since 1970
from 1950 to 2020
Numbers of Sacramento winter-run Chinook
salmon dropped 88% from 1970 to 2022,
fluctuating from year to year. The migratory
route for this endangered population has been
impacted by dams, which block access to their
historical spawning habitat. The salmon require
cold water for spawning and for the survival
of their young, but they are now limited to a
much smaller stretch of river, subject to low
water levels and warm temperatures. Climate
change is a major threat and their survival now
depends on the release of cold water from the
upstream dams50–52
.
Virunga Massif, Democratic Republic
of the Congo, Uganda and Rwanda
3%increase
per year between 2010–2016
from 1950 to 2020
Conservation interventions such as dedicated management
of protected areas, extensive engagement with communities
surrounding parks, close monitoring of habituated gorilla groups
and veterinary interventions where needed are thought to have
driven the increase within the Virunga Massif. While the overall
growth shows what is possible in primate conservation, the
mountain gorilla is the only great ape globally that is not in steep
decline, highlighting the urgent need for greater conservation of
gorillas and other great apes53
.
Mamirauá Reserve,
Brazil
65%decline
across 22 years
Between 1994 and 2016, the population
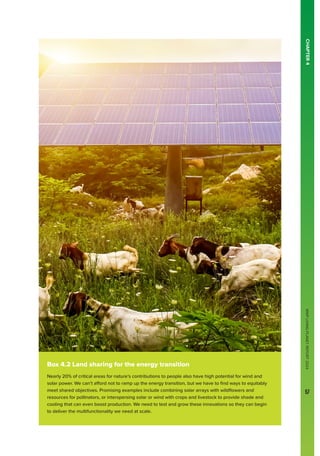
of Amazon pink river dolphins (also
known as the boto) declined by 65%,
while the population of the smaller
tucuxi declined by 75% in the Mamirauá
reserve. Both dolphins are vulnerable
to entanglement in fishing nets and are
hunted for fish bait. Recent research
indicates the downward trend is
continuing and climate change is
a growing threat. In 2023 more
than 330 river dolphins died
in just two lakes during a
period of extreme heat
and drought47–49
.
WWF
LIVING
PLANET
REPORT
2024
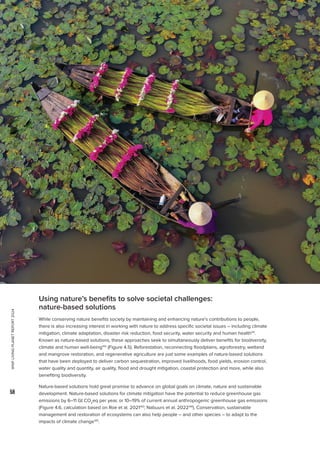
34
The Living Planet Index and other indicators discussed in the previous chapter all point to a decline in nature
and biodiversity in all its forms. While some changes may be small and gradual, their cumulative impacts can
add up to cause a larger, more important change. When cumulative impacts reach a threshold, the change
becomes self-perpetuating, resulting in substantial, often abrupt and potentially irreversible change. This is
called a tipping point54
(Figure 2.1).
Tipping points
CHAPTER2
Figure 2.1 A system remains within its
present state (A, yellow circle) even if small-
scale changes continuously occur, as long
as it can absorb the pressures (or drivers
of change). However, the pressure (B) can
either gradually, or through a shock, push
a system to its limit or tipping point (C, pink
circle). When a system reaches a tipping point
change accelerates (D) until it reaches a new
state (E, grey circle)55
.
Pressure
Tipping point
Present state
New state
A
E
C
B
D
WWF
LIVING
PLANET
REPORT
2024
35
CHAPTER
2
Tipping points in the natural world occur when individual or combined pressures such as habitat degradation,
land-use change, overharvesting or climate change push the system beyond a critical threshold. A number of
tipping points are highly likely if current trends are left to continue, with potentially catastrophic consequences.
These include global tipping points that pose grave threats to humanity and most species, and would damage
Earth’s life-support systems and destabilize societies everywhere54
. Early warning signs from monitoring and
scientific evidence indicate that six global tipping points are fast approaching (Figure 2.2):
	
n 
In the biosphere, the mass die-off of coral reefs would collapse fisheries and reduce coastal
protection for hundreds of millions of people living on the coasts56
. The Amazon rainforest
tipping point would release tonnes of carbon into the atmosphere and disrupt weather patterns
around the globe.
	
n 
In ocean circulation, the collapse of the subpolar gyre, a circular current south of Greenland, would
change weather patterns in Europe and North America. The gyre is linked to the Atlantic meridional
overturning circulation (AMOC), the main ocean current system in the Atlantic, which if shut down
would create a rapid decline in air temperatures in Europe, drying in the tropics and sea level rise.
n 
In the cryosphere (the frozen parts of the planet), the melting of the Greenland and West Antarctic
ice sheets would unleash many metres of sea level rise, while large-scale thawing of permafrost
would trigger vast emissions of carbon dioxide and methane.
Tipping points occur at local and regional as well as global levels. We read about them in the news on a
regular basis. The crash of the chinook salmon fishery in North America58
, the runaway fires in parts of the
European Mediterranean59
, coral bleaching in the Great Barrier Reef60–62
and the accelerating dieback of the
Amazon rainforest are examples of regional tipping points with significant ecological, social and economic
consequences, including lost livelihoods, reduced security and well-being, and loss of life. All are a result of
humanity’s disregard for the complex interrelationships within ecosystems and the delicate balance between
the biosphere and the atmosphere that have enabled us to thrive on this planet.
Figure 2.2 More than 25 Earth-system tipping points have been identified using evidence of past changes,
observational records and computer models in four Earth-system types – the biosphere, cryosphere (ice), ocean
circulations and atmosphere circulations. The six systems closest to tipping points are identified A-F in chronological
order in the figure of their likely occurrence. The stability of the Atlantic meridional overturning circulation (AMOC) (+) is
connected to the stability of the North Atlantic subpolar gyre (E). Figure adapted from Lenton et al. 202357
.
Tropical rainforest
Coral reefs
Biosphere
Closest to tipping - due to global warming
Greenland ice sheet
West Antarctic ice sheet
Permafrost
Cryosphere
Atlantic meridional overturning circulation (AMOC)
Subpolar gyre (SPG)
Ocean  atmosphere circulations
+
+
+
WWF
LIVING
PLANET
REPORT
2024
36
Earlywarningsignals
Crossing tipping points is not inevitable. Good monitoring can help us detect early warning signals –
ecological, climatic and social – of tipping points ahead54
. Monitoring populations of species is one way
we detect disruptions in natural processes. When populations of animals and plants decline and disappear
due to human activity, as discussed in Chapter 1, ecosystems can no longer function as they should, and
the ecosystem loses resilience. In this degraded state, the ecosystem is more susceptible to natural and
additional human disturbances, such as fire, invasive species, overharvest, pollution and climate change.
Ecological degradation combined with climate change increases the likelihood of reaching local and regional
tipping points54
. Climate-induced changes in atmospheric and water temperature, seasonality and species
composition coupled with increasingly frequent extreme weather events such as storms, drought and floods
can push degraded ecosystems into a new state. Forests can be replaced with grasslands, grasslands can
become deserts, and coral reefs can become algal reefs. In many of these transitions, species population
changes serve as early warning signals of reduced resilience in the ecosystem, making it more vulnerable to
accelerating climate change. We are seeing these dynamics leading to tipping points in terrestrial, marine and
freshwater ecosystems, as the following examples show.
North America: fire suppression, drought and pest invasion
In western North America, a century of wildfire
suppression allowed the forest understory to grow
thick and dense. When a climate change-driven, multi-
year drought took hold in the late 20th century, many
adult pine trees and understory plants succumbed63
.
The pine trees that did survive the drought were
weakened by it, making them more susceptible to
infestation by the voracious growing populations of
the pine bark beetle. As the climate warmed further,
the pine bark beetle population expanded its range
northward and upslope, killing 3.8 billion trees in its
migration path and setting the stage for a new kind of
fire (Figure 2.3)64
. The subsequent firestorms burned
the forests with such ferocity that the ecosystem
is now irreparably altered, resulting in the loss of
ecosystem function including water holding capacity
and carbon storage65
. Today, forest fires are more
frequent, more intense and cover larger areas than
at any point in the last 900 years for which records
are available66
(Figure 2.3). This dynamic, which has
become self-driven, will eventually lead to western pine forests being replaced by shrubland and grassland67
.
The benefits that people received from those forests – wood, carbon storage for climate stabilization, clean
air, water filtration and recreation – will be irretrievably lost.
Fire seasons are getting longer and extreme fire seasons more common, with recent years bringing
catastrophic events in almost every region from the tropics to the Arctic Circle. Megafires of an intensity
and extent unprecedented in recent history are becoming more common across the globe as ecosystem
degradation combined with climate-induced changes in rainfall, heat, drought, pest infestations and invasive
species propel ecosystems into a new state.
WWF
LIVING
PLANET
REPORT
2024
37
Figure 2.3 North American pine forest tipping point. (a) Western North American pine forest with dense understory from
a century of fire suppression which provides increased fuel for wildfires. (b) Percentage of area with pine damage by
watershed in the expanded range of the pine bark beetle infestation from 2000-2020. (c) Aerial photograph of dead pine
trees (brown-orange trees) killed by the combination of pine bark beetle infestation and climate change-induced drought.
(d) Aerial photograph of wildfire in the North American pine forest; fires burn more areas, hotter, and more completely due
to increased fuel load from the combination of wildfire suppression, climate change-induced pine bark beetle expansion
and drought68,69
.
CHAPTER
2
WWF
LIVING
PLANET
REPORT
2024
37
a.
c.
b.
d.
WWF
LIVING
PLANET
REPORT
2024
38
Great Barrier Reef: overfishing, pollution and warming waters
In the ocean, underwater heatwaves driven by climate change lead to warmer surface waters and cause large-
scale coral bleaching (Figure 2.4) – where heat stress causes the coral polyps to expel the symbiotic algae that live
inside them and nourish them through photosynthesis. In Australia’s Great Barrier Reef, mass bleaching events have
been observed in 1998, 2002, 2016, 2017, 2020 and 2022. By the end of the summer of 2022, 91% of the reef had
suffered bleaching. A further mass bleaching in 2024 was the most extensive in the Great Barrier Reef’s recorded
history, with widespread bleaching in the Reef’s southern region – an area that has largely been unaffected by
previous events.
The IPCC has predicted
that 70–90% of
coral reefs will die
off with even 1.5°C
of global warming.
WWF
LIVING
PLANET
REPORT
2024
39
While some reef-building corals can recover from bleaching events, others cannot, shifting the composition
of coral species on the reef and decreasing the diversity of corals and the ocean life that depend on them70
.
Each bleaching event makes it harder for corals to recover71
. Their resilience and recovery are further weakened
by other pressures, including pollution run-off from the land and overfishing of populations. The Great Barrier Reef
has shown remarkable resilience in its recovery from previous coral bleaching events but as these events are
becoming more frequent and severe, its ability will likely become increasingly impaired.
The same dynamics are playing out in other coral reefs around the globe. The Intergovernmental Panel on
Climate Change (IPCC) has predicted that 70–90% of coral reefs will die off with even 1.5°C of global warming,
though recent analysis suggests the outlook is even more dire72-74
. The loss of some of the planet’s most
biodiverse ecosystems would have severe social and economic consequences. Approximately 330 million people
depend directly on reefs for protection from storm surges, sources of food and livelihood, and other benefits56
.
Additionally, one billion people rely directly or indirectly on the global net economic value of coral reefs, which
amounts to tens of billions of dollars per year and supports industries such as tourism, commercial fisheries and
coastal development75
.
CHAPTER
2
WWF
LIVING
PLANET
REPORT
2024
39
Warming ocean
temperatures:
mass coral
bleaching
D
New state
E
Overfishing and pollution
Present state
A The tipping point:
loss of resilience
C
Drivers of
change from
human
influence
B
Figure 2.4 A coral reef remains within its present state
(A) as long as it is able to remain resilient in the face of
human-induced drivers of change such as overfishing and
pollution. When the drivers of change are sustained or
increase over time (B), resilience decreases, making the coral
more vulnerable to future pressures. Continued pressure
or a shock such as climate change-induced increase in sea
surface temperatures can push the coral reef to its tipping
point (C) in which massive coral bleaching occurs (D), leaving
the coral reef in a new, possibly irreversible state (E).
WWF
LIVING
PLANET
REPORT
2024
40
India: wetland loss, drought and flooding
In Chennai on the Bay of Bengal in eastern India, rapid urban expansion resulted in an 85% decline in the
area of wetlands (Figure 2.5a). As a result, vital services that these ecosystems provide – including retaining
water, recharging groundwater and flood regulation – were radically diminished, leaving the people of Chennai
vulnerable to both droughts and flooding made worse by climate change (Figure 2.5b)76
. When severe drought
hit the region, it caused the city’s major reservoirs to run dry and groundwater levels to plummet in 2019. Without
its wetlands to retain and recharge water supplies, the city of 11.2 million people was left vulnerable and forced to
truck in water to meet basic needs like drinking, cooking and bathing77
. Ironically, the loss of the region’s wetland
ecosystems also exposed its inhabitants to flooding from extreme rainfall events in 2015 and 202376
. Although the
amount of rainfall in 2015 was excessive, it was not unprecedented: the damage inflicted on the city was made
worse by the destruction of species-rich wetlands and natural drainage systems, which used to shield people
from the worst impacts of both droughts and floods. Recognizing their importance to the people of Chennai, the
government is now restoring the wetlands and the services they provide.
Figure 2.5 (a) Urban expansion and destruction of the wetland ecosystems in the city of Chennai between 1988 (light
red) and 2019 (dark red) led to both widespread flooding and water depletion. (b) Wetlands and their plant and animal
populations are important for storing surface water during monsoons, delivering water during the dry season, improving
water quality and controlling floods. Figure adapted from TNC 202178
.
Wetlands provide
green spaces for
outdoor recreation.
Natural habitat for flora  fauna
Carbon is stored in wetland sediments.
Breeding grounds
for migratory birds
Wetlands recharge groundwater aquifers
for water availability during the dry season.
Wetlands store surface
water for availability in
the dry season.
Wetlands are natural filters that trap nutrients,
pollutants and sediments.
b.
a. Urban expansion in Chennai
1988 2019
On 19 June 2019,
dubbed “Day Zero”,
the 11.2 million people
of Chennai went
without drinking water.
WWF
LIVING
PLANET
REPORT
2024
41
CHAPTER
2
WWF
LIVING
PLANET
REPORT
2024
41
Tippingpointswithglobalsignificance
Tipping points can have impacts that reverberate far beyond the region of origin. This is the fear for the
Amazon rainforest (Figure 2.6).
The Amazon rainforest holds more than 10% of Earth’s terrestrial biodiversity and 10% of all known fish
species79
, stores 250–300 billion tons of carbon (equivalent to 15–20 years of global greenhouse gas
emissions80
), and contributes significantly to the rainfall to the southern Amazon, Pantanal and La Plata Basin
where Rio de Janeiro, São Paulo and Buenos Aires sit81
. The Amazon is also home to over 47 million people,
including 2.2 million Indigenous and traditional inhabitants, whose cultures are deeply interwoven with nature
and who depend on the sustainable use of its resources.
Transpiration, or water vapor released from the surface of plants, creates much of the rainfall that sustains the
forest and makes it resilient to drought – as long as the rainforest remains largely intact82
. But deforestation,
forest degradation and disturbance are decreasing the resilience of the system, making it more vulnerable
to future climatic change (Figure 2.7). Resilience will be further weakened by the mass mortality events –
the sudden deaths of large numbers of animals of a single species – which large parts of the Amazon are
expected to experience due to land-use and climate change83,84
.
As climate change and deforestation lead to reduced rainfall, a tipping point could be reached where the
environmental conditions across much of the Amazon biome become unsuitable for tropical forest, triggering
an irreversible change. The impacts would be devastating, with irreversible losses of biodiversity and cultural
value, changes to regional and global weather patterns, and implications for agricultural productivity and
global food supplies. A change of this magnitude would also accelerate global climate change, as the Amazon
would shift from being a carbon sink to a source of emissions through fires and plants dying off. Up to 75
billion tons of carbon could be released into the atmosphere which would render the 1.5°C goal impossible
to achieve90
.
Figure 2.6 Current land occupied by
anthropic land uses85
(red) within the
Amazon rainforest biogeographic
boundary, which spans eight countries
and one territory. Twenty-two per cent
of the biome is in protected areas only
(dark green), 25% is in Indigenous
territories only (light green) and 6% is
in both protected areas and Indigenous
territories (hatch). Fourteen per cent of
the original forested area of the biome
was deforested by 201886
. Data from
RAISG 202287
, 202288
, 202289
.
WWF
LIVING
PLANET
REPORT
2024
42
Rain clouds
form over the ocean
and move west
Fewer trees
less moisture back
up to clouds
Deforested land
land absorbs rainfall;
clouds fail to recharge
Cumulative
deforestation and
biodiversity loss
Increased drought
distressed trees transpire less
moisture and eventually die,
driving degradation in other
regions of the forest
Evapotranspiration
moisture released from
forest recharges clouds
Are we close to an Amazon tipping point? This remains
an active area of research, but several studies suggest
a tipping point could be on the horizon if just 20–25% of
the Amazon rainforest were destroyed. Approximately
14–17% of the original forested area of the Amazon
biome has been deforested, with significant variation
in deforestation rates across the nine Amazon
countries85,86,90
. And the Brazilian Amazon which
encompasses 59% of the Amazon biome was 19%
deforested in the same time period85,86
. Deforestation
and drought create a domino effect (Figure 2.7): fewer
trees means less transpiration, which means less rainfall,
reducing the availability of water elsewhere in the forest
and causing more trees to die. This further reduces
transpiration, and so on in a vicious circle. By 2050,
up to 47% of the area of the Amazon rainforest will
likely be exposed to simultaneous disturbances
including warming temperatures, extreme droughts,
deforestation and fires92
.
Deforestation
Less rainfall
Increased drought
Cumulative deforestation
Less water recharge
from fewer trees
a.
b.
Figure 2.7 (a) The Amazon Domino Effect: In a healthy, intact forest, rain clouds form over the ocean and travel west over
the rainforest, releasing rainwater and recharging their moisture from the transpiring rainforest. This process continues
as the clouds turn south, dropping more rain. (b) Fewer trees result in less transpiration by the rainforest, less cloud
recharging and consequently less rainfall to the west and south. Less rain drives degradation in the forest to the west
and south, further contributing to ecosystem change91
.
WWF
LIVING
PLANET
REPORT
2024
43
Awake-upcall
From the ongoing decline in biodiversity to the creeping rise in global temperatures, it’s all too easy to
become accustomed to gradual change and to put off the action needed. Tipping points, whether local,
regional or planetary, can initially be gradual, but then sudden and irreversible. Ecosystems will not
instantaneously change from one state to another, but beyond a certain point of stress, change becomes
unavoidable and rapid. Knowing this should serve as a wake-up call; we cannot put off the necessary action
to avoid tipping points that will make global nature and climate goals impossible to achieve. In the case of
the Amazon, current rates of deforestation could lead to such a tipping point within a decade. We do not
currently have the policies or finance in place to end deforestation and degradation. And we know there
will be a lag between deciding on action, implementing action and seeing resultant change. The only safe
moment to act is now.
In many cases, the balance is precarious – but tipping points can still be avoided. We have an opportunity
to intervene now to increase ecosystem resilience and reduce the impacts of climate change and other
stressors before these tipping points are reached. This requires integrated solutions from local to global
level that address multiple drivers of change simultaneously. And a framework already exists in the shape of
the Global Biodiversity Framework, the Paris Climate Agreement and the Sustainable Development Goals,
if we act on these together. This is the subject of the next chapter.
CHAPTER
2
WWF
LIVING
PLANET
REPORT
2024
43
WWF
LIVING
PLANET
REPORT
2024
44
CHAPTER3
Global goals provide an
opportunity to reverse
our current trajectory,
step away from tipping
points and put the
world on a path to
sustainability.
WWF
LIVING
PLANET
REPORT
2024
45
CHAPTER
3
The nations of the world have set global goals for a thriving, sustainable future, including halting and
reversing the loss of biodiversity (under the Convention on Biological Diversity, or CBD), capping global
temperature rise to 1.5°C (under the United Nations Framework Convention on Climate Change, or
UNFCCC), and eradicating poverty and ensuring human well-being (under the Sustainable Development
Goals, or SDGs). But despite these global goals, national commitments and actions on the ground fall far
short of what’s needed to avoid the dangerous tipping points discussed in the previous chapter.
The global goals for biodiversity, climate and sustainable development all recognize that nature underpins
a stable climate and human well-being. The Kunming-Montreal Global Biodiversity Framework (GBF), under
the CBD, includes targets to conserve 30% of land and waters, complete or begin the restoration of 30%
of degraded areas, and bring human-induced species extinctions to zero by 203093
(Figure 3.1). The status
check for the Paris Climate Agreement – known as the global stocktake – explicitly recognized the GBF and
emphasizes the importance of conserving, protecting and restoring nature, including halting and reversing
deforestation and managing ecosystems to absorb carbon from the atmosphere and to help people adapt
to climate change94
. The preamble to the SDGs states that “social and economic development depends on
the sustainable management of our planet’s natural resources”, and 2 of the 17 goals specifically focus on
conserving, restoring and sustainably using ecosystems and biodiversity in the ocean and on land.
Global goals and progress
Figure 3.1 The goals and targets of the Kunming-Montreal Global Biodiversity Framework (GBF), under the CBD93
.
The GBF lists four goals and 23 targets for 2030 to conserve 30% of Earth’s lands, oceans, coastal areas and inland
waters and restore at least 30% of degraded lands and waters; to reduce pollution and invasive species by 50%; to make
production systems sustainable and to ensure benefit sharing from those systems; and to reduce harmful government
subsidies by US$500 billion annually and cut food waste by half.
Biodiversity-inclusive
spatial planning
Restore 30% of
degraded lands
Conserve 30% of
land and seas
Halt loss
,
r
e
s
t
o
r
e
n
a
t
u
r
e
Avoid
Reduce alien species
spread by 50%
Reduce pollution risks,
impacts by 50%
2030 GOAL
Conserve
2030 GOAL
U
se land and seas sust
a
i
n
a
b
l
y
Safeguard
Fair share of benefits
from genetic resources
Sustainable agriculture,
aquaculture, fisheries,
forestry
2030 GOAL
S
h
a
r
e
b
e
n
e
fi
t
s
a
nd
services
Act
Sustainable consumption,
halve food waste
Phase out “obstructive”
subsidies, increase
finance
2030 GOAL
M
o
b
i
l
i
z
e
necessary resources
WWF
LIVING
PLANET
REPORT
2024
46
In 2023, both the SDG Progress Report and the global stocktake of the Paris Agreement warned that none
of the goals under the respective agreements would be met by 2030 without drastic action. Current actions
would lead to a decidedly unsustainable, inequitable world by 205094,95
(Box 3.1). Over half the SDG targets for
2030 would be missed, with 30% of them stalled or getting worse from the 2015 baseline. And even though
74% of nations that signed onto the 2015 Paris Agreement have strengthened their commitments to reduce or
limit greenhouse gas emissions by 2030, current commitments would lead to an average global temperature
increase of almost 3°C by the end of the century, inevitably triggering multiple catastrophic tipping points94
.
The GBF, an action plan to protect, restore and sustainably use and manage ecosystems, was signed by
196 parties to the CBD in December 2022 to great fanfare. But like the Paris Agreement and the SDGs, little
actual progress has been made. A recent analysis revealed that although there have been many high-level
commitments, implementation rates are low and the promised finance isn’t nearly enough (see Chapter 5).
Most national biodiversity strategy and action plans – which countries have to produce to implement the
GBF – are incomplete, lack adequate methods and data to measure progress, and suffer from a lack of
coordinated institutional support102
.
Reaching2030onthepathwaytoasustainablefuture
Fragmented governance systems at local, national and global levels are not designed to manage complex
social and ecological systems103,104
(Box 3.2). In almost every nation, a tangled web of laws, regulations and
institutions inherited from the past presents a significant barrier to the coordinated action required today105
.
To achieve the global goals, we need to strengthen and align national laws and develop coordinated policies
and actions to deliver better outcomes for people, nature and climate. Expanding civil society inclusion,
enhancing private sector involvement and accountability and addressing pervasive issues like crime and
corruption should complement these efforts. Environmentally harmful subsidies and other perverse incentives
that undermine progress also urgently need to be addressed.
Progress on nature, climate and sustainable development goals is only possible with close coordination
designed to exploit synergies and promote collaboration, and to identify and mitigate potential trade-offs
(Box 3.3). Policies targeted to achieve only one goal can offset progress made toward others, leading to
“winners” and “losers”106,107
. Pursuing these goals in parallel without considering potential trade-offs and
opportunities is not only likely to end in failure, but also risks undermining the social, political and financial
support for pursuing the global goals54,108
.
Box 3.1 Addressing inequalities to achieve global goals
A small group of nations are responsible for the majority of global consumption96
, greenhouse gas
emissions97
and resource degradation. At the same time, there is growing poverty globally and many
people do not have their basic needs met98
. Poorer countries and poorer people bear the burden of
wealthy nations’ resource and energy use in the form of unsustainable development, environmental
degradation and climate change impacts99,100
. If we do not also address overconsumption, we will
continue to use more resources than our planet has the capacity to provide101
, we will not be able to
achieve conservation, climate and sustainability targets, and we will not be able to address poverty
and inequality. Different approaches to economic growth will be necessary to address the global
goals depending on a country’s economic status. We need to move beyond economic wealth and
GDP as the principal measures of progress, toward a well-being economy that promotes sufficiency,
shared prosperity and living in a way that regenerates nature and stabilizes the climate.
WWF
LIVING
PLANET
REPORT
2024
47
CHAPTER
3
Box 3.2 Inclusion and equity at the national level
Strategies and processes to achieve the global goals within countries must also be inclusive
and deliver equitable outcomes that reduce social, economic and political disparities. When
governments embrace consultative processes, encourage collaboration among agencies and
promote public engagement in shaping strategies, they increase buy-in and the chances of
success107
. Comprehensive assessments of how actions will impact aspects of human well-being
like health, wealth, livelihoods or culture can help design interventions with positive and enduring
impacts109,110
and avoid creating greater inequality or undermining human rights. Finally, accelerating
formal recognition of tenure rights to lands and waters controlled by Indigenous Peoples and local
communities111
will ensure they can pursue the future they want. National laws, regulations and
processes which formally acknowledge and integrate plural knowledge systems and practices
and support fairness, rights and equity increase the shared understanding necessary to achieve
shared outcomes4,112
.
WWF
LIVING
PLANET
REPORT
2024
48
Box 3.3 Trade-offs and synergies
Approaching climate, biodiversity and development goals in isolation raises the risk of conflicts
between different objectives. Examples include:
		
n Land-use conflicts: Afforestation and biofuel production to
mitigate climate change may threaten biodiversity conservation
goals by encroaching on natural habitats, or undermine food
security by displacing food crops.
		
n 
Energy and conservation: Expanding renewable energy to
meet climate goals could have adverse impacts on biodiversity
and ecosystems – including hydropower dams fragmenting
freshwater ecosystems, mining for critical minerals and new
power lines in ecologically sensitive areas.
		 n 
Equity and justice: Carbon taxes can be a way to reduce
emissions – but poorly designed measures could place a
disproportionate burden on low-income households. Protected
areas created to conserve biodiversity could drive land grabs
where land rights are not respected, and prevent neighbouring
communities from accessing good farmland, fishing grounds,
water sources and other natural resources.
With careful planning and coordination, many conflicts can be avoided and trade-offs minimized
and managed. At the same time, tackling the goals in a joined-up way opens up many potential
opportunities and synergies. Examples include:

n 
Conservation and climate action: Protecting biodiversity and ecosystems can help mitigate
climate change by preserving carbon sinks such as forests and wetlands. Equally, efforts to mitigate
climate change, such as reducing deforestation and promoting reforestation, can also contribute to
biodiversity conservation and ecosystem resilience.

n 
Clean energy access: Solar power and other renewables can provide affordable, reliable and
sustainable energy to communities who don’t currently have access to modern energy sources,
supporting socioeconomic development as well as climate goals. Energy efficiency measures can
benefit people living in energy poverty.

n 
Climate resilience and poverty reduction: Adaptation measures to address climate change impacts
can help alleviate poverty, particularly in vulnerable communities. Enhancing climate resilience
through sustainable agricultural practices, access to clean water and infrastructure development
can simultaneously support poverty reduction.
In the face of looming regional and global tipping points, it’s never been more urgent to recognize the
interconnectedness of nature, climate and human well-being and to tackle these goals in a coordinated
way. In Chapter 4, we discuss key solutions that can help us meet the global goals: better conservation;
a transformation in food production and consumption; the transition to a clean, renewable energy system;
and redirecting finance to support climate, nature and sustainable development goals. If these solutions are
integrated and coordinated across scales, there is tremendous potential to meet our 2030 global goals,
avoid dangerous tipping points and set the world on course for a sustainable future.
WWF
LIVING
PLANET
REPORT
2024
49
Snow crab and red
king crab stocks
declined in 2022 due
to a combination of
factors, including
warming from climate
change, leading to
early fisheries closures
in Alaska for the year.
WWF
LIVING
PLANET
REPORT
2024
50
CHAPTER4
To be enduring,
all transformative
solutions will need
to be inclusive,
just, equitable and
grounded in
human rights.
WWF
LIVING
PLANET
REPORT
2024
51
CHAPTER
4
To maintain and enhance species populations, ecosystem functions and nature’s contributions to people,
and to help ensure the stability of our climate and prosperity for all, we need conservation actions that meet
the scale of the challenge. Halting and reversing nature loss by 2030 requires not only achieving traditional
conservation at larger scales, but also systematically addressing the drivers of nature loss including food
production, consumption and waste, the amount and types of energy we use, and the financing to support
the transformations of these systems. To be enduring, all transformative solutions will need to be inclusive,
just, equitable and grounded in human rights.
Natureconservation
The LPI and other indicators showing nature’s decline present an uncomfortable truth. Our efforts to
conserve species and ecosystems have not kept pace with the unrelenting pressures at the heart of
their decline. To halt and reverse the loss of nature will require fundamental changes in our societies and
economies to address these pressures. It will also require new approaches to conservation, recognizing
that looking after nature isn’t optional but is critical to everybody’s well-being.
Evolving approaches to conservation
Historically, conservation has focused on protecting threatened species and habitats. These efforts have
brought many successes. Despite the alarming overall decline in species populations shown in the LPI, the
data also includes many populations that have stabilized or increased as a result of conservation efforts.
Protected and conserved areas have slowed the extinction rate for mammals, birds and amphibians by an
estimated 20–29%3
and a recent analysis showed that conservation actions have had a net positive effect113
.
But isolated successes and merely slowing the decline of nature are not enough.
The traditional approaches of the conservation sector are limited, and can even be counter-productive.
A narrow focus on species neglects the diversity of ways in which cultures around the globe understand,
value, depend on and care for nature. It also fails to account for the full range of ecosystem functions and
the benefits they provide to people. At worst, attempts to protect nature from people can infringe on
human rights and lead to conflict. The creation of protected areas, for example, has in numerous cases
displaced Indigenous Peoples and local communities from their land and deprived them of access to
natural resources114
.
Conservation efforts that don’t take account of the rights, needs and values of people will not succeed
in the long run. There is increasing recognition of the importance of people-centred and locally led
conservation that respects people’s rights, embraces diverse values and cultural perspectives and ensures
benefits are equitably shared. The British ecologist Georgina Mace describes this transition as a series
of shifts from “nature for itself” (protecting wilderness) to “nature despite people’’ (reducing pollution and
overexploitation), “nature for people” (maintaining ecosystem services) and “nature and people” (managing
socio-ecological systems)115
.
In the following sections, we describe a range of approaches that can support effective conservation at
the scale needed to halt and reverse the loss of nature and the benefits it provides to people.
Sustainable solutions
WWF
LIVING
PLANET
REPORT
2024
52
Transforming conservation
More – and more effective – protected areas
There are nearly 300,000 designated protected areas globally, covering 16% of the planet’s lands and 8% of
its oceans116
(Figure 4.1). They range from strict nature preserves, national parks and wildlife reserves to areas
with sustainable use of natural resources117
. Despite a significant expansion over recent years, protected areas
are not representative of the ecological diversity on Earth – freshwater systems, for example, are not well
covered118
. Their distribution remains uneven, and overall coverage is not sufficient to deliver the full range of
nature’s contributions to people.
Simply designating a protected area is no guarantee that nature will be protected. Many remain vulnerable to
persistent threats and lack the capacity to ensure effective management119
. In reality, some areas receive only
limited protection. In addition, the rate of loss of legal protection for established land and marine protected
areas has accelerated in the 21st century, with 247 million hectares lost globally, equivalent to 8% of current
protected areas120
.
Achieving the global goals will require a huge increase in effective protected area coverage over the next
five years. Target 3 of the GBF, the so-called 30x30 target, calls for 30% of lands, waters and sea to be
protected by 2030 “through ecologically representative, well-connected and equitably governed systems
of protected areas and other effective area-based conservation measures, recognizing indigenous and
traditional territories where applicable”93
. Target 2 aims to restore 30% of degraded areas by 2030, which
will include restoring converted areas back to natural states, and rehabilitating and improving the ecological
integrity of degraded natural areas, which can all be used to strengthen networks of protected areas and their
connectivity. This is an unmissable opportunity to scale up effective conservation to unprecedented levels –
and it must be done in ways that avoid the mistakes of the past and respect the rights of Indigenous Peoples
and local communities (Box 4.1).
Figure 4.1 Protected and conserved areas cover 27.3 million km² of terrestrial ecosystems, including land and inland
water, and 36 million km² of marine ecosystems. Additionally, reported other effective area-based conservation measures
(OECMs) cover 2.19 million km² of terrestrial ecosystems and 422,294.82 km² of marine ecosystems. Figure adapted from
UNEP-WCMC and IUCN 2024116
.
WWF
LIVING
PLANET
REPORT
2024
53
Current protected areas 2023
Outside SWSA
Within SWSA
Planned expansion
Area under negotiation
Priority focus areas
SWSA priorities
Additional SWSA
priorities under 30x30 CHAPTER
4
Box 4.1 Protected area expansion in South Africa
Recognizing that their nation’s protected area system fell short of what was needed to represent
ecosystems, achieve ecological sustainability and increase resilience to climate change, the South
African government applied systematic conservation principles to develop its protected areas expansion
strategy121
. The most recently published plan122
includes areas of intact ecosystems for human livelihoods
and well-being. Care was taken to ensure the expansion of protected areas would contribute to South
Africa’s development goals by providing important ecosystem services to people. For example, the plan
prioritized areas of land that provide water security, called strategic water source areas (SWSAs), which
cover just 10% of the region’s surface area but provide over 50% of the surface water supporting over two-
thirds of the nation’s economy. In response to the GBF’s 30x30 challenge, there will need to be increasing
emphasis on strengthening the use of other effective conservation measures to deliver multiple benefits
to people, as is demonstrated by South Africa’s SWSAs.
Box Figure 4.1 South Africa expanded its protected area system to include areas of multiple benefits for people
including strategic water source areas (SWSAs), according to the South African National Protected Area Expansion
Strategy (NPAES) under 30x30122-124
.
WWF
LIVING
PLANET
REPORT
2024
53
WWF
LIVING
PLANET
REPORT
2024
54
A greater variety of conservation options: OECMs
In some places, formal protection is not necessarily the best approach to conserving ecosystems and biodiversity,
which is why the GBF also talks about other effective area-based conservation measures, or OECMs (Figure 4.2).
The OECM framework is a way of accounting for activities on private, community and state lands that provide
long-term conservation benefits, even though biodiversity conservation may not be the primary objective125
.
Examples include set-asides within agricultural systems or managed forests, conserved water catchments,
locally managed marine areas and sacred sites. OECMs have the potential to conserve ecosystems and species
populations and maintain ecosystem function and services while providing other productive uses126
, ensuring that
conservation efforts are both effective and inclusive. Currently, there are 856 OECMs recognized and reported
in 10 countries116
(Figure 4.1) and there is potential for OECMs to make a growing contribution to biodiversity
conservation while supporting the livelihoods and cultural practices of local communities127
. The full extent of
their benefits and associated costs will rely on robust policies and regulations that need to be further defined,
underscoring the need for ongoing evaluation to optimize their contribution to global conservation objectives.
Figure 4.2 The four core criteria of an OECM: (a) OECMs should be spatially delineated with agreed-upon boundaries and
can include land, inland waters, and marine and coastal areas. OECMs and protected areas cannot overlap; (b) OECMs
can be governed in several ways, including by government agencies; private individuals, organizations or companies;
Indigenous Peoples and/or local communities; and shared arrangements; (c) OECMs must be effective at delivering
positive, long-term outcomes for the conservation of biodiversity; and (d) Conservation and sustainable management of
biodiversity are achieved as part of cultural, spiritual, socioeconomic, and other locally relevant values and practices128
.
no overlap with a
protected area
government agencies,
Indigenous Peoples,
private individuals,
or organizations
comparable to
protected areas
management of
biodiversity as part
of local values
Geographically
defined
Equitablegovernance
management
Long-term
conservationof
biodiversity
Conservesecosystem
servicesrespects
localvalues
FourcorecriteriaofanOECM:
a. b. c. d.
WWF
LIVING
PLANET
REPORT
2024
55
More inclusivity: Indigenous and community territories
Much of intact biodiversity is in the territories of
Indigenous Peoples and local communities who have
sustainably managed it for decades. When they are
marginalized, protected areas can not only cause
social harm but compromise the long-term viability
of biodiversity goals129
. By contrast, conservation
approaches that are equitable and inclusive, foster
the rights and roles of Indigenous Peoples and local
communities, and empower their environmental
stewardship more often result in effective, long-term
biodiversity conservation130
.
Formal support for and recognition of the rights
and territories of Indigenous Peoples and local
communities may be one of the most effective ways
to conserve biodiversity at scale. Recent analyses
have shown one quarter of the global land area is
traditionally owned, managed, used and/or occupied
by Indigenous Peoples, which includes about 35% of
the area formally in protected areas and 35% of the
remaining intact terrestrial areas131
(Figure 4.3). In many
cases, Indigenous Peoples and local communities have
sustainably managed species and ecosystems over long timescales132
. Recent studies have shown positive
ecological and social outcomes when Indigenous Peoples and local communities lead or are engaged in
natural resource management and conservation efforts132-135
.
Indigenous values and philosophies are often characterized by a lack of division between the concepts
of nature and culture, which contributes to sustainable management of wild and domesticated species,
often weaving these management systems together in the same landscapes and seascapes. Along with
this concept is belief in a deep kinship between humans and non-human entities, or again a lack of division
between them. This has led to the granting of legal rights to mountains and rivers in places such as Peru,
Ecuador and Bolivia136
.
Figure 4.3 Indigenous territories and traditional community lands, both recognized and unrecognized by government.
Figure adapted from WWF et al. 2021137
.
CHAPTER
4
WWF
LIVING
PLANET
REPORT
2024
55
WWF
LIVING
PLANET
REPORT
2024
56
Nature’s contributions to people
Upscaling protected areas, OECMs and systematically taking a human-rights based approach to conservation
are urgent priorities if we are to reverse the decline in nature and avoid dangerous tipping points. Among
the challenges are identifying the most important areas and mobilizing support for these efforts. Focusing on
nature’s contributions to people is one promising approach.
With satellite data, biophysical models, and socioeconomic and cultural information, we can estimate
where and how nature supports people in meeting material needs, sustaining livelihoods, pollinating
crops, regulating and purifying water, storing carbon, providing protection from flooding, coastal storms
and other hazards, and providing opportunities and experiences we value culturally. An analysis of 14 of
nature’s contributions to people shows that 90% are provided by 30% of the planet’s lands and 24% of its
coastal waters138
(Figure 4.4). Conserving these areas would directly benefit 87% of the world’s population.
These critical areas also intersect with 96% of Indigenous and community territories, 80% of the areas most
important for climate regulation through carbon storage, and the habitats of 60% of land mammals, birds,
reptiles and amphibians.
In other words, to achieve the global goals, these areas are obvious places to amplify good stewardship
and urgently address threats to nature loss – though closer to half of Earth’s land surface needs to be
appropriately managed to provide these benefits to the total population, conserve terrestrial biodiversity
and maintain ecosystem stores of carbon139
. This will require us to look beyond protected areas as a tool to
maintain nature’s contribution to people to other opportunities – such as strengthening Indigenous and local
land tenure, payments for ecosystems services, and sustainable management. While global analyses can
support preliminary assessments and context setting, ensuring strategies for sustainable development and
conservation must be grounded in the perspectives and realities of places and communities to be effective.
Many of the diverse values of nature have yet to be mapped, and many others defy generalizations required
for global mapping, though they should still be understood and incorporated into local decision-making
for conservation140
.
Analyses of nature’s contributions to people also highlight what’s at stake for the future of conservation.
One-third of these critical natural areas are also highly suitable for development – agriculture, renewable
energy, oil and gas, mining or urban expansion139
. It’s vital that planning systems take full account of the value
of nature to transparently manage benefits and trade-offs in the design of multifunctional landscapes to meet
the needs of people while conserving nature (Box 4.2).
Figure 4.4 Nature’s contributions to people, covering 12 local and 2 global contributions, 12 on land and 3 in the sea (with
coastal risk reduction shared by both). Darker values indicate higher levels of contributions to more people. Thirty per
cent of the planet’s lands and 24% of its coastal waters provide 90% of these 14 benefits to people. Figure adapted from
Chaplin-Kramer et al. 2023138
.
WWF
LIVING
PLANET
REPORT
2024
57
CHAPTER
4
Box 4.2 Land sharing for the energy transition
Nearly 20% of critical areas for nature’s contributions to people also have high potential for wind and
solar power. We can’t afford not to ramp up the energy transition, but we have to find ways to equitably
meet shared objectives. Promising examples include combining solar arrays with wildflowers and
resources for pollinators, or interspersing solar or wind with crops and livestock to provide shade and
cooling that can even boost production. We need to test and grow these innovations so they can begin
to deliver the multifunctionality we need at scale.
WWF
LIVING
PLANET
REPORT
2024
57
WWF
LIVING
PLANET
REPORT
2024
58
Using nature’s benefits to solve societal challenges:
nature-based solutions
While conserving nature benefits society by maintaining and enhancing nature’s contributions to people,
there is also increasing interest in working with nature to address specific societal issues – including climate
mitigation, climate adaptation, disaster risk reduction, food security, water security and human health141
.
Known as nature-based solutions, these approaches seek to simultaneously deliver benefits for biodiversity,
climate and human well-being142
(Figure 4.5). Reforestation, reconnecting floodplains, agroforestry, wetland
and mangrove restoration, and regenerative agriculture are just some examples of nature-based solutions
that have been deployed to deliver carbon sequestration, improved livelihoods, food yields, erosion control,
water quality and quantity, air quality, flood and drought mitigation, coastal protection and more, while also
benefiting biodiversity.
Nature-based solutions hold great promise to advance on global goals on climate, nature and sustainable
development. Nature-based solutions for climate mitigation have the potential to reduce greenhouse gas
emissions by 6–11 Gt CO2
eq per year, or 10–19% of current annual anthropogenic greenhouse gas emissions
(Figure 4.6, calculation based on Roe et al. 2021143
; Nabuurs et al. 2022144
). Conservation, sustainable
management and restoration of ecosystems can also help people – and other species – to adapt to the
impacts of climate change145
.
WWF
LIVING
PLANET
REPORT
2024
59
Figure 4.6 Distribution of irrecoverable carbon. If these high-carbon ecosystems are converted, even with restoration it
won’t be possible to recover the carbon they store by 2050. Protecting these ecosystems should be a priority for nature-
based solutions for climate mitigation. These represent priority terrestrial areas for protection and nature-based solutions
for mitigation. Darker colours indicate areas with higher carbon density, with a maximum of 895 tons/hectare. Data draws
from Noon et al. 2021146
.
CHAPTER
4
Figure 4.5 Nature-based solutions contribute to human well-being, biodiversity and sustainable development, by addressing
specific issues through protecting, restoring and sustainably managing ecosystems.
Climate change
mitigation  adaptation
Environmental
degradation 
biodiversity loss
Disaster risk reduction
Food security
Water security
Human health
Economic
 social
development
H
u
m
a
n
w
ell-being, biodiversity and sustainable develo
p
m
e
n
t
Empower local
 Indigenous
communities
Transform
business
Shift
financial
flows
Enhance policy
 governance
Evolve
conservation
Enabling conditions
P
r
o
tect Crea
t
e
R
e
s
tore Ma
n
a
g
e
WWF
LIVING
PLANET
REPORT
2024
60
Managing tipping points
Tipping point management involves identifying and taking action to address critical transitions or abrupt
changes that result in tipping points (see Chapter 2). This could include actions to maintain ecosystem
function such as reducing the drivers of change (e.g. climate change, land-use change, pollution and
harvesting), enhancing ecosystem resilience through restoration and conservation efforts, and adaptive
management strategies147
. Methods for identifying local and regional tipping points include monitoring
ecological indicators like the LPI and conducting modelling studies to understand the relationships between
drivers of change and ecosystem responses148,149
. Tipping point management has been used in a handful
of cases, including managing fish populations to avoid runaway algal growth on coral reefs, managing
freshwater ecosystems in the face of climate change, and avoiding desertification in Mediterranean
ecosystems by limiting habitat conversion, but will become more common as the need and our capabilities
grow150-152
. It may even allow us to manage important ecosystems threatened by climate change and avoid
tipping points until atmospheric warming stabilizes in the latter half of the century153
.
Addressing drivers across all sectors for a sustainable future
All of these approaches can help deliver more effective conservation and stewardship of nature. However,
none can be successful if we don’t address the root causes of nature degradation. These include
consumption and production patterns, human population dynamics and trends, trade, technological
innovations, and inadequate or failed local to global governance3
(Box 4.3). Three of the most important
systems transformations required for achieving the global goals are explored in the following sections.
Box 4.3 Equitable transformations at the local level
Actions to deliver global goals must be locally relevant. Embracing diverse values and perspectives
for managing land, forests, fisheries, water, agriculture and other natural resources contributes to
co-developing equitable and durable local solutions1,4
. Valuing Indigenous and local knowledge can
guide more effective landscape and seascape conservation132
.
For conservation interventions to reach their full potential, they need to benefit the people involved.
This could include ensuring local communities, smallholder farmers, small-scale fishers and other natural
resource users have access to markets and financial services tailored to meet their needs, and support
to adopt technologies and develop effective business models154
. When market-based approaches aren’t
applicable, benefit-sharing mechanisms155
and compensation for nature stewardship156
can contribute to
lasting positive outcomes for people and nature.
WWF
LIVING
PLANET
REPORT
2024
61
Thefoodsystem
The global food system is inherently illogical. It is destroying biodiversity, depleting the world’s water
resources and changing the climate, but isn’t delivering the nutrition people need. Despite record production,
some 735 million people go to bed hungry each night157
. Obesity rates are rising even as nearly a third of the
world’s population don’t regularly get enough nutritious food158
. Food production is one of the main drivers
of nature’s decline: it’s the leading cause of habitat loss, accounts for 70% of water use and is responsible
for over a quarter of greenhouse gas emissions159,160
. The hidden costs of ill health and environmental
degradation in the current food system amount to US$10–15 trillion annually, representing 12% of global
GDP in 2020161,162
. Paradoxically, our food system is undermining our ability to feed humanity now and into
the future. It makes no sense.
CHAPTER
4
WWF
LIVING
PLANET
REPORT
2024
61
Food production is
the leading cause of
habitat destruction
on land, driving
biodiversity loss and
greenhouse gas
emissions.
WWF
LIVING
PLANET
REPORT
2024
62
Challenges with the current food system
Food production has changed the face of our planet. Today, 40% of all habitable land (~4.2 billion hectares)
is used to feed humans163
. Of that 40%, 71% (3 billion hectares) is used for livestock grazing and ~1.2 billion
hectares to grow crops. On top of the 4.2 billion hectares, another 460 million hectares are used to grow
feed for livestock production (red meat, dairy and poultry) resulting in 82% of all agricultural lands used to
feed livestock163
(Figure 4.7). The diversity of what we produce has also decreased over the last hundred
years. More than 90% of crop varieties have disappeared from farmers’ fields and half of the breeds of
many domestic animals have been lost, so that just 10 major global crops—barley, cassava, maize, oil palm,
rapeseed, rice, sorghum, soybean, sugar cane and wheat—account for ~83% of all harvested food calories164
.
Industrial fishing takes place across more than half of the ocean (55%)165
, though most fishing is concentrated
in shallow and coastal zones, leading to increasing habitat degradation and risks to threatened species166
.
In addition, over 3 million hectares of mangroves and other coastal habitats have been converted to support
aquaculture, particularly shrimp and tilapia farming, and the conversion continues167
.
Figure 4.7 Food production is the largest cause of global environmental change and is the main contributor to our rapidly
deteriorating environment159,163,168,169
.
Currentglobalfoodsystems:
Responsible
for
Responsible
for
A main
threat to
Agriculture
drives
of greenhouse
gas emissions
of freshwater
withdrawals
of species
at risk of
extinction
of tropical
deforestation
of all agricultural
lands are used
for grazing and
producing feed
for livestock
27% 70% 86% 90% 82%
WWF
LIVING
PLANET
REPORT
2024
63
Deforestation and habitat conversion
Food production is the leading cause of habitat destruction on land159,169
, driving biodiversity loss and
greenhouse gas emissions. Around 90% of deforestation is the result of converting forests into farmland168
mostly in the biodiverse tropics and sub-tropics169
. This is reflected in the steep declines in vertebrate
populations in the regional LPI for Latin America, Africa and Asia and the Pacific.
Deforestation and habitat conversion risk undermining food production in the long term. For example,
continued deforestation in the Amazon – mainly for cattle ranching170
– could lead to significantly drier
conditions and the risk of passing a tipping point, as discussed in Chapter 292,171
. The ensuing heatwaves
and lack of water would severely compromise agricultural production172,173
. In the neighbouring Cerrado
biome, increased conversion of forest and savannah has impacts on regional climate and water cycles174
.
Given that Brazil is the world’s largest net exporter of agricultural products175
, decreased productivity in
these two regions would disrupt food supply chains worldwide.
Freshwater depletion and habitat modification
Globally, agriculture accounts for 70% of all freshwater withdrawals176
. In many places, unsustainable
withdrawals have depleted groundwater levels177
and contributed to reduced surface water levels – more
than half the world’s lakes have experienced a drop in water levels178
– and reduced river flows. Along
with freshwater depletion, food production has resulted in the widespread modification of river systems by
agricultural infrastructure (e.g. irrigation dams, levees to secure floodplain fields), conversion of wetlands for
agriculture and aquaculture, and pollution. Together these agricultural impacts drive the loss of freshwater
biodiversity, reflected in the steep decline of the LPI for freshwater vertebrate populations (Chapter 1).
The unsustainable use of fresh water for food production could dramatically impact food production itself,
particularly as climate change disrupts rainfall patterns and exacerbates droughts. For example, in the
western United States, agriculture uses 80% of the Colorado River’s water to irrigate 15% of the nation’s
farmland, with irrigation for cattle-feed crops accounting for 55% of all water consumption in the Colorado
river basin179
. With this level of withdrawals and continued drought, the river could lose 30% of its flow by
the middle of the century and 55% by end-century180
.
Fisheries harvest
Each year, about 90 million tons of seafood is harvested from wild-capture marine and freshwater fisheries.
That production is an incredibly important source of nutrition to the world: over 3 billion people get vital
nutrients and at least 20% of their animal protein from so-called blue foods (food derived from aquatic
animals, plants or algae181
). Over 500 million people are considered “highly dependent” on marine
ecosystems for nutrition182
and 160 million people depend on freshwater fisheries for their dietary needs183
.
But fisheries have been pushed to the limit. Globally, 37.7% of marine fish stocks are classified as overfished181
.
While overexploitation directly threatens fish populations, it can also undermine the resilience of whole
marine ecosystems, making them more susceptible to crossing regional tipping points: the way that
overfishing of parrotfish has reduced the resilience of coral reefs and fisheries production in the Caribbean,
as discussed in Chapter 1, is just one example. Climate change is also pushing some regional fish stocks
toward tipping points184
: in the western Baltic, unsustainable exploitation and changing environmental
conditions have led to the collapse of cod stocks, with little hope of a rebound for a fish that is not adapted
to waters warmed by climate change185
. Freshwater fisheries are also under pressure. Populations of
migratory fishes, which make up the main volume of freshwater catch, have declined by an average of 81%
since 1970186
due to habitat alteration, overharvest, pollution and climate change183
.
CHAPTER
4
WWF
LIVING
PLANET
REPORT
2024
63
WWF
LIVING
PLANET
REPORT
2024
64
Species extinctions
Our global food system is a primary driver of biodiversity loss159
. Habitat loss driven by agriculture is a threat to
over 80% of all threatened terrestrial bird and mammal species187
(Figure 4.8), while overfishing is the leading
cause of biodiversity loss in marine ecosystems36
. The loss of wildlife poses a threat to the food system itself.
The near extinction of certain pollinators, for example, jeopardizes 5–8% of agricultural production worth
US$235–577 billion annually188
. Crop diversity is declining too: 86% of humanity’s energy intake globally comes
from just 17 crop plants189
. The loss of diversity in food crops decreases agriculture’s resilience and leaves it
more vulnerable to pests and local weather extremes1
.
Figure 4.8 Food production is the leading driver of conversion.
Commercial agriculture, cattle ranching and smallholder farming
all play a role, though their relative impact varies between regions.
Over 80% of all threatened terrestrial bird and mammal species are
threatened by habitat loss driven by agriculture169
.
Smallholder farming
Large-scale agriculture
Cattle ranching
Eastern
Australia
New Guinea –
Indonesia/PNG
Borneo –
Indonesia/Malaysia
Mekong – Cambodia
Sumatra – Indonesia
Mekong – Laos
Mekong – Myanmar
Southeast Asia
 Oceania
Amazon – Colombia
Amazon – Peru
Amazon –
Venezuela/Guyana
Maya Forests – Mexico/Guatemala
Amazon – Bolivia
Gran Chaco – Paraguay/Argentina
Amazon –
Colombia/Ecuador
Amazon – Brazil
Cerrado – Brazil
Latin America
Sub-Saharan Africa
West Africa –
Liberia/Ivory Coast/Ghana
Central Africa –
DRC/CAR
Central Africa –
Gabon/Cameroon/
Republic of Congo
Central Africa –
Angola
Central Africa –
Zambia East Africa –
Mozambique
East Africa –
Madagascar
WWF
LIVING
PLANET
REPORT
2024
65
CHAPTER
4
Food system transformation: what’s needed?
Ultimately, what we eat and how we produce it will determine the fate of humanity. But even though the
food system is the number one driver of environmental degradation, it’s not adequately addressed in major
international environmental policy. In 2019, the IPCC and IPBES highlighted the central importance of food
systems change in achieving climate and biodiversity goals by 20301
– but food is largely neglected within the
Paris Agreement and the Global Biodiversity Framework. Some countries mention agriculture in their climate
plans, but very few set targets on other aspects of the food system, such as reducing food loss and waste,
sustainable diets, or food consumption190
.
The last few years have brought a wave of reports, roadmaps and initiatives that offer positive ways to
improve food systems to meet nature, climate and development goals – from how to provide healthy diets
for 10 billion people within planetary boundaries191
to how agriculture can transition from being a source
of greenhouse gas emissions to a carbon sink192
. What’s still missing, though, is a coordinated global
agenda for food systems transformation with clear, science-based goals and targets for 2030 and beyond.
This would provide coherent direction for action at national and local level in line with global goals on climate,
biodiversity and sustainable development, as well as helping to guide private sector efforts and mobilize the
necessary finance.
Below, we propose four goals of this agenda:
1. 
Scale nature-positive production to provide enough food for everyone while also allowing
nature to flourish.
2. 
Ensure everyone in the world has a nutritious and healthy diet, produced without triggering
tipping points.
3. 
Reduce food loss and waste so that more of the food that’s produced gets eaten.
4. 
Increase financial support and foster good governance for sustainable, resilient,
nature-positive food systems.
Success on all four aims is needed in order to achieve global goals (e.g. for greenhouse gas emissions
reductions, Figure 4.9). While global goals can set the direction, local food systems vary dramatically around
the world. Solutions must be responsive to the environmental, cultural and socioeconomic conditions in that
place. And, importantly, people must be at the centre – especially the farmers and fishers who may be only
one lost harvest away from financial ruin.
WWF
LIVING
PLANET
REPORT
2024
65
Figure 4.9 Mitigation potential of shifting to nature-positive production (Production), ensuring nutritious and healthy diets
for all (Consumption), and reducing food loss and waste (Loss  waste) compared against the remaining carbon budget
for keeping global warming below 2°C and 1.5°C. Business as usual (i.e. no action taken on food systems) uses the entire
remaining carbon budget while only a food systems approach (adopting all three actions simultaneously) that is sufficiently
financed and supported by good governance will be enough to limit warming to 1.5°C. Figure adapted from WWF 2022193
.
Production
Globalemissions Mitigationpotentialoffoodsystemactionsgraduallyadoptedbetween2020and2050
Non-food
Food
Increased
yields
Healthy
amount
of
calories
Food
loss

waste
halved
Combined
implementation
(to
50%
of
potential)
Plant-rich
diets
Consumption Loss
waste
Foodsystems
approach
1.5°C
2°C
Maximum
cumulative
food and
non-food
emissions
limits for
achieving
1.5° or 2°C
temperature
targets
40%
30%
14%
48%
30% 27%
63%
~
Business-as-usual
food-based
emissions
Improved
efficiency
WWF
LIVING
PLANET
REPORT
2024
66
Nature-positive production
Avoiding further expansion means optimizing crop yields and livestock productivity in a sustainable way.
In many regions, there are opportunities to improve yields (Figure 4.10) – but this must be done in ways
that avoid putting additional stress on freshwater resources, increasing greenhouse gas emissions or
exacerbating nitrogen and phosphorus pollution. In some places, nature-positive production practices – such
as agroecology, regenerative agriculture, conservation agriculture and climate-smart farming – can increase
yields without additional inputs, while increasing diversity on the farm, restoring biodiversity and increasing
carbon storage194
. Where inputs are required, we need to better understand the capacity of natural systems to
absorb them with little or no consequences. Although research on nature-positive practices is still emerging,
early findings from studies show promising potential. One study found that farmers stand to see increased
crop yields and profits with 15–25% return on investment by transitioning to regenerative farming practices195
(Box 4.4). A suite of other studies has found similar results196
.
Figure 4.10 Yield gap ratios by country. Yield gap refers to the difference between current crop yields and potential crop
yields. Low ratios indicate large yield gaps. For example, a ratio of 0.2 indicates that a country, on average, has crop yields
that are 20% of what it is capable of producing. Green and blue represent high yields and low yield gaps while countries in
red and orange have high yield gaps. Figure adapted from Clark, Hill and Tilman 2018197
.
YIELDGAPRATIO
0.9
0.8
0.2
0.4
0.6
WWF
LIVING
PLANET
REPORT
2024
67
CHAPTER
4
In fisheries, nature-positive practices have the potential to increase production in the long term. However,
achieving this potential will only be possible if we also limit warming to 1.5°C as the impacts of ocean warming
and acidification will undermine fisheries health and production199
. One global analysis suggests that if all
fisheries were managed sustainably, an extra 16 million tonnes of seafood could be harvested from the ocean
annually, increasing the total wild catch by around one-sixth200
. Food from the sea from wild fisheries, finfish
mariculture, bivalve mariculture, and inland fisheries could increase by 18–44% per decade in live-weight
with appropriate regulations and management in all fisheries201
. As aquaculture continues to grow around
the world, the potential for lower trophic species such as molluscs and seaweed to contribute to nutritional
security is yet to be realized202
.
WWF
LIVING
PLANET
REPORT
2024
67
Box 4.4 Sustainable increases in yield
The Andhra Pradesh Community-Managed Natural Farming (APCNF) initiative in southern India is a good
example of the positive socio-economic impacts of nature-positive food production. APCNF is a state-
wide effort to support farmers to adopt agroecological practices to address multiple challenges such as
rural livelihoods, access to nutritious food, biodiversity loss, climate change, water scarcity and pollution.
It is the largest transition to agroecology in the world, involving 630,000 farmers. The impacts have been
impressive: crop diversity has doubled, yields of prime crops increased by on average 11%, farmers’ net
income increased by 49% and household dietary diversity increased198
.
Food from marine
fisheries, finfish
mariculture, bivalve
mariculture and inland
fisheries could increase
by 18–44% per decade
in live-weight with
appropriate regulations
and management.
WWF
LIVING
PLANET
REPORT
2024
68
Nutritious and healthy diets without triggering tipping points
Any gains from more sustainable food production will count for little if we don’t also address food
consumption. If everyone in the world adopted the current food consumption patterns of the world’s major
economies by 2050, we exceed the 1.5°C climate target for food-related greenhouse gas emissions by 263%
and require one to seven Earths to support us203
(Figure 4.11). There are also compelling public health reasons
to address unsustainable diets. Overconsumption, especially of fats and sugars, is driving a worldwide obesity
epidemic: over 2.5 billion adults are overweight, including 890 million living with obesity204
.
It’s possible to provide a growing global population with enough nutritious, healthy food – but it will require
different dietary shifts depending on current levels of nutrition and consumption206,207
. For developed
countries, dietary shifts need to include a greater proportion of plant-based foods and fewer animal
products163,191
. At the same time, for countries facing significant burdens of undernutrition, hunger and food
insecurity, achieving nutritious diets may require increasing consumption, including of animal-source foods163
.
Eating more sustainable diets would reduce the
amount of land needed to produce food: grazing
land, in particular, could be freed up for other
purposes, including nature restoration and carbon
sequestration163
. Seafood choices can make a
difference too: for example by prioritizing farmed
species low on the aquatic food chain, such as
bivalves (like oysters, mussels and scallops), that
produce food more quickly and with fewer inputs,
and excluding long-lived, slow-growing species
(such as Chilean sea bass, Atlantic halibut, bluefin
tuna and swordfish). These choices have the
added benefit of high levels of micronutrients
and lower levels of bioaccumulated toxins.
Achieving healthy and nutritious diets will be
heavily influenced by local cultural traditions,
individual choice and available food. WWF’s
Solving the Great Food Puzzle is dedicated to
finding local solutions to local challenges193
. In
some countries, promoting traditional foods will
be an important lever to shift diets. For example,
the National Millett Campaign in India is designed
to increase national consumption of this ancient
grain, which is good for health and highly resilient
in the face of climate change208
. In other countries,
an important area of focus is developing and
promoting healthy alternative protein sources such
as legumes and nutri-cereals, plant-based meat
alternatives, and algal species high in nutritional
value. Finally, financial incentives are needed to
increase the availability, affordability and appeal of
nutritious foods and support healthy food imports
and exports, especially in countries with limited
natural resources to grow their own food.
Planetary boundary
for food
India 0.84
Indonesia 0.90
China 1.77
1.86
2.08
2.11
2.30
2.94
3.03
3.36
3.42
3.52
3.98
4.50
4.64
5.02
5.21
5.55
6.83
7.42
Japan
Saudi Arabia
Turkey
South Korea
South Africa
Mexico
Germany
Russia
EU28
UK
Canada
Italy
France
Brazil
USA
Australia
Argentina
Figure 4.11 The number of Earths that would be needed by
2050 to support food production if all countries globally
adopted the current consumption patterns of the individual
countries listed. The orange vertical line is the planetary
climate boundary for food, indicating the maximum amount
of greenhouse gas emissions that food systems can emit
to stay within 1.5°C of warming. Figure adapted from WWF
2020163
and data from Springmann et al. 2020205
.
WWF
LIVING
PLANET
REPORT
2024
69
Food loss and waste
An estimated 30–40% of all food produced is never eaten209
, representing around a quarter of total global
calories. Embedded in lost or wasted food are one-fifth of agricultural land and water used for crops, as
well as 4.4% of global greenhouse gas emissions210
. In fishing, the incidental catch of non-target species
(commonly referred to as bycatch) results in 9 million tonnes of dead sea life (over 10% of total ocean catch)
being discarded, as well as posing a major threat to many species211
.
These numbers are staggering, but also highlight the immense environmental, economic and human health
opportunities of addressing food loss and waste. In countries where farm and fishery losses are high due
to poor infrastructure, investing in supply chain infrastructure – such as post-harvest storage technologies,
processing techniques and packaging – can make huge reductions in food loss and waste212
. For example,
in Lake Naivasha in Kenya, poor supply chain infrastructure and coordination led to nearly 50% of post-
harvest food being lost. With the construction of a fresh vegetable shop equipped with solar-powered
cooling facilities and collectively owned by 146 farmers, food loss has dropped below 10%212
.
Finance and governance
Reducing the environmental impact of food production and harvest, improving diets, and reducing food loss
and waste will require significant finance. The Food System Economics Commission estimates that US$200–
500 billion a year is needed between now and 2050161
. Of this, US$200 billion would cover investments in
developing supply chain infrastructure, extension services to support small-scale farmers, land restoration,
reduction of food loss and waste, and dietary shifts, while US$300 billion would provide financial incentives
to improve consumption and keep food affordable for the poorest. Currently, only 4% of global climate finance
or US$28.5 billion on average per year is allocated to food systems, even though they account for a third of
emissions213
. Food systems will require US$212 billion annually to just achieve the Paris Agreement214
.
While these are huge sums, more than enough finance could be made available by reallocating existing
resources. In agriculture, direct subsidies of more than US$635 billion a year are driving the excessive use of
inputs that degrade soil and water and harm human health. Subsidies for products such as soybeans, palm oil
and beef cause farmers to push into the forest frontier and are responsible for 14% of forest loss every year215
.
Fisheries subsidies are a key driver of overfishing, with an estimated US$22.2 billion of total annual subsidies
of US$35.4 billion going toward increasing the capacity of fishing fleets216
. Along with redirecting farming
and fisheries subsidies from environmentally harmful practices to increasing nature-positive production
of nutritious food, public food procurement programmes can be used to promote healthy and sustainable
production and consumption215
.
At the same time, governance needs to be strengthened. Governments need to integrate nature, climate and
nutrition into other policy areas, including agriculture, land use, health, finance and trade. Private companies
also have a critical role to play by encouraging sustainability and nature-positive practices along their
value chains, including eliminating deforestation and conversion, and tackling food loss and waste. Finally,
governments need to step up support – such as development and extension programmes and investment
in infrastructure – for small-scale farmers and fishers to enable them to participate in and benefit from
sustainable, resilient, nature-positive food systems.
WWF
LIVING
PLANET
REPORT
2024
69
WWF
LIVING
PLANET
REPORT
2024
70
Theenergysystem
The way we produce and consume energy is the principal driver of climate change, with increasingly severe
impacts on people and ecosystems. We know we must rapidly transition away from fossil fuels to renewable
energy to cut greenhouse emissions in half by 2030 and keep 1.5ºC within reach. Yet even though renewable
energy technology costs have dropped dramatically160
, and wind and solar now represent 80% of new
electricity capacity additions217
, this transition is still not moving fast enough. Over the next five years, we need
to triple renewable energy, double energy efficiency, electrify 20–40% of light-duty vehicles, and modernize
energy grids around the world to achieve the 1.5ºC target160,218,219
. This will require a massive mobilization of
investment, critical materials and infrastructure.
An accelerated transition that achieves climate targets will produce a dramatically better future for people and
nature. Yet how that transition unfolds also poses risks for the planet’s lands, oceans and rivers. We cannot
repeat the mistakes of our current energy system. The energy transition must be fast, green and fair, putting
people and nature at its heart (Figure 4.12).
Figure 4.12 A rapid transition to renewable energy is dramatically better for nature and society across a range of
economic, social and environmental metrics, compared to a business-as-usual approach that does not meet climate
targets. Figure adapted from WWF and BCG 2023220
.
Business-as-usual Rapid transition
Mining
Air quality
Water quality
Land loss
 degradation
95%less land
mined for energy
86%less disability
and premature death
from air pollution
90%less water
pollution from
energy production
50%less land
loss and degradation
from climate change
Ecosystems 
biodiversity
76%lower
biodiversity loss
Society  human
well-being
160%
more jobs
Positiveimpactsinarapidtransition
WWF
LIVING
PLANET
REPORT
2024
71
CHAPTER
4
Challenges with the current energy system
Energy from fossil fuels has underpinned economic growth since the industrial revolution – but at a
significant cost to the climate, people’s health and nature160,221
. Our current energy system is the primary driver
of climate change, with fossil fuels contributing approximately 70% of greenhouse gas emissions today160
.
Air pollution from fossil fuels is also responsible for one in five deaths worldwide, making it one of the leading
causes of global mortality222
. In addition, fossil fuel production and consumption cause harm to wildlife and
ecosystems223,224
.
Our energy system is also vulnerable to the climate change it is causing, with demand for energy projected
to increase at the same time that power generation and transmission will be challenged225
. Cooling systems
for thermal power plants will be stretched by increasing temperatures and strained water resources, and
renewable energy sources will face increased variability of solar radiation, wind and precipitation225
with
hydropower being particularly exposed to increases in both floods and droughts226
. More frequent and
severe extreme weather events will affect energy infrastructure, including transmission lines227
. In the last
year (2023), we’ve seen many of these impacts unfold, including an 8.5% decline in global hydropower
generation due to droughts228
.
WWF
LIVING
PLANET
REPORT
2024
71
Over the next five
years, we need to
triple renewable
energy, double energy
efficiency, electrify
20–40% of light-
duty vehicles, and
modernize energy
grids around the
world to achieve
the 1.5ºC target.
WWF
LIVING
PLANET
REPORT
2024
72
Figure 4.13 The path to transforming global energy systems to meet climate targets through actions that are fast, green and fair.
Data from IPCC 2023160
, UNFCCC GST 2023218
, IEA 2023219
, ETC 2023203,230
.
Energy transformation: what’s needed?
A fundamental transformation of the energy system is essential if we are to have any hope of limiting warming
to 1.5°C and avoiding the worst effects of climate change. Meeting the scope and scale of the climate and nature
crises will require going beyond local, regional and national transitions from fossil fuels to renewable energy. It
demands a broader transformation of our global energy system that not only reduces emissions faster, but does
so in a way that helps reverse the trend of biodiversity loss and is fair to everyone.
A faster transformation
In the last decade, global renewable energy capacity has roughly doubled and costs for wind, solar and batteries
have fallen by up to 85%160
. More recent growth in renewables has vastly exceeded projections, with 50% more
renewable electricity capacity added in 2023 than in 2022229
. But although energy trends are going in the right
direction, the pace and scale are not yet near where they need to be.
Achievingclimatetargetswillrequire:

Actively phase out all fossil fuels
Decrease by 70% by 2030
Generate only renewable
electricity
Triple renewable energy by 2030
Use energy efficiency and
sufficiency to decrease demand

Double energy efficiency by 2030
Electrify all we can
Electrify 20-40% of cars by 2030
and wide-scale electrification
by 2050
Deploy renewable solutions for
energy that can’t be electrified

Increase green hydrogen
500X by 2050
n 

Direct public investment, subsidies and tax credits
n 

Ambitious energy efficiency standards
n 

Eliminate fossil fuel subsidies
n 

Accelerate permitting without diluting safeguards
n 

Urban and transport planning
n 

Mobilize corporate action and investment
n 

Energy planning that accounts for nature
n 

Select mix of technologies that minimize energy
footprint on land and water (the right renewables…)
n 

Site new projects in low-conflict areas
(…in the right places)
n 

Ensure equitable energy access
n 

Communities are part of all stages of planning
n 

Benefit-sharing mechanisms
n 

Just energy transitions
Atransformationofourenergysystemthatis:
Faster
Greener
Fairer
Areas that will
generally have very
low negative impacts
to ecosystems and
communities include
rooftops, parking
lots, reservoirs and
abandoned mines for
solar PV and pastures
or other agricultural
land for wind turbines.
WWF
LIVING
PLANET
REPORT
2024
73
CHAPTER
4
According to the IPCC160
and the global stocktake of the UNFCCC218
, limiting warming to 1.5ºC will require a
tripling of renewable energy and doubling of energy efficiency by 2030. Total fossil fuel supply would need
to decrease by about 70% by 2030, the share of renewables in global electricity generation would need to
increase from 30% in 2022 to 60% in 2030, and annual energy efficiency gains would need to increase from
2% in 2022 to over 5% in 2030219
(Figure 4.13). The power sector would need to reach net zero carbon dioxide
emissions by about 2040, and we would need wide-scale electrification and the near decarbonization of the
global vehicle fleet by 2050160
. For sectors which are hard to electrify and can’t rely on renewable energy,
like aviation, shipping, and industrial processing of steel and cement, energy innovations must be rapidly
accelerated160
. Reaching these milestones would involve a massive mobilization of policy, investment and
infrastructure160
– projections include a major expansion of electricity grids from approximately 75 million
kilometres of transmission lines to over 200 million by 2050, increasing green hydrogen 500-fold and
production of critical minerals (copper, aluminium, lithium, nickel, cobalt, manganese, graphite and rare earth
elements) from 2 to 15 times, the addition of about 1.5 billion electric passenger cars, 200 million electric
trucks and buses, and total battery capacity of up to 150TWh by 2050230
.
A greener transformation
A renewable energy transformation is crucial to maintaining a safe climate – but it will also be far better for
people’s health and safety and for nature compared to our fossil energy system. For example, air pollutants
and death and disability due to air pollution will be up to 90% lower; infrastructure damage, poverty risk and
food supply costs will be up to 70% lower; and biodiversity loss will be 75% lower without climate change
impacts projected under a business-as-usual scenario220,223
.
However, poorly planned development of renewable energy could still have considerable negative impacts
on ecosystems and communities. Hydropower expansion at the level of current forecasts would be the
leading driver of river fragmentation and cause further decline of freshwater ecosystems231
. If not carefully
planned, additional bioenergy crops could drive significant land-use change, water use and biodiversity
loss232
, and transmission lines and mining for critical minerals could impact sensitive land, freshwater and
ocean ecosystems233
.
Given these potential impacts on land, ocean and river habitats, the renewable transition needs to happen
in a way that’s consistent with other objectives for sustainable development and nature conservation.
But avoiding harm to nature and people is not the only reason to pursue a just and nature-positive energy
transformation. Negative impacts from the energy transition can trigger conflicts, including protests, regulatory
delays and litigation, all of which will slow the transition234
. There is not a trade-off between a transition that
is rapid and one that is careful: to be rapid, the transition must also be careful.
A fairer transformation
The transformation of our energy system is deeply dependent on societal acceptance and change, so it
must be fair, just and equitable to be effective and enduring235
. Over 770 million people still lack access to
electricity and nearly 3 billion people still burn kerosene, coal, wood or other biomass for cooking236
. A lack
of access to modern renewable energy solutions significantly contributes to poverty, deforestation and indoor
air pollution – a major cause of premature deaths that disproportionately impacts women and children237
.
A just energy transition will need to ensure that people have access to modern and safe sources of energy.
Too often, the negative impacts of energy development and operations like mines and power plants have
fallen on low-income and marginalized communities238
. Transformational change must address and avoid
recreating the longstanding injustices and inequalities inherent in our current energy system239
. Our future
energy system will need to carefully manage the effects of change on people, and ensure that the benefits
and burdens are equitably shared.
WWF
LIVING
PLANET
REPORT
2024
74
How do we achieve a transformation that is faster, greener
and fairer?
The renewable transformation cannot repeat the mistakes of the past. Building on existing energy
transformation roadmaps (e.g. IPCC 2022160
, IEA Net Zero Roadmap 2023240
, REN21 2024241
, State of
Climate 2023242
, ETC 2023243
), we can achieve a transition that is simultaneously fast, green and fair.
Ways to go faster
Accelerating the transition will require much stronger energy policies across all levels of government.
Although the costs of renewables have dropped dramatically, governments will need to provide the
necessary incentives and financial support for a rapid transition. Examples of key policies include (1) direct
public investment, subsidies and tax credits (e.g. for renewable generation, electrification of heating and
transportation, technology innovation, energy grids and public transport infrastructure); (2) ambitious energy
efficiency standards and regulations for industrial sectors, technologies and buildings; (3) financing changes
to prioritize renewable energy systems; (4) eliminating fossil fuel subsidies and making polluters pay for
mitigation of harmful emissions; (5) banning methane flaring and venting, and exploration of new oil and gas
reserves; and (6) speeding up permitting processes without undermining safeguards (see next section).
A fast transition will also require buy-in from cities, companies and citizens. Cities occupy 3% of the Earth’s
land, but are home to more than half of the world’s population and are responsible for about three-quarters
of energy-related greenhouse gas emissions160
. With two-thirds of the infrastructure we need by 2050 yet
to be built, cities present an enormous opportunity to reduce energy-related emissions through improved
urban and transport planning, building materials and efficiency160
. Companies are also critical and will need
to invest in and support technology and infrastructure development, in addition to reducing emissions in
their own value chains160
.
With two-thirds of
the infrastructure we
need by 2050 yet to
be built, cities
present an enormous
opportunity to reduce
energy-related
emissions through
improved urban and
transport planning,
building materials
and efficiency.
WWF
LIVING
PLANET
REPORT
2024
75
CHAPTER
4
Finance is also key. Faster action will not be possible without committing large capital investment for clean
energy. To transition to net-zero emissions globally, the world needs to be investing at least US$4.5 trillion
annually by 2030 in energy efficiency, renewables and low-carbon energy, and supporting infrastructure.
In 2022, an estimated US$1.5 trillion was spent in these areas globally236
. In other words, we need to triple
our efforts.
Ways to go greener
While the energy transition will require considerable investment in new infrastructure, there are a number of
ways to ensure the transition is consistent with the protection and restoration of nature.
Energy planning that accounts for nature is central to guiding the right renewables. Planning processes that
optimize energy, nature and social objectives can select the right mix of renewable sources for a particular
energy grid, identifying options that minimize or avoid the most significant risks and impacts on land, oceans
and rivers. For example, energy system modelling can identify low-carbon and low-cost options that avoid
hydropower dams with large negative impacts on rivers244,245
and bioenergy with negative impacts on land
conversion, water and biodiversity232
. Countries can use this type of planning to identify portfolios of energy
technologies consistent with sustainable development objectives. For example, the Costa Rican Electricity
Institute developed a multi-decade energy expansion plan to guide investments in the country’s power
system246
. The plan calls for expansion of wind, solar and geothermal projects and does not include additional
hydropower, reflecting recent decisions in Costa Rica to cancel hydropower dams with large negative impacts
on rivers and Indigenous communities247
.
WWF
LIVING
PLANET
REPORT
2024
76
After selecting the right renewables, it is crucial to put them in the right places. Global-scale mapping studies
have found that much of the needed expansion of renewable energy infrastructure can occur on sites that will
cause minimal disruption to nature and communities248,249
. Areas that will generally have very low negative
impacts include rooftops, parking lots, reservoirs and abandoned mines for solar PV and pastures or other
agricultural land for wind turbines. Using available roof space alone would generate 26,800TWh, comparable
to global electricity demand in 2021250
. Regional planning processes can direct development away from areas
with value for conservation and toward these areas of low conflict248
. This can be formalized through the
creation of “renewable energy zones” which are pre-selected as appropriate for renewable development,
based both on the suitability of the resource (e.g. wind or sun) and their limited potential for conflicts with
people and nature. Examples include:

n 
The Africa Clean Energy Corridor. This regional initiative ranked areas based on resource suitability and
environmental and social risks to prioritize a set of renewable energy zones in eastern and southern Africa.
Countries can use these zones to facilitate strategic planning within their own borders while strengthening
interconnections with regional grids251
.

n 
Renewable acceleration areas in the European Union. EU member states are required to identify
“renewable acceleration areas” that avoid sensitive environmental resources and will feature shorter
approval periods251
.

n 
Solar energy zones in the southwestern United States. Regional planning for solar expansion in the
desert southwest region of the United States led to the establishment of 17 solar energy zones. Permitting
times have been reduced by more than half for projects within these zones, from an average of two years
to about ten months. This process also created “no go” areas to protect the most important habitats,
contributing to the conservation of large blocks of high-quality habitat252
.
In many countries, environmental safeguards are criticized for slowing down energy development and there
are frequent calls to reform permitting processes234,243
. There are a number of ways to streamline aspects of
the permitting process without diluting safeguards for people and nature. These include digitization, assigning
priority status to renewable projects, and better coordination between agencies or levels of government
(e.g. see Planning for Climate Commission 2023251
). The strategic planning described above can also result
in faster permitting times for projects (as in the solar expansion zones in the southwestern US) while also
promoting more integrated protections for biodiversity.
Ways to be fairer
The policies, investments and good governance practices that go along with a faster and greener transition
will also need to embed equity and inclusion for a fairer transition. Everyone should have access to affordable,
reliable, sustainable and modern energy. This will require enhanced and targeted finance from richer
countries toward renewable energy systems in developing countries, as well as financial assistance and
education in underserved communities to increase uptake of renewable technologies. Communities should
have energy technologies that match their needs, and the capacity to manage and generate income from
their energy resources253
.
A just transition must ensure that the benefits and burdens are equitably shared. This requires community
engagement at every stage of the process to ensure people have a say in the decisions that affect them.
Enabling people to raise concerns at the planning stage can help avoid or reduce negative impacts for people
and nature, reducing risk for developers and facilitating a faster transition – though there is also a need for
support and access to justice for communities who are negatively affected. Benefit-sharing mechanisms can
be an effective way to build community support. For example, in Colombia, a 2019 law requires that solar and
wind projects transfer a percentage of their sales to communities within the project’s “area of influence” while
the Philippines’ Renewable Energy Act requires that 80% of project royalties be directed toward subsidizing
power costs in affected communities251
.
WWF
LIVING
PLANET
REPORT
2024
77
Box 4.5 Mainstreaming nature and climate in laws and regulations
National governments need to align their own conservation, climate and development
priorities with the global goals on biodiversity, climate and sustainable development.
The goals need to be placed into legal, policy, planning and budgeting processes,
and achieving them will require coordination across ministries and state agencies.
Revising their national plans for implementing their climate and biodiversity
commitments by 2025 provides an opportunity for governments to better integrate
their climate and nature agendas254
. They also need to integrate nature- and climate-related goals in other
areas of policy and decision-making such as finance, commerce and trade255
and to allocate the resources
required256
. Environmentally harmful subsidies will need to be removed or substantially redesigned215
.
Policies to address poverty and inequality should also support climate and biodiversity objectives – and
vice versa.
Greenfinance
Economic activities have a tremendous impact on nature, the climate and human well-being. The finance
sector drives the economy and is an extremely powerful lever for changing how it operates and who it
benefits. Redirecting finance away from harmful activities and toward business models and activities that
contribute to the global goals on nature, climate and sustainable development is essential for ensuring a
habitable and thriving planet for generations to come (Box 4.5).
CHAPTER
4
WWF
LIVING
PLANET
REPORT
2024
77
WWF
LIVING
PLANET
REPORT
2024
78
$436bn
$200bn
$737bn
$546bn
2050
2030
2025
Current
Current NbS finance
is less than 3% of
nature-negative
finance
$200
billion
Current
nature-negative
finance
Almost
$7trillion
Annual NbS investment
needs in 2030 are
three times current
NbS finance and
less than 10% of
nature-negative
finance
Additional NbS finance (public + private)
$542
billion
$1.7
$4.9
Current NbS finance (public + private)
Current nature-negative finance (public)
Current nature-negative finance (private)
Globally, over half of GDP (55%) – or an
estimated US$58 trillion – is moderately
or highly dependent on nature and its
services257
. Yet our current economic system
values nature at close to zero, driving
unsustainable natural resource exploitation,
environmental degradation and climate
change. Money continues to pour into
activities that fuel the nature and climate
crises: negative finance flows in the
form of private finance, tax incentives,
and subsidies that exacerbate climate
change, biodiversity loss and ecosystem
degradation are estimated at almost
US$7 trillion per year, or 7% of global GDP258
(Figure 4.14). The positive financial flows for
nature-based solutions, in comparison, are
a paltry US$200 billion258
(Figure 4.14).
By redirecting just 7.7% of the negative
finance flows, we could meet the funding
gap for nature-based solutions and deliver
nature, climate and human well-being
benefits from protection, restoration and
sustainable management of our lands and
waters258
(Figure 4.15). The funding gap
for an energy transition to keep the world
within the 1.5°C target is even larger. While
global climate finance for the energy sector
approached US$1.3 trillion in 2021/22,
largely due to an increase in finance
for renewable energy and transport,
the need is a staggering US$9 trillion
annually through 2030 to finance both the
mitigation of greenhouse gas emissions
and the adaptation to the impacts of
climate change214
. Similarly, the transition
to a sustainable food system needs a huge
increase in spending to US$390–455 billion
annually from public and private sources259
–
still less than governments spend
each year on environmentally harmful
agricultural subsidies260
.
Figure 4.14 Current and future finance for nature-based solutions (NbS). Currently, US$7 trillion per year in nature-negative
finance (e.g. perverse subsidies) undermines efforts to conserve nature, while positive financing for NbS is US$200 billion
per year. Nature-positive finance needs to increase drastically to meet the global goals. Figure adapted from UNEP 2023258
.
WWF
LIVING
PLANET
REPORT
2024
79
CHAPTER
4
Filling these gaps demands a seismic shift at global, national and local levels to get finance flowing in the
right direction, away from harming the planet and toward healing it. We can do this in two mutually reinforcing
ways: financing green, or mobilizing finance for conservation and climate impact at scale, and greening
finance, or aligning financial systems to deliver nature, climate and sustainable development goals.
Figure 4.15 Additional annual investment by activity to reach global goals. Future finance needed for protection,
sustainable management and restoration through nature-based solutions each year from 2025–2050 to meet global
goals. Figure adapted from UNEP 2023258
.
Protection
Sustainable
landmanagement
Restoration
Avoided grassland conversion
Avoided peatland conversion
Avoided deforestation
Protected areas
Avoided seagrass conversion
Avoided mangrove conversion
Grazing - optimal intensity
Cover crops
Agroforestry - silvopasture
Agroforestry - silvoarable
Restoration of peatlands
Restoration of mangroves
Restoration of saltmarshes
Restoration of seagrass
Reforestation
$200bn
2022
$436bn
$546bn
$737bn
2025 2030 2050
Current
WWF
LIVING
PLANET
REPORT
2024
80

Box 4.6 Examples of initiatives for financing green
n Equity funds: The RobecoSAM Biodiversity Equities Fund from global asset
manager Robeco, with a portfolio of around 40 companies, invests in technologies,
products and services which support the sustainable use of natural resources
and ecosystem services in four areas: sustainable land use, freshwater networks,
marine systems and traceable products. Specific investments include reforestation,
wastewater treatment, hazardous waste management, aquaculture and sustainable
fishing. Robeco seeks advice from NGOs and wider partnerships to integrate biodiversity into
asset management262
.

n 
Bankable Nature Solutions: Financially viable enterprises and projects can help restore ecosystems
and biodiversity, combat climate change and contribute to people’s well-being, while also attracting
commercial investment that allows them to grow to scale; WWF refers to these as Bankable Nature
Solutions263
. These projects may need support before they can leverage commercial finance. For
instance, the Dutch Fund for Climate and Development (DFCD) enables private sector investment in
large-scale climate adaptation and mitigation projects that help strengthen ecosystem and community
resilience in developing countries vulnerable to climate change. With an initial investment of €160 million
from the Dutch Ministry of Foreign Affairs, DFCD has leveraged over €1 billion in blended finance264
.
DFCD supports projects like Concepta, part of the Brazilian company Sabará, which sources and
processes native products like açai, Brazil nuts and babassu from the Amazon, Cerrado and Caatinga
biomes, providing an economic incentive to conserve the natural ecosystems where these plants grow264
.

n Debt-for-nature swaps: Debt-for-nature swaps involve forgiving a portion of a low- or middle-income
country’s sovereign debt in exchange for financing conservation in that country265
. They include bilateral
swaps as well as debt conversions that raise fresh capital which is then used to repurchase and retire
existing, more expensive debt. For example, the Tropical Forest and Coral Reef Conservation Act in
the US offers eligible countries official debt relief to support tropical forest and coral reef conservation,
and to strengthen civil society. It’s been used to conclude 21 debt-for-nature agreements worth US$273
million in 15 countries266
.

n 
Project finance for permanence (PFP): PFP is an approach designed to secure the long-term funding,
capacity, partnerships and policies necessary to conserve nature and its benefits for people267
. For
example, in Colombia, the government, the private sector and civil society partners developed Herencia
Colombia, a PFP initiative that secured US$245 million in public and private finance to permanently
protect 32 million hectares of iconic landscapes and seascapes, achieving Colombia’s goal of protecting
30% of its lands and seas by 2030268
.
Financing green
Avoiding dangerous tipping points, meeting the global goals and transitioning to an equitable, sustainable
economy requires investment on a vast scale. Current levels of government funding and philanthropic support
for nature and climate are not nearly sufficient. There’s an urgent need to reallocate capital to institutions,
projects and activities that contribute to restoring nature and its benefits to people, tackling the climate crisis,
and reducing poverty and inequality261
.
This will require new green finance solutions involving the public and private sector that can be replicated
and scaled – from conservation-focused funds, bonds, loans and insurance products that mitigate risk and
build resilience, to long-term investment in nature-positive businesses and enterprises. Some examples are
included in Box 4.6.
WWF
LIVING
PLANET
REPORT
2024
81
There are, of course, many challenges to overcome. Investors often perceive green initiatives to be high risk.
Many potential business cases are small scale, and rural communities often lack access to finance. One way
to mitigate perceived risk is to combine sources of funding, so public funding goes first and private capital
enters when the risk is lower. Integrated landscape management approaches – which bring together multiple
conservation, sustainable management and restoration interventions in a single landscape – hold potential for
financing green at scale by channelling funding from a range of public, private and civil society investors into
a portfolio of projects and enterprises in different sectors within the landscape269
. This approach could include
tailored financial instruments for different rights-holders, farmers and other stakeholders270
.
Greening finance
Our economies and our financial systems are embedded in nature and could not survive without functioning
ecosystems, biodiversity, water and a stable climate271
. For prosperity in the long term, nature needs to be
accounted for in all financial decision-making. Not doing so will make it impossible to avoid the short- and
long-term impacts of climate change and biodiversity loss in the economy and financial systems.
Our financial system impacts our ecosystems while being dependent on them. This so-called double materiality
affects both financial and price stability. A study published by the European Central Bank in June 2023 showed
that 75% of all bank loans in Europe are to companies that are highly dependent on at least one ecosystem
service (e.g. erosion control, water supply, flood and storm protection, carbon uptake and storage, pollination)
to continue producing their goods or providing their services272
.
Nature loss poses multiple financial risks. Changes in ecosystems and how they function present physical
risks to businesses. These risks may be acute, like wildfires, floods or natural disasters, or chronic – as with
the effects on food production of the progressive degradation of pollinator populations and soil biodiversity.
As societies and economies transition to a low-carbon and nature-positive future, businesses are also
exposed to transition risks – for example, as new regulations are brought in. Finally, systemic risks arise
from the breakdown of an entire system when a tipping point is reached.
Financial institutions, central banks and financial regulators are increasingly aware of these risks and
developing initiatives to address them (Box 4.7). This positive trend needs to be globalized and
mainstreamed as quickly as possible.
CHAPTER
4
WWF
LIVING
PLANET
REPORT
2024
82
Policymakers,
regulators, asset
owners, asset
managers and leading
global companies are
all increasing their
focus on nature-related
risk management
and the necessity of
mobilizing private
sector engagement
and finance to tackle
nature loss and scale
nature-based solutions.
WWF
LIVING
PLANET
REPORT
2024
83
CHAPTER
4
The examples above show that change is happening, albeit not at the pace we need to stay clear of
dangerous tipping points and address the existential crises that climate change and biodiversity loss pose to
human societies. While policies should guide the change needed to transition our economies to a net-zero
and nature-positive future, finance can and must accelerate it.
Box 4.7 Examples of finance-related initiatives to address risk

n 
Sustainable Financial Regulation Initiative: Since 2021, the Sustainable
Financial Regulations and Central Bank Activities (SUSREG) Tracker has
evaluated how central banks and financial regulators are making progress
with integrating nature loss and climate change risks into their operations and
activities on an annual basis. The SUSREG Tracker 2023 shows that several
central banks and financial regulators are making progress in “greening” their
financial regulation and supervision273
. Worryingly, however, high-income
countries, countries with the highest greenhouse gas emissions and countries with the greatest
biodiversity are lagging significantly behind. Increasingly, financial regulators and central banks are
taking action on climate, but they do not yet take into account nature loss and the consequences for
businesses, communities and people’s livelihoods.

n 
Network for Greening the Financial System (NGFS): In September 2023 the NGFS, a coalition
comprising more than 140 central banks and financial supervisors, published a conceptual framework
on nature related-risks. This recognizes that “the twin crisis of environmental degradation and climate
change poses a significant threat to stability, sustainable prosperity, and life on this planet” and that
“central banks and supervisors have clear reason to be concerned and involved”. The conceptual
framework provides a structured approach to understand and integrate nature-related risks271
.

n 
Taskforce on Nature-related Financial Disclosures (TNFD): This initiative has produced a set
of recommendations for companies and financial institutions for disclosing and addressing risk
associated with nature loss and degradation, building on other initiatives, notably the Task Force
on Climate-related Financial Disclosures (TCFD). Its 14 disclosure recommendations provide nature-
related guidance to enable organizations to meet their reporting requirements across jurisdictions274
.
Policymakers, regulators, asset owners, asset managers and leading global companies are all
increasing their focus on nature-related risk management and the necessity of mobilizing private
sector engagement and finance to tackle nature loss and scale nature-based solutions274
. By January
2024, 320 financial and non-financial companies had already signalled their commitment to use the
TNFD framework to report on their nature-related risks by 2025275
.
WWF
LIVING
PLANET
REPORT
2024
83
WWF
LIVING
PLANET
REPORT
2024
84
CHAPTER5
Facing nature’s tipping
points, it’s never been
more urgent to tackle
global goals in a
coordinated way.
WWF
LIVING
PLANET
REPORT
2024
85
With every issue of the WWF Living Planet Report, we see a further decline in the state of nature and a
destabilization of the climate. This cannot continue.
The global goals offer a vision of a better future, where a stable climate and recovering nature support fairer
societies where all people can prosper. They are ground-breaking in their ambition and the overwhelming
buy-in from nations, the private sector and civil society. They provide an opportunity to reverse our current
trajectory of nature and climate degradation, step away from global tipping points and put the world on a
path to sustainability.
To do this, we need governments and the private sector to make credible commitments and plans to achieve
the goals. We need concrete actions at the pace and scale required to fully meet the targets on time. We need
the finance to make it happen. And we need to ensure the outcomes are effective, equitable and enduring.
There is no time to waste.
Tracking progress
Right now, commitments, actions and outcomes across government, the private sector and civil society are
insufficient, disjointed and siloed. Many lack credibility: we have seen governments pledge new finance for
climate and nature initiatives, only for subsequent analyses to reveal they are simply rebranding existing
commitments, or corporations proudly announce their commitment to carbon neutrality, when this is based on
carbon offsets of dubious value. Cynical commitments and actions that achieve nothing are worse than useless
in the face of ecological and climatic tipping points: they sow confusion and undermine momentum.
Collectively, we need to understand what we’re doing: what’s working, what isn’t and what still needs to be
done. We need to transparently evaluate which actions across sectors and countries are delivering against
the global goals, and how public and private sectors are contributing to or undermining progress. We need
to do a better job of identifying cost-saving synergies and managing trade-offs. We need to be able to take
a pulse check rapidly and credibly report back on where we are and where we need to be. Doing so can
motivate change, and strengthen innovation, collaboration and adaptive learning to meet our goals for
2030 and beyond.
Over the last few years, there’s been a proliferation of trackers, gap reports, disclosure frameworks and other
initiatives providing parts of this information. We’re calling now for nature and climate organizations to align
around a system that pulls all this information together to answer the following questions:
	
n 
Are the collective actions taken by governments and the private sector delivering the necessary
progress against the global goals and lowering the probability of reaching dangerous tipping points?
	
n 
Are these actions mutually reinforcing progress or are they likely to cause trade-offs or backsliding for
a subset of goals or people?
	
n 
Is the world transitioning toward sustainable food, energy and finance systems that will deliver a
sustainable and thriving future for all?
The final push
It is no exaggeration to say that what happens in the next five years will determine the future of life on Earth.
We have five years to place the world on a sustainable trajectory before negative feedbacks of combined
nature degradation and climate change place us on the downhill slope of runaway tipping points. The risk of
failure is real – and the consequences almost unthinkable.
Each government, company, organization and individual will need to decide what they will do in the race to
the deadline. But all will have to do something radically different. Incremental improvements will not suffice.
Together, we must be successful. We have just one living planet, and one opportunity to get it right.
Making it happen
CHAPTER
5
WWF
LIVING
PLANET
REPORT
2024
86
Page 2 © NOAA / unsplash.com
Page 4-5 © Wil.Amaya / Adobe Stock
Page 6 © Janos / Adobe Stock
Page 8 © The Ocean Agency / Adobe Stock
Page 9 © Wideangle Media / WWF Switzerland
Page 10 © viki2win / Shutterstock
Page 11 © Jochen Tack / Alamy
Page 12 © Maxentius Donysius / WWF-Malaysia
Page 13 © Leonardo / Adobe Stock
Page 14 © WWF International
Page 16 © 
Ministry of the Environment and Sustainable
Development of Colombia
Page 18 © naturepl.com / Maxime Aliaga / WWF
Page 23 Top: © John Anderson / Adobe Stock
Bottom © Nadia Bood / WWF
Page 29 © kakteen / Shutterstock
Page 31 © Danielle Brigida / WWF-US
Page 32 (hawksbill turtle) © Jona Sanchez / Shutterstock,
(forest elephant) zahorec / Shutterstock,
(chinstrap penguin) Farjana.rahman / Shutterstock
Page 33 (Chinook salmon) © Daniel Thornberg / Alamy,
(river dolphin) © COULANGES / Shutterstock,
(European bison) © Peter Fodor / Shutterstock,
(mountain gorilla) Ondrej Prosicky / Shutterstock
Page 34 © Mongkolchon Akesin / Shutterstock
Page 36 © Henrik Larsson / Shutterstock
Page 37 a. © National Park Service, b. USDA Forest Service,
c. keldridge / Shutterstock, d. Toa55 / Shutterstock
Page 38 © tolly65 / Adobe Stock
Page 39 © Tunatura / Shutterstock
Page 40 © Xinhua / Alamy
Page 41 © Paulo Henrique Pigozzi / Shutterstock
Page 42 © Richard Carey / Adobe Stock
Page 43 © Milan / Adobe Stock
Page 44 © Sergey / Adobe Stock
Page 47 © Linda Harms / Adobe Stock
Page 48 Top: © reisegraf.ch / Shutterstock
Bottom: © Milos Muller / Shutterstock
Page 49 © photomatz / Shutterstock
Page 50 © Sebastian Delgado C / Shutterstock
Page 53 © Hannes Thirion / iStock
Page 54 © Kelsey Hartman / WWF-Greater Mekong
Page 55 © Raquel Mogado / Alamy
Page 57 © jeson / Adobe Stock
Page 58 © Long Hung / Adobe Stock
Page 60 © Gideon Ikigai / Shutterstock
Page 61 © Kelvin H. Haboski / Shutterstock
Page 62 © Cavan-Images / Shutterstock
Page 66 © Artie Medvedev / Shutterstock
Page 67 © kateafter / Shutterstock
Page 69 © arboursabroad.com / Shutterstock
Page 71 © naturepl.com / Paul Williams / WWF
Page 72 © Tsvetan / Adobe Stock
Page 74 © THINK b / Adobe Stock
Page 75 © T.W. van Urk / Shutterstock
Page 77 © Yoon S. Byun / WWF-US
Page 79 © Ryan Bartlett / WWF-US
Page 81 © aprilian / Adobe Stock
Page 82 © Josef / Adobe Stock
Page 84 © oleije abigail / Shutterstock
Page 86 © Elly Miller / Adobe Stock
Page 87 © namning / Adobe Stock
Back cover: © divedog / Adobe Stock
PHOTO
CREDITS
Photo credits
WWF
LIVING
PLANET
REPORT
2024
87
1 	
IPBES. Global Assessment Report on Biodiversity and
Ecosystem Services of the Intergovernmental Science-
Policy Platform on Biodiversity and Ecosystem Services.
E. S. Brondizio, J. Settele, S. Díaz et al. (ed). Bonn,
Germany: Secretariat of the Intergovernmental Science-
Policy Platform on Biodiversity and Ecosystem Services.
2019:1148.
2 	
WHO, CBD. Connecting Global Priorities: Biodiversity and
Human Health: A State of Knowledge Review. World Health
Organization, 2015:364.
3 	
IPBES. Summary for Policymakers of the Global
Assessment Report on Biodiversity and Ecosystem
Services of the Intergovernmental Science-Policy Platform
on Biodiversity and Ecosystem Services. Díaz S, Settele J,
Brondízio ES et al. (eds.). Bonn, Germany: Secretariat of the
Intergovernmental Science-Policy Platform on Biodiversity
and Ecosystem Services, 2019:45.
4	
IPBES. Summary for Policymakers of the Methodological
Assessment of the Diverse Values and Valuation of Nature
of the Intergovernmental Science-Policy Platform on
Biodiversity and Ecosystem Services. Pascual U, Balvanera
P, Christie M et al. (eds.). Bonn, Germany: Secretariat of the
Intergovernmental Science-Policy Platform on Biodiversity
and Ecosystem Services, 2022:52.
5	
Mace GM, Barrett M, Burgess ND et al. Aiming higher to
bend the curve of biodiversity loss. Nature Sustainability
2018;1:448–51.
6 	
Hill SLL, Harfoot M, Purvis A et al. Reconciling Biodiversity
Indicators to Guide Understanding and Action.
Conservation Letters 2016;9:405–12.
7 	
IUCN. The IUCN Red List of Threatened Species. 2023.
8 WWF, ZSL. The Living Planet Index database. 2024.
9	
Natural History Museum. The Biodiversity Intactness
Index – Country, Region and Global-Level Summaries for
the Year 1970 to 2050 under Various Scenarios. Natural
History Museum, 2024.
10	
Bello C, Galetti M, Pizo MA et al. Defaunation affects
carbon storage in tropical forests. Science Advances
2015;1:e1501105.
11	
Osuri A, Ratnam J, Varma V et al. Contrasting effects of
defaunation on aboveground carbon storage across the
global tropics. Nature Communications 2016;7:11351.
12 	
Knowlton N. Thresholds and Multiple Stable States in Coral
Reef Community Dynamics. Am Zool 1992;32:674–82.
13	
Steneck RS, Arnold SN, Boenish R et al. Managing
Recovery Resilience in Coral Reefs Against Climate-
Induced Bleaching and Hurricanes: A 15 Year Case Study
From Bonaire, Dutch Caribbean. Front Mar Sci 2019;6:265.
14	
Ledger S, Rutherford C, Benham C et al. Wildlife Comeback
in Europe: Opportunities and Challenges for Species
Recovery. Final Report to Rewilding Europe by the
Zoological Society of London, BirdLife International and the
European Bird Census Council, 2022.
15	
Westveer J, Freeman R, McRae L et al. A Deep Dive into
the Living Planet Index: A Technical Report. WWF, 2022.
16	
Deinet S, Marconi V, Freeman R et al. Living Planet Report
2024 Technical Supplement: Living Planet Index. ZSL,
2024.
17	
Dirzo R, Young HS, Galetti M et al. Defaunation in the
Anthropocene. Science 2014;345:401–6.
18	
Capdevila P, Noviello N, McRae L et al. Global patterns
of resilience decline in vertebrate populations. Ecology
Letters 2022;25:240–51.
19	
Spake R, Barajas-Barbosa MP, Blowes SA et al. Detecting
Thresholds of Ecological Change in the Anthropocene.
Annual Review of Environment and Resources 2022;
47:797–821.
20	
Hilborn R, Buratti CC, Díaz Acuña E et al. Recent trends in
abundance and fishing pressure of agency-assessed small
pelagic fish stocks. Fish and Fisheries 2022;23:1313–1331.
21	
Hilborn R, Amoroso RO, Anderson CM et al. Effective
fisheries management instrumental in improving fish stock
status. Proceedings of the National Academy of Sciences
2020;117:2218–2224.
22	
WWF. Living Planet Report 2022 – Building a Nature-
Positive Society. Gland, Switzerland: WWF, 2022.
23	
Pacoureau N, Rigby C, Kyne P et al. Half a century of global
decline in oceanic sharks and rays. Nature 2021;589:567–71.
24	
IPBES. IPBES regions and sub-regions: IPBES Technical
Support Unit on Knowledge and Data. 2021.
25	
IPBES. The IPBES Regional Assessment Report on
Biodiversity and Ecosystem Services for Europe and
Central Asia. Rounsevell M, Fischer M, Torre-Marin
Rando A et al. (eds.). Bonn, Germany: Secretariat of the
Intergovernmental Science-Policy Platform on Biodiversity
and Ecosystem Services, 2018:892.
26	
Ellis EC, Goldewijk KK, Siebert S et al. Anthropogenic
Transformation of the Biomes, 1700 to 2000. Global
Ecology and Biogeography 2010;19:589–606.
27	
Donovan VM, Roberts CP, Wonkka CL et al. Range-wide
monitoring of population trends for Rocky Mountain
bighorn sheep. Biological Conservation 2020;248:108639.
28	
Rosenberg K, Dokter A, Blancher P. Decline of the North
American avifauna. Science 2019;366:120–4.
29	
IPBES. The IPBES Regional Assessment Report on
Biodiversity and Ecosystem Services for the Americas. Rice
J, Seixas CS, Zaccagnini ME et al. (eds.). Bonn, Germany:
Secretariat of the Intergovernmental Science-Policy
Platform on Biodiversity and Ecosystem Services, 2018:656.
30	
Azat C, Alvarado-Rybak M, Solano-Iguaran JJ et al.
Synthesis of Batrachochytrium dendrobatidis infection in
South America: amphibian species under risk and areas
to focus research and disease mitigation. Ecography
2022;2022:e05977.
REFERENCES
References
WWF
LIVING
PLANET
REPORT
2024
88
31	
Blake JG, Loiselle BA. Sharp declines in observation
and capture rates of Amazon birds in absence of
human disturbance. Global Ecology and Conservation
2024;51:e02902.
32	
Deinet S, Scott-Gatty K, Rotton H et al. The Living Planet
Index (LPI) for Migratory Freshwater Fish: Technical report.
2020.
33 	
IUCN. European Species Under Threat: Overview of
European Red Lists Results. Gland, Switzerland: IUCN, 2011.
34	
IPBES. The IPBES Regional Assessment Report on
Biodiversity and Ecosystem Services for Africa. Archer E,
Dziba L, Mulongoy KJ, Maoela MA, and Walters M (eds.).
Bonn, Germany: Secretariat of the Intergovernmental
Science-Policy Platform on Biodiversity and Ecosystem
Services, 2018:492.
35 	
McRae L, Freeman R, Geldmann J et al. A global indicator
of utilized wildlife populations: Regional trends and the
impact of management. One Earth 2022;5:422–33.
36	
IPBES. Summary for Policymakers of the Thematic
Assessment of the Sustainable Use of Wild Species of the
Intergovernmental Science-Policy Platform on Biodiversity
and Ecosystem Services. Fromentin JM, Emery MR,
Donaldson J et al. (eds.). Bonn, Germany: Secretariat of the
Intergovernmental Science-Policy Platform on Biodiversity
and Ecosystem Services, 2022:44.
37	
IPBES. The IPBES Regional Assessment Report on
Biodiversity and Ecosystem Services for Asia and the
Pacific. Karki M, Senaratna Sellamuttu S, Okayasu S et al.
(eds). Bonn, Germany: Secretariat of the Intergovernmental
Science-Policy Platform on Biodiversity and Ecosystem
Services, 2018:612.
38	
Wiles GJ, Bart J, Beck Jr. RE et al. Impacts of the Brown
Tree Snake: Patterns of Decline and Species Persistence in
Guam’s Avifauna. Conservation Biology 2003;17:1350–60.
39 	
Gorresen P, Cryan P, Parker M et al. Videographic
monitoring at caves to estimate population size of the
endangered váyaguak (Mariana swiftlet) on Guam. Endang
Species Res 2024;53:139–49.
40	
BirdLife International. Aerodramus bartschi. The IUCN Red
List of Threatened Species 2023. IUCN Red List 2023.
41	
Bell IP, Meager JJ, Eguchi T et al. Twenty-eight years of
decline: Nesting population demographics and trajectory
of the north-east Queensland endangered hawksbill
turtle (Eretmochelys imbricata). Biological Conservation
2020;241:108376.
42	
Madden Hof CA, Smith C, Miller S et al. Delineating spatial
use combined with threat assessment to aid critical
recovery of northeast Australia’s endangered hawksbill
turtle, one of western Pacific’s last strongholds. Front Mar
Sci 2023;10.
43	
Poulsen JR, Koerner SE, Moore S et al. Poaching empties
critical Central African wilderness of forest elephants.
Current Biology 2017;27:R134–5.
44	
Talis EJ, Che-Castaldo C, Hart T et al. Penguindex: a Living
Planet Index for Pygoscelis species penguins identifies key
eras of population change. Polar Biol 2023;46:707–18.
45	
Krüger L. Decreasing Trends of Chinstrap Penguin
Breeding Colonies in a Region of Major and Ongoing
Rapid Environmental Changes Suggest Population Level
Vulnerability. Diversity 2023;15:327.
46	
Salmerón N, Belle S, Cruz FS et al. Contrasting
environmental conditions precluded lower availability of
Antarctic krill affecting breeding chinstrap penguins in the
Antarctic Peninsula. Sci Rep 2023;13:5265.
47	
Silva VMF da, Freitas CEC, Dias RL et al. Both cetaceans in
the Brazilian Amazon show sustained, profound population
declines over two decades. PLOS ONE 2018;13:e0191304.
48 	
Mamirauá Institute for Sustainable Development, Chico
Mendes Institute for Biodiversity Conservation. Pink and
tucuxi river dolphins are monitored while intervention
strategies are outlined. WWF Brazil 2023.
49	
Gutiérrez M. Workshop reúne especialistas de diversas
organizações em Manaus. WWF Brazil 2024.
50	
Good TP, Waples RS, Adams PB et al. Updated status of
federally listed ESUs of West Coast salmon and steelhead.
2005.
51	
Azat J. GrandTab California Central Valley Chinook
Escapement Database Report. CalFish: A California
Cooperative Anadromous Fish and Habitat Data
Program 2022.
52	
NOAA Fisheries. Chinook Salmon (Protected). NOAA
Fisheries 2023.
53	
Granjon AC, Robbins MM, Arinaitwe J et al. Estimating
abundance and growth rates in a wild mountain gorilla
population. Animal Conservation 2020;23:455–465.
54	
Lenton TM, Armstrong McKay DI, Loriani S et al. The Global
Tipping Points Report 2023. Exeter, UK: University of
Exeter, 2023.
55	
Scheffer M, Carpenter S, Foley JA et al. Catastrophic shifts
in ecosystems. Nature 2001;413:591–6.
56	
Resource Watch 2020. Coral Reefs: Status and outlook of
coral reefs around the world. World Resources Institute.
2024.
57	
Lenton TM, Laybourn L, Armstrong McKay DI et al. Global
Tipping Points Report 2023: Summary Report. In: Lenton
T, Armstrong McKay D, Loriani S, et al. (eds.). The Global
Tipping Points Report 2023. Exeter, UK: University of
Exeter, 2023.
58	
Welch DW, Porter AD, Rechisky EL. A synthesis of the
coast-wide decline in survival of West Coast Chinook
Salmon (Oncorhynchus tshawytscha, Salmonidae). Fish and
Fisheries 2020;22:194–211.
59	
Giannaros TM, Kotroni V, Lagouvardos K. Climatology
and trend analysis (1987–2016) of fire weather in the
Euro-Mediterranean. International Journal of Climatology
2021;41:E491–508.
60	
Cantin N, James N, Stella J. Aerial Surveys of the 2024
Mass Coral Bleaching Event on the Great Barrier Reef. The
Australian Insitute of Marine Science, 2024.
61 	
Good AM, Bahr KD. The coral conservation crisis:
interacting local and global stressors reduce reef resiliency
and create challenges for conservation solutions. SN Appl
Sci 2021;3:312.
62	
MacNeil MA, Mellin C, Matthews S et al. Water quality
mediates resilience on the Great Barrier Reef. Nature
Ecology  Evolution 2019;3:620–7.
63	
Berner LT, Law BE, Meddens AJH et al. Tree mortality from
fires, bark beetles, and timber harvest during a hot and dry
decade in the western United States (2003–2012). Environ
Res Lett 2017;12:065005.
64	
Williams DW, Liebhold AM. Climate change and the
outbreak ranges of two North American bark beetles.
Agricultural and Forest Entomology 2002;4:87–99.
65	
Scheller RM, Kretchun AM, Loudermilk EL et al. Interactions
Among Fuel Management, Species Composition, Bark
Beetles, and Climate Change and the Potential Effects on
Forests of the Lake Tahoe Basin. Ecosystems 2018;
21:643–56.
66	
Abella S, Covington W, Fulé P et al. Past, Present, and
Future Old Growth in Frequent-fire Conifer Forests of the
Western United States. Ecology and Society 2007;12.66.
67	
Davis KT, Dobrowski SZ, Higuera PE et al. Wildfires and
climate change push low-elevation forests across a critical
climate threshold for tree regeneration. Proceedings of the
National Academy of Sciences 2019;116:6193–8.
68	
Hicke JA, Xu B, Meddens AJH et al. Characterizing
recent bark beetle-caused tree mortality in the western
United States from aerial surveys. Forest Ecology and
Management 2020;475:118402.
69	
USDA Forest Service. Areas with Tree Mortality from Bark
Beetles: Summary for 2000– 2020. 2021.
70	
Hughes TP, Kerry JT, Baird AH et al. Global warming
transforms coral reef assemblages. Nature 2018;556:492–6.
71	
Cheung MWM, Hock K, Skirving W et al. Cumulative
bleaching undermines systemic resilience of the Great
Barrier Reef. Current Biology 2021;31:5385-5392.e4.
72	
IPCC. Summary for Policymakers of IPCC Special Report
on Global Warming of 1.5°C approved by governments.
In: Masson-Delmotte V, Zhai P, Pörtner H-O, et al. (eds.).
Global Warming of 1.5°C. An IPCC Special Report on the
Impacts of Global Warming of 1.5°C above Pre-Industrial
Levels and Related Global Greenhouse Gas Emission
Pathways, in the Context of Strengthening the Global
Response to the Threat of Climate Change, Sustainable
Development, and Efforts to Eradicate Poverty. Cambridge,
UK and New York, NY, USA: Cambridge University Press,
2018, 32.
73	
Dixon AM, Foster PM, Heron SF et al. Future loss of local-
scale thermal refugia in coral reef ecosystems. PLOS
Climate 2022;1:e0000004.
REFERENCES
WWF
LIVING
PLANET
REPORT
2024
89
74	
Schleussner, C-F et al. Differential climate impacts for
policy relevant limits to global warming: the case of 1.5°C
and 2°C. Earth System Dynamics 2016: 7(2): 327–351.
75	
UNEP, ICRI, ISU et al. The Coral Reef Economy: The
Business Case for Investment in the Protection,
Preservation and Enhancement of Coral Reef Health. 2018.
76	
Mohil D, Sharan A, Ganapathi H. The Key Role of Wetlands
to Build Socio-Ecological Resilience against Drought: Case
Study from Bhachau, Kachchh, Gujarat. In: Eslamian S,
Eslamian F (eds.). Disaster Risk Reduction for Resilience.
Springer, Cham, 2022.
77	
Masih N, Slater J. As a major Indian city runs out of water,
9 million people pray for rain. The Washington Post. https://
www.washingtonpost.com/world/2019/06/28/major-indian-
city-runs-out-water-million-people-pray-rain/. Published
June 28, 2019.
78	
TNC. Greenprint for Chennai – Integrating Natural
Infrastructure in City Planning: Preliminary Report. 2021.
79	
Leroy B, Diaz MS, Giraud E et al. Global biogeographical
regions of freshwater fish species. Journal of Biogeography
2019;46.
80	
Saatchi SS, Harris NL, Brown S et al. Benchmark map
of forest carbon stocks in tropical regions across three
continents. Proceedings of the National Academy of
Sciences 2011;108:9899–904.
81	
Costa M, Borma L, Brando P et al. Chapter 7:
Biogeophysical Cycles: Water Recycling, Climate
Regulation. In: Nobre C, Encalada A, Anderson E, et al.
(eds.). Amazon Assessment Report. New York, USA: United
Nations Sustainable Development Solutions Network, 2021.
82	
Staal A, Tuinenburg OA, Bosmans JHC et al. Forest-rainfall
cascades buffer against drought across the Amazon.
Nature Clim Change 2018;8:539–43.
83	
Cano IM, Shevliakova E, Malyshev S et al. Abrupt loss and
uncertain recovery from fires of Amazon forests under low
climate mitigation scenarios. Proceedings of the National
Academy of Sciences 2022;119:e2203200119.
84	
Parry IM, Ritchie PDL, Cox PM. Evidence of localised
Amazon rainforest dieback in CMIP6 models. Earth System
Dynamics 2022;13:1667–75.
85	
MapBiomas Amazonia. Cobertura y uso del suelo en la
Amazonia 1985-2022. Colección 5.0. 2023.
86	
Berenguer E, Armenteras D, Lees A et al. Chapter 19:
Drivers and ecological impacts of deforestation and forest
degradation. Amazon Assessment 2021. UN Sustainable
Development Solutions Network, 2021.
87	
Red Amazónica de Información Socioambiental
Georreferenciada (RAISG). Territorios Indígenas. 2022.
88	
Red Amazónica de Información Socioambiental
Georreferenciada (RAISG). Áreas Naturales
Protegidas. 2022.
89	
R
ed Amazónica de Información Socioambiental
Georreferenciada (RAISG). Amazonía Biogeográfica. 2022.
90	
Nobre C, Encalada A, Anderson E et al. Executive
Summary: Amazon Assessment Report 2021. In: Science
Panel for the Amazon (2021). Amazon Assessment
Report 2021. New York, NY: United Nations Sustainable
Development Solutions Network, 2021.
91	
Araujo R, Mourão J. The Amazon Domino Effect: How
Deforestation Can Trigger Widespread Degradation.
Climate Policy Initiative, 2023.
92	
Flores BM, Montoya E, Sakschewski B et al. Critical
transitions in the Amazon forest system. Nature
2024;626:555–64.
93 	
CBD. Decision Adopted by the Conference of the Parties to
the Convention on Biological Diversity. 2022.
94	
UNFCCC. Report of the Conference of the Parties Serving
as the Meeting of the Parties to the Paris Agreement on
Its Fifth Session, Held in the United Arab Emirates from 30
November to 13 December 2023. United Nations, 2024.
95	
United Nations Department of Economic and Social Affairs.
The Sustainable Development Goals Report 2023: Special
Edition. United Nations, 2023.
96	
Bruckner B, Hubacek K, Shan Y et al. Impacts of poverty
alleviation on national and global carbon emissions. Nat
Sustain 2022;5:311–20.
97	
Dhakal S, Minx JC, Toth FL et al. Chapter 2 – Emissions
Trends and Drivers. In: IPCC (2022) Climate Change
2022: Mitigation of Climate Change. Contribution of
Working Group III to the Sixth Assessment Report of the
Intergovernmental Panel on Climate Change. Shukla PR,
Skea J, Slade A et al. (eds.) Cambridge, UK and New York,
NY, USA: Cambridge University Press, 2022.
98	
UNDP. Human Development Report 2021/2022 –
Uncertain Times, Unsettled Lives: Shaping Our Future in a
Transforming World. UNDP, 2022.
99	
Hickel J. Quantifying national responsibility for climate
breakdown: an equality-based attribution approach for
carbon dioxide emissions in excess of the planetary
boundary. The Lancet Planetary Health 2020;4:e399–404.
100	
Peet R, Robbins P, Watts M eds. Global Political Ecology. 1st
ed. Routledge, 2011.
101	
Wiedmann T, Lenzen M, Keyßer LT et al. Scientists’ warning
on affluence. Nat Commun 2020;11:3107.
102	
Aubert G, Dudley N. Progress on Implementing the
Kunming-Montreal Global Biodiversity Framework. Policy
Department for Economic, Scientific and Quality of Life
Policies, Directorate-General for Internal Policies, 2023.
103	
Biermann F, van Driel M, Vijge MJ et al. Governance
Fragmentation. Architectures of Earth System Governance:
Institutional Complexity and Structural Transformation.
Cambridge: Cambridge University Press, 2020.
104 	
Weiand L, Unger S, Rochette J et al. Advancing Ocean
Governance in Marine Regions Through Stakeholder
Dialogue Processes. Frontiers in Marine Science 2021;8.
105 	
Young, OR. Governing Complex Systems: Social Capital
for the Anthropocene. The MIT Press. Cambridge,
Massachusetts; London, England, 2017.
106	
Baldwin-Cantello W, Tickner D, Wright M et al. The Triple
Challenge: synergies, trade-offs and integrated responses
for climate, biodiversity, and human wellbeing goals.
Climate Policy 2023;23:782–799.
107	
United Nations Department of Economic and Social Affairs
and UNFCCC. Synergy Solutions for a World in Crisis:
Tackling Climate and SDG Action Together: Report on
Strengthening the Evidence Base – First Edition 2023.
United Nations, 2023.
108	
Allen C, Malekpour S. Unlocking and accelerating
transformations to the SDGs: a review of existing
knowledge. Sustain Sci 2023;18:1939–60.
109	
Breslow SJ, Sojka B, Barnea R et al. Conceptualizing
and operationalizing human wellbeing for ecosystem
assessment and management. Environmental Science 
Policy 2016;66:250–9.
110	
Kaplan-Hallam M, Bennett NJ. Adaptive social impact
management for conservation and environmental
management. Conservation Biology 2018;32:304–14.
111	
Rights and Resources Initiative. Who Owns the World’s
Land? Global State of Indigenous, Afro-Descendant, and
Local Community Land Rights Recognition from 2015–
2020. Rights and Resources Initiative, 2023.
112	
Government of Canada. Canadian Charter of Rights and
Freedoms. 1982.
113 	
Langhammer PF, Bull JW, Bicknell JE et al. The positive
impact of conservation action. Science 2024;384:453–8.
114	
Armitage D, Mbatha P, Muhl E-K et al. Governance
principles for community-centered conservation in the post-
2020 global biodiversity framework. Conservation Science
and Practice 2020;2:e160.
115	
Mace GM. Whose conservation? Science 2014;
345:1558–60.
116	
UNEP-WCMC and IUCN. Protected Planet Database: The
World Database on Protected Areas. Protected Planet
Database 2024.
117	
UNEP-WCMC, IUCN. Protected Planet Report. UNEP-
WCMC and IUCN, 2020.
118	
Leal CG, Lennox GD, Ferraz SFB et al. Integrated terrestrial-
freshwater planning doubles conservation of tropical
aquatic species. Science 2020;370:117–21.
119	
Gill DA, Mascia MB, Ahmadia GN et al. Capacity shortfalls
hinder the performance of marine protected areas globally.
Nature 2017;543:665–9.
120	
Golden Kroner RE, Qin S, Cook CN et al. The uncertain
future of protected lands and waters. Science
2019;364:881–6.
121	
DEA. National Protected Area Expansion Strategy for
South Africa 2008: Priorities for expanding the protected
area network for ecological sustainability and climate
change adaptation. Pretoria, South Africa: Department of
Environmental Affairs, 2008.
122	
DEA. National Protected Area Expansion Strategy for
South Africa 2018. Pretoria, South Africa: Department of
Environmental Affairs, 2018.
REFERENCES
WWF
LIVING
PLANET
REPORT
2024
90
123	
Lötter MC, Le Maitre D. Fine-scale delineation of Strategic
Water Source Areas for surface water in South Africa
using Empirical Bayesian Kriging Regression Prediction:
Technical report. Pretoria, South Africa: South African
National Biodiversity Institute, 2021.
124	
South Africa Department of Forestry, Fisheries, and the
Environment. South Africa Protected Areas Database
(SAPAD_OR_2023_Q4). E-GIS DFFE, 2024.
125	
Alves-Pinto H, Geldmann J, Jonas H et al. Opportunities
and challenges of other effective area-based conservation
measures (OECMs) for biodiversity conservation.
Perspectives in ecology and conservation 2021;19:115–20.
126 J
onas HD, MacKinnon K, Dudley N et al. Other Effective
	
Area-Based Conservation Measures: From Aichi Target
11 to the Post-2020 Biodiversity Framework. PARKS
2018;24:9–16.
127	
Gurney GG, Darling ES, Ahmadia GN et al. Biodiversity
needs every tool in the box: use OECMs. Nature
2021;595:646–9.
128	
WWF-US. Backing the Stewards of Nature: Supporting
Local Approaches to Global Conservation Targets through
Other Effective Area-Based Conservation Measures.
Washington, DC: WWF-US, 2022.
129	
Chaplin-Kramer R, Neugarten RA, Gonzalez-Jimenez D et
al. Transformation for inclusive conservation: evidence on
values, decisions, and impacts in protected areas. Current
Opinion in Environmental Sustainability 2023;64:101347.
130	
FAO, FILAC. Forest Governance by Indigenous and Tribal
Peoples. An Opportunity for Climate Action in Latin America
and the Caribbean. Santiago: FAO, 2021.
131	
Garnett ST, Burgess ND, Fa JE et al. A spatial overview of
the global importance of Indigenous lands for conservation.
Nature Sustainability 2018;1:369.
132	
Dawson N, Coolsaet B, Sterling E et al. The role of
Indigenous peoples and local communities in effective and
equitable conservation. Ecology and Society 2021;26:19.
133	
Blackman A, Corral L, Lima ES et al. Titling indigenous
communities protects forests in the Peruvian Amazon.
Proceedings of the National Academy of Sciences
2017;114:4123–8.
134	
Oldekop JA, Holmes G, Harris WE et al. A global
assessment of the social and conservation outcomes of
protected areas. Conservation Biology 2016;30:133–41.
135	
Estrada A, Garber PA, Gouveia S et al. Global importance
of Indigenous Peoples, their lands, and knowledge systems
for saving the world’s primates from extinction. Science
Advances 2022;8:eabn2927.
136	
Brondízio ES, Aumeeruddy-Thomas Y, Bates P et al. Locally
Based, Regionally Manifested, and Globally Relevant:
Indigenous and Local Knowledge, Values, and Practices for
Nature. Annu Rev Environ Resour 2021;46:481–509.
137	
WWF, UNEP-WCMC, SGP/ICCA-GSI et al. The State of
Indigenous Peoples’ and Local Communities’ Lands
and Territories: A Technical Review of the State of
Indigenous Peoples’ and Local Communities’ Lands,
Their Contributions to Global Biodiversity Conservation
and Ecosystem Services, the Pressures They Face, and
Recommendations for Actions. Gland, Switzerland, 2021.
138	
Chaplin-Kramer R, Neugarten RA, Sharp RP et al.
Mapping the planet’s critical natural assets. Nat Ecol Evol
2023;7:51–61.
139	
Neugarten RA, Chaplin-Kramer R, Sharp RP et al. Mapping
the planet’s critical areas for biodiversity and nature’s
contributions to people. Nat Commun 2024;15:261.
140	
Pascual U, Balvanera P, Anderson CB et al. Diverse values
of nature for sustainability. Nature 2023;620:813–23.
141	
Cohen-Shacham E, Andrade A, Dalton J et al. Core
principles for successfully implementing and upscaling
Nature-based Solutions. Environmental Science  Policy
2019;98:20–9.
142	
Seddon N. Harnessing the potential of nature-based
solutions for mitigating and adapting to climate change.
Science 2022;376:1410–6.
143	
Roe S, Streck C, Beach R et al. Land-based measures
to mitigate climate change: Potential and feasibility by
country. Global Change Biology 2021;27:6025–58.
144	
Nabuurs G-J, Mrabet A, Abu Hatab M et al. Agriculture,
Forestry and Other Land Uses (AFOLU). In IPCC, 2022:
Climate Change 2022: Mitigation of Climate Change.
Contribution of Working Group III to the Sixth Assessment
Report of the Intergovernmental Panel on Climate Change.
Shukla PR, Skea J, Slade R et al. (eds). Cambridge, UK and
New York, NY, USA: Cambridge University Press, 2022.
145	
IUCN. Ecosystem-Based Adaptation. Gland, Switzerland:
International Union for Conservation of Nature, 2017.
146	
Noon ML, Goldstein A, Ledezma JC et al. Mapping the
irrecoverable carbon in Earth’s ecosystems. Nature
Sustainability 2021;5:37–46.
147	
Biggs R, Carpenter SR, Brock WA. Turning back from
the brink: Detecting an impending regime shift in time to
avert it. Proceedings of the National Academy of Sciences
2009;106:826–31.
148	
Carpenter SR, Brock WA. Rising variance: a leading
indicator of ecological transition. Ecology Letters
2006;9:311–8.
149	
Lindegren M, Dakos V, Gröger JP et al. Early Detection of
Ecosystem Regime Shifts: A Multiple Method Evaluation for
Management Application. PLOS ONE 2012;7:e38410.
150 	
McClanahan TR, Graham NAJ, MacNeil MA et al. Critical
thresholds and tangible targets for ecosystem-based
management of coral reef fisheries. Proceedings of the
National Academy of Sciences 2011;108:17230–3.
151	
Liu J, Kattel G, Arp HPH et al. Towards threshold-based
management of freshwater ecosystems in the context of
climate change. Ecological Modelling 2015;318:265–74.
152	
Kéfi S, Rietkerk M, Alados CL et al. Spatial vegetation
patterns and imminent desertification in Mediterranean arid
ecosystems. Nature 2007;449:213–7.
153	
Anderson CM, Weber CL, Fabricius C et al. Planning
for Change: Conservation-Related Impacts of Climate
Overshoot. BioScience 2020;70:115–8.
154	
Hajjar R, Newton P, Ihalainen M et al. Levers for
alleviating poverty in forests. Forest Policy and Economics
2021;132:102589.
155	
Wong GY, Luttrell C, Loft L et al. Narratives in REDD+
benefit sharing: examining evidence within and beyond the
forest sector. Climate Policy 2019;19:1038–51.
156	
Wollenberg E, Tennigkeit T, Dinesh D et al. Compensating
Farmers for Ecosystem Services: Lessons and an Agenda
for Innovation. CompensACTION, 2022.
157	
FAO. Tracking Progress on Food and Agriculture-Related
SDG Indicators 2023. Rome, Italy: FAO, 2023.
158	
KC KB, Dias GM, Veeramani A et al. When too much
isn’t enough: Does current food production meet
global nutritional needs? Struik PC (ed.). PLoS ONE
2018;13:e0205683.
159	
Benton TG, Bieg C, Harwatt H et al. Food System Impacts
on Biodiversity Loss: Three Levers for Food System
Transformation in Support of Nature. Chatham House,
2021.
160	
IPCC. Climate Change 2022 – Mitigation of Climate
Change: Working Group III Contribution to the Sixth
Assessment Report of the Intergovernmental Panel on
Climate Change. Shukla PR, Skea J, Slade R et al. (eds).
Cambridge, UK and New York, NY, USA: Cambridge
University Press, 2023.
161	
Laderchi CR, Lotze-Campen H, DeClerck F et al. The
Economics of the Food System Transformation. Food
System Economics Commission (FSEC), 2024.
162	
FAO. The State of Food and Agriculture 2023. Revealing
the True Cost of Food to Transform Agrifood Systems.
FAO, 2023.
163	
WWF. Bending the Curve: The Restorative Power of Plant-
Based Diets. Gland, Switzerland: WWF, 2020:60.
164	
Tilman D, Balzer C, Hill J et al. Global food demand and the
sustainable intensification of agriculture. Proc. Natl Acad.
Sci. 2011;108:20260–20264.
165	
Kroodsma DA, Mayorga J, Hochberg T et al. Tracking the
global footprint of fisheries. Science 2018;359:904–8.
166	
Paolo FS, Kroodsma D, Raynor J et al. Satellite mapping
reveals extensive industrial activity at sea. Nature
2024;625:85–91.
167	
Boyd CE, Davis RP, McNevin AA. Perspectives on the
mangrove conundrum, land use, and benefits of yield
intensification in farmed shrimp production: A review.
Journal of the World Aquaculture Society 2022;53:8–46.
168	
FAO. The State of the World’s Forests 2022. Forest
Pathways for Green Recovery and Building Inclusive,
Resilient Andsustainable Economies. FAO, 2022.
169	
Pacheco P, Mo K, Dudley N et al. Deforestation Fronts:
Drivers and Responses in a Changing World. Gland,
Switzerland: WWF, 2021.
170 	
Skidmore ME, Moffette F, Rausch L et al. Cattle ranchers
and deforestation in the Brazilian Amazon: Production,
location, and policies. Global Environmental Change
2021;68:102280.
REFERENCES
WWF
LIVING
PLANET
REPORT
2024
91
171	
Bochow N, Boders N. The South American monsoon
approaches a critical transition in response to
deforestation. Science Advances 2023;9.
172 	
Leite-Filho AT, Soares-Filho BS, Davis JL et al.
Deforestation reduces rainfall and agricultural revenues
in the Brazilian Amazon. Nature Communications
2021;12:2591.
173	
Flach R, Abrahão G, Bryant B et al. Conserving the
Cerrado and Amazon biomes of Brazil protects the soy
economy from damaging warming. World Development
2021;146:105582.
174	
Rodrigues AA, Macedo MN, Silvério DV et al. Cerrado
deforestation threatens regional climate and water
availability for agriculture and ecosystems. Global Change
Biology 2022;28:6807–22.
175	
Valdes C. Brazil’s Momentum as a Global Agricultural
Supplier Faces Headwinds. Amber Waves: The Economics
of Food, Farming, Natural Resources, and Rural America
2022.
176	
Fujs T, Kashiwase H. Strains on freshwater resources: The
impact of food production on water consumption. World
Bank Data Blog 2023.
177 J
asechko S, Seybold H, Perrone D et al. Rapid groundwater
	
decline and some cases of recovery in aquifers globally.
Nature 2024;625:715–21.
178	
Yao F, Livneh B, Rajagopalan B et al. Satellites reveal
widespread decline in global lake water storage. Science
2023;380:743–9.
179 	
Richter BD, Bartak D, Caldwell P et al. Water scarcity and
fish imperilment driven by beef production. Nat Sustain
2020;3:319–28.
180	
Udall B, Overpeck J. The Twenty-First Century Colorado
River Hot Drought and Implications for the Future. Water
Resources Research 2017;53:2404–2418.
181	
FAO. The State of World Fisheries and Aquaculture 2024.
Blue Transformation in action. FAO, 2024.
182	
Selig ER, Hole DG, Allison EH et al. Mapping global human
dependence on marine ecosystems. Conservation Letters
2019;12:e12617.
183	
McIntyre PB, Reidy Liermann CA, Revenga C. Linking
freshwater fishery management to global food security
and biodiversity conservation. Proceedings of the National
Academy of Sciences 2016;113:12880–5.
184	
Cheung WWL, Frölicher TL, Lam VWY et al. Marine high
temperature extremes amplify the impacts of climate
change on fish and fisheries. Sci Adv 2021;7:eabh0895.
185	
Möllmann C, Cormon X, Funk S et al. Tipping point realized
in cod fishery. Sci Rep 2021;11:14259.
186	
Deinet S, Flint R, Puleston H et al. The Living Planet Index
(LPI) for Migratory Freshwater Fish: Technical report. 2024.
187	
Tilman D, Clark M, Williams DR et al. Future threats to
biodiversity and pathways to their prevention. Nature
2017;546:73–81.
188	
IPBES. The Assessment Report of the Intergovernmental
Science-Policy Platform on Biodiversity and Ecosystem
Services on Pollinators, Pollination and Food Production.
Potts SG, Imperatriz-Fonseca VL, Ngo HT (eds). Bonn,
Germany: Secretariat of the Intergovernmental Science-
Policy Platform on Biodiversity and Ecosystem Services,
2016.
189	
West PC, Gerber JS, Engstrom PM et al. Leverage points
for improving global food security and the environment.
Science 2014;345,6194:325–328.
190	
WWF Germany. Enhancing NDCs For Food Systems:
Recommendations for Decision-Makers. WWF Germany,
2020.
191	
Willett W. Healthy Diets From Sustainable Food Systems:
Food Planet Health. The EAT-Lancet Commission, 2019.
192	
Conservation International. Exponential Roadmap for
Natural Climate Solutions. Washington DC: Conservation
International, 2022.
193	
WWF. Solving the Great Food Puzzle: 20 Levers to Scale
National Action. Gland, Switzerland: WWF, 2022.
194	
Ferri M, Arnés García M. From Nature-Negative to Nature-
Positive Production: A Conceptual and Practical Framework
for Agriculture Based on Thermodynamics. Budapest: FAO,
2023.
195	
Petry D, Avanzini S, Vidal A et al. Cultivating Farmer
Prosperity: Investing in Regenerative Agriculture. Boston
Consulting Group, 2023:26.
196	
Faure G, Geck M, Paracchini M-L et al. What Agroecology
Brings to Food Security and Ecosystem Services: A Review
of Scientific Evidence. 2024.
197	
Clark M, Hill J, Tilman D. The Diet, Health, and Environment
Trilemma. Annual Review of Environment and Resources
2018;43:109–34.
198	
GIST Impact. Natural Farming Through a Wide-Angle Lens:
True Cost Accounting Study of Community Managed
Natural Farming in Andhra Pradesh, India. GIST Impact,
Switzerland and India, 2023.
199	
Cheung, WWL, Reygondeau G, and TL Frölicher. Large
benefits to marine fisheries of meeting the 1.5°C global
warming target. Science 2016;354(6319): 1591–1594.
200	
Costello C, Ovando D, Clavelle T et al. Global fishery
prospects under contrasting management regimes.
Proceedings of the National Academy of Sciences
2016;113:5125–9.
201	
Naylor RL, Hardy RW, Buschmann AH et al. A 20-year
retrospective review of global aquaculture. Nature
2021;591:551–63.
202	
Costello C, Cao L, Gelcich S et al. The future of food from
the sea. Nature 2020;588:95–100.
203	
Loken B, DeClerck F, Willett W et al. Diets for a Better
Future: Rebooting and Reimagining Healthy and
Sustainable Food Systems in the G20. EAT, 2019.
204 WHO. Obesity and overweight. 2024.
205	
Springmann M, Spajic L, Clark MA et al. The healthiness
and sustainability of national and global food based dietary
guidelines: modelling study. BMJ 2020;370:m2322.
206	
Weindl I, Ost M, Wiedmer P et al. Sustainable food protein
supply reconciling human and ecosystem health: A Leibniz
Position. Global Food Security 2020;25:100367.
207	
Popkin BM, Adair LS, Ng SW. Global nutrition transition and
the pandemic of obesity in developing countries. Nutrition
Reviews 2012;70:3–21.
208 Government of India. Promoting Millets. 2023.
209	
WWF-UK. Driven to Waste: The Global Impact of Food Loss
and Waste on Farms. WWF-UK, 2021.
210	
Gatto A, Chepeliev M. Global food loss and waste
estimates show increasing nutritional and environmental
pressures. Nature Food 2024;5:136–147.
211	
Gilman E, Perez Roda A, Huntington T et al. Benchmarking
global fisheries discards. Sci Rep 2020;10:14017.
212	
WWF. Solving the Great Food Puzzle: Right Innovation,
Right Impact, Right Place. Gland, Switzerland: WWF, 2023.
213	
Galbiati GM, Yoshida M, Benni N et al. Climate-Related
Development Finance to Agrifood Systems: Global and
Regional Trends between 2000 and 2021. Rome: FAO,
2023:38.
214	
Climate Policy Initiative. Global Landscape of Climate
Finance 2023. Climate Policy Initiative, 2023:1–53.
215	
Damania R, Esteban B, Charlotte de F et al. Detox
Development: Repurposing Environmentally Harmful
Subsidies. Washington DC: World Bank, 2023.
216	
Sumaila UR, Ebrahim N, Schuhbauer A et al. Updated
estimates and analysis of global fisheries subsidies. Marine
Policy 2019;109:103695.
217	
Haegel NM, Kurtz SR. Global Progress Toward Renewable
Electricity: Tracking the Role of Solar (Version 3). IEEE J
Photovoltaics 2023;13:768–776.
218	
UNFCCC GST. Technical Dialogue of the First Global
Stocktake Synthesis Report by the Co-Facilitators on the
Technical Dialogue. United Arab Emirates: United Nations
Framework Convention on Climate Change, 2023.
219	
IEA. World Energy Outlook 2023. Paris: IEA, 2023.
220	
WWF, BCG. Building a Nature-Positive Energy
Transformation: Why a Low-Carbon Economy Is Better for
People and Nature. Washington, DC: WWF, 2023:36.
221	
IPCC. Climate Change 2022 – Impacts, Adaptation and
Vulnerability: Working Group II Contribution to the Sixth
Assessment Report of the Intergovernmental Panel on
Climate Change. 1st ed. Pörtner H-O, Roberts DC, Tignor
M, et al. (eds.). Cambridge, UK and New York, NY, USA:
Cambridge University Press, 2023.
222	
Vohra K, Vodonos A, Schwartz J et al. Global mortality
from outdoor fine particle pollution generated by fossil
fuel combustion: Results from GEOS-Chem. Environmental
Research 2021;195:110754.
223	
Gibon T, Hertwich EG, Arvesen A et al. Health benefits,
ecological threats of low-carbon electricity. Environ Res
Lett 2017;12:034023.
REFERENCES
WWF
LIVING
PLANET
REPORT
2024
92
224	
Jones NF, Pejchar L, Kiesecker JM. The Energy Footprint:
How Oil, Natural Gas, and Wind Energy Affect Land
for Biodiversity and the Flow of Ecosystem Services.
BioScience 2015;65:290–301.
225	
Yalew SG, Van Vliet MTH, Gernaat DEHJ et al. Impacts of
climate change on energy systems in global and regional
scenarios. Nat Energy 2020;5:794–802.
226	
Opperman JJ, Camargo RR, Laporte-Bisquit A et al. Using
the WWF Water Risk Filter to Screen Existing and Projected
Hydropower Projects for Climate and Biodiversity Risks.
Water 2022;14:721.
227	
Ciscar J-C, Dowling P. Integrated assessment of climate
impacts and adaptation in the energy sector. Energy
Economics 2014;46:531–8.
228	
Wiatros-Motyka M, Fulghum N. Global Electricity Mid-Year
Insights 2023. EMBER, 2023.
229	
IEA. Renewables 2023: Analysis and Forecast to 2028.
Paris: IEA, 2024.
230	
Energy Transitions Commission. Material and Resource
Requirements for the Energy Transition. Energy Transitions
Commission, 2023:130.
231	
Thieme ML, Tickner D, Grill G et al. Navigating trade-
offs between dams and river conservation. Glob Sustain
2021;4:e17.
232	
Hanssen SV, Steinmann ZJN, Daioglou V et al. Global
implications of crop-based bioenergy with carbon capture
and storage for terrestrial vertebrate biodiversity. GCB
Bioenergy 2022;14:307–21.
233 	
Sonter LJ, Dade MC, Watson JEM et al. Renewable energy
production will exacerbate mining threats to biodiversity.
Nat Commun 2020;11:4174.
234	
Greene N, Howe C. Down to the Wire: Progressive
Permitting Reforms Will Accelerate Renewable Energy and
Transmission Buildout and Help Meet U.S. Climate Targets.
NRDC, 2023:14.
235	
Patterson JJ, Thaler T, Hoffmann M et al. Political feasibility
of 1.5°C societal transformations: the role of social justice.
Current Opinion in Environmental Sustainability 2018;31:1–9.
236	
IEA. World Energy Investment 2022. Paris: IEA, 2022.
237	
Gall ET, Carter EM, Matt Earnest C et al. Indoor Air Pollution
in Developing Countries: Research and Implementation
Needs for Improvements in Global Public Health. Am J
Public Health 2013;103:e67–72.
238	
Mikati I, Benson AF, Luben TJ et al. Disparities in
Distribution of Particulate Matter Emission Sources by Race
and Poverty Status. Am J Public Health 2018;108:480–5.
239	
Biswas S, Echevarria A, Irshad N et al. Ending the Energy-
Poverty Nexus: An Ethical Imperative for Just Transitions.
Sci Eng Ethics 2022;28:36.
240	
IEA. Net Zero Roadmap: A Global Pathway to Keep the
1.5 °C Goal in Reach. Paris: IEA, 2023.
241	
REN21. Renewables 2024 Global Status Report Collection,
Global Overview. Paris: REN21 Secretariat, 2024.
242	
Boehm S, Jeffrey L, Schumer C et al. State of Climate
Action 2023. Berlin and Cologne, Germany, San Francisco,
CA, and Washington, DC: World Resources Institute, 2023.
243	
Energy Transitions Commission. Streamlining Planning
and Permitting to Accelerate Wind and Solar Deployment.
2023.
244	
Opperman JJ, Carvallo JP, Kelman R et al. Balancing
renewable energy and river resources by moving from
individual assessments of hydropower projects to energy
system planning. Frontiers in Environmental Science
2023;10:2410.
245	
Shirley R, Kammen D. Energy planning and development
in Malaysian Borneo: Assessing the benefits of distributed
technologies versus large scale energy mega-projects.
Energy Strategy Reviews 2015;8:15–29.
246	
Instituto Costarricense de Electricidad. Informe ejecutivo
del plan de expansion de la generacion 2018 – 2034. 2018.
247	
Opperman JJ, Baruch-Mordo S, Carvallo JP et al. Sustaining
the Last Rivers: The renewable revolution could keep dams
off the world’s remaining free-flowing rivers. American
Scientist 2019;107.
248	
CLEANaction. Nature-Safe Energy: Linking Energy and
Nature to Tackle the Climate and Biodiversity Crises.
WWF, 2023.
249	
Baruch-Mordo S, Kiesecker JM, Kennedy CM et al. From
Paris to practice: sustainable implementation of renewable
energy goals. Environ Res Lett 2019;14:024013.
250	
Joshi S, Mittal S, Holloway P et al. High resolution global
spatiotemporal assessment of rooftop solar photovoltaics
potential for renewable electricity generation. Nat Commun
2021;12:5738.
251	
Planning for Climate Commission. Tackling Climate Change
through Fast and Fair Permitting for Renewable Energy and
Hydrogen: Recommendations from the Planning for Climate
Coalition. 2023.
252	
US Department of the Interior. Obama Administration
Approves Roadmap for Utility-Scale Solar Energy
Development on Public Lands. 2019.
253	
WWF. WWF Discussion Paper: Just Energy Transformation.
Gland, Switzerland: WWF, 2021.
254	
Bakhtary H, Rynearson A, Morales V et al. Breaking Silos:
Enhancing Synergies across NDCs and NBSAPs. Gland,
Switzerland: World Wildlife Fund for Nature, 2023.
255	
Runhaar H, Wilk B, Driessen P et al. Policy Integration. In:
Biermann F, Kim RE (eds.). Architectures of Earth System
Governance. 1st ed. Cambridge University Press, 2020,
183–206.
256	
Biermann F, Hickmann T, Sénit C-A et al. Scientific
evidence on the political impact of the Sustainable
Development Goals. Nat Sustain 2022;5:795–800.
257	
Evison W, Low LP, O’Brien D. Managing Nature Risks: From
Understanding to Action. PWC, 2023.
258	
UNEP. State of Finance for Nature 2023: The Big Nature
Turnaround - Repurposing $7 Trillion to Combat Nature
Loss. Nairobi, Kenya: United Nations Environment
Programme (UNEP), 2023.
259	
Climate Policy Initiative, Chiriac D, Vishnumolakala H et
al. Landscape of Climate Finance for Agrifood Systems.
Climate Policy Initiative, 2023.
260	
FAO, UNDP, UNEP. A Multi-Billion-Dollar Opportunity
– Repurposing Agricultural Support to Transform Food
Systems. Rome, Italy: FAO, 2021.
261	
Woroniecki S, Spiegelenberg FA, Chausson A et al.
Contributions of nature-based solutions to reducing
people’s vulnerabilities to climate change across the rural
Global South. Climate and Development 2023;15:590–607.
262 Robeco. Robeco 2022 Stewardship Report. 2022.
263	
WWF, Nature^Squared. Bankable Nature Solutions:
Blueprints for Bankable Nature Solutions from across the
Globe to Adapt to and Mitigate Climate Change and to
Help Our Living Planet Thrive. WWF Netherlands, 2020:80.
264	
The Dutch Fund for Climate and Development. The Dutch
Fund for Climate and Development. 2024.
265	
Whiting K. Climate finance: What are debt-for-nature
swaps and how can they help countries? World Economic
Forum 2024.
266	
US Department of the Treasury. United States Signs
$20 Million Debt Swap Agreement with Peru to Support
Amazon Conservation. 2023.
267	
Cabrera N. H, Plantizer C, Yudelman T et al. Securing
Sustainable Financing for Conservation Areas: A Guide to
Project Finance for Permanence. Washington, DC: Amazon
Sustainable Landscape Program and WWF, 2021.
268	
WWF International. Securing Colombia’s natural heritage.
World Wildlife Fund 2022.
269	
Shames S, Scherr SJ. Mobilizing Finance across Sectors
and Projects to Achieve Sustainable Landscapes: Emerging
Models. EcoAgriculture Partners, 2020.
270	
Goldman L, Tsan M, Dogandjieva R et al. Inflection Point:
Unlocking Growth in the Era of Farmer Finance. 2016.
271	
NGFS. Nature-Related Financial Risks: A Conceptual
Framework to Guide Action by Central Banks and
Supervisors. 2023.
272	
Elderson F. The economy and banks need nature to
survive. The ECB Blog 2023.
273 WWF Singapore. SUSREG Tracker Assessment. 2024.
274	
TNFD. Taskforce on Nature-Related Financial Disclosures
(TNFD) Recommendations. 2023.
275	
TNFD. Taskforce on Nature-related Financial
Disclosures. 2024.
REFERENCES
WWF
LIVING
PLANET
REPORT
2024
93
Armenia
Australia
Austria
Azerbaijan
Belgium
Belize
Bhutan
Bolivia
Brazil
Bulgaria
Cambodia
Cameroon
Canada
Central African Republic
Chile
China
Colombia
Croatia
Democratic Republic
of Congo
Denmark
Ecuador
Fiji
Finland
France
Gabon
Georgia
Germany
Greece
Guatemala
Guyana
Honduras
Hong Kong
Hungary
India
Indonesia
Italy
Japan
Kenya
Korea
Laos
Madagascar
Malaysia
Mexico
Mongolia
Mozambique
Myanmar
Namibia
Nepal
Netherlands
New Zealand
Norway
Pakistan
Papua New Guinea
Paraguay
Peru
Philippines
Poland
Republic of Congo
Romania
Serbia
Singapore
Slovakia
Solomon Islands
South Africa
Spain
Suriname
Sweden
Switzerland
Tanzania
Thailand
Tunisia
Turkey
Uganda
Ukraine
United Kingdom
United States
Viet Nam
Zambia
Zimbabwe
WWF Associates

n 
Associação Natureza Portugal (Portugal)
	
n 
Emirates Nature (UAE)
	
n 
Fundación Vida Silvestre (Argentina)
	
n 
Pasaules Dabas Fonds (Latvia)
Publication details
Published in October 2024 by WWF – World Wide Fund for Nature (Formerly World Wildlife Fund),
Gland, Switzerland (“WWF”).
Any reproduction in full or in part of this publication must be in accordance with the rules below,
and mention the title and credit the above-mentioned publisher as the copyright owner.
Recommended citation:
WWF (2024) Living Planet Report 2024 – A System in Peril. WWF, Gland, Switzerland.
Notice for text and graphics: © 2024 WWF All rights reserved.
Reproduction of this publication (except the photos) for educational or other non-commercial purposes is
authorised subject to advance written notification to WWF and appropriate acknowledgement as stated
above. Reproduction of this publication for resale or other commercial purposes is prohibited without prior
written permission. Reproduction of the photos for any purpose is subject to WWF’s prior written permission.
Disclaimer:
The designation of geographical entities and the presentation of the material, do not imply the expression
of any opinion whatsoever on the part of WWF concerning the legal status of any country, territory, or area,
or of its authorities, or concerning the delimitation of its frontiers or boundaries.
WWF network offices
WWF
LIVING
PLANET
REPORT
2024
94
© 2024
Paper 100% recycled.
© 1986 Panda symbol WWF –
World Wide Fund for Nature
(Formerly World Wildlife Fund)
® “WWF ‘’ is a WWF
Registered Trademark.
WWF, Rue Mauverney 28,
1196 Gland, Switzerland.
Tel. +41 22 364 9111.
Fax. +41 22 364 0332.
For contact details and further
information, please visit our
international website at
livingplanet.panda.org.