
Recommended
More Related Content
What's hot
What's hot (20)
Viewers also liked
Viewers also liked (9)
Similar to Endosulfan has not contaminated yamuna river scientific report
Similar to Endosulfan has not contaminated yamuna river scientific report (20)
More from shreeramkannan
More from shreeramkannan (10)
Endosulfan has not contaminated yamuna river scientific report
- 1. Environ Monit Assess (2008) 144:329–340 DOI 10.1007/s10661-007-9996-4 Pesticide residues in river Yamuna and its canals in Haryana and Delhi, India C. P. Kaushik & H. R. Sharma & S. Jain & J. Dawra & A. Kaushik Received: 14 February 2007 / Accepted: 19 September 2007 / Published online: 28 November 2007 # Springer Science + Business Media B.V. 2007 Abstract Yamuna, a prominent river of India covers lution of this major Indian river, keeping in view its an extensive area of 345,843 km2 from Yamunotri vital link with life, are discussed in this paper. glacier through six Indian states. Residues of organ- ochlorine pesticides (OCPs) namely, isomers of HCH Keywords Organochlorine . Pesticide residues . and endosulfan, DDT and its metabolites, aldrin, diel- River . Yamuna . Canals drin, were analysed in water of river Yamuna along its 346 km stretch passing through Haryana–Delhi– Haryana and the canals originating from it. β-HCH, Introduction p.p′-DDT, p.p′-DDE and p.p′-DDD had maximum traceability in test samples (95–100%) followed by +- Organochlorine pesticides like HCH and DDT are ubiq- HCH, α-HCH and o.p′-DDD (60–84%) and o.p′- uitously found in all the components of the environ- DDT, δ-HCH and o.p′-DDE (7–30%) while aldrin, ment. Oceans are the ultimate sink for these pesticides dieldrin, α and β endosulfan remained below detec- which receive major rivers terminating into them. Pes- tion limits (BDL). The concentration of ΣHCH and ticide dynamics in the environment reveals occurrence ΣDDT at different sites of the river ranged between and movement of pesticide residues from soil by vola- 12.76–593.49 ng/l (with a mean of 310.25 ng/l) and tilization (Kaushik 1989 and 1991), from air (Kaushik 66.17–722.94 ng/l (with a mean of 387.9 ng/l), et al. 1987) by wet precipitation (Agarwal et al. 1987; respectively. In canals the values were found between Kumari et al. 2007a), and aerial fall-out (Kaushik et al. 12.38–571.98 ng/l and 109.12–1572.22 ng/l for 1991) into soil and water bodies. These pesticides also ΣHCH and ΣDDT, respectively. Water of Gurgaon reach water bodies by drift during spraying, soil canal and Western Yamuna canal contained maximum erosion, agricultural run off, leaching, municipal and and minimum concentration, respectively both of industrial wastes (Young and Heesen 1974; Goldberg ΣHCH and ΣDDT residues. Sources of these pesti- 1976; Harper et al. 1977; Rihan et al. 1978; Musick cides and suggested measures to check pesticide pol- 1979). The surface transport of pesticides and their run- off to the river depends on factors like slope, texture and porosity of soil, intensity of rainfall, erosivity of rain- C. P. Kaushik (*) : H. R. Sharma : S. Jain : J. Dawra : water, erodibility of soil, water table and solubility and A. Kaushik polarity of pesticides. Since water of rivers and canals Department of Environmental Science and Engineering, Guru Jambheshwar University of Science and Technology, is used for drinking purposes in India, it becomes Hisar 125 001 Haryana, India imperative to study the extent and magnitude of these e-mail: cpkaushik@rediffmail.com restricted or banned pesticides in these water bodies. DO09996; No of Pages
- 2. 330 Environ Monit Assess (2008) 144:329–340 Haryana state which is predominantly an agricultur- branches i.e. Sunder Branch (SB) and WYC main. al state in India extends between 27°39′N to 30°55′N Sunder Branch is mainly used for irrigating Hansi and Latitude and 74°27′ to 77°36′E longitude and covers a Tosham areas of Hisar and Bhiwani districts of total geographical area of 4,42,100 ha forming about Haryana State whereas the WYC main reaches Delhi 1.35% of the total area of the country. The state with a at Haiderpur waterworks. The Agra canal (AC) population of 21.08 million (Census of India 2001), emerges from River Yamuna at Okhla barrage in Delhi occupies an interesting position, as its north-eastern and passes through Faridabad, Ballabgarh, Palwal, part acts as Delhi upstream of Yamuna while its south Hodal regions of Southern Haryana before entering eastern part as Delhi down stream. River Yamuna one into the state of Uttar Pradesh. The Gurgaon canal of the major rivers of India with a total stretch of (GC) bifurcates from Agra canal at Meethapur in 345,843 km2, passes through Haryana state along its Haryana and flows parallel to Agra canal. It passes eastern border. River along with its canals is mainly through Faridabad, Gurgaon, Sohna and Hodal and responsible for supply of water to the majority of the leaves Haryana at Punhana. districts of the state and the National Capital, Delhi for drinking as well as irrigation purposes. Out of a Water sampling and analysis total drinking water supply of 2,700 million litres per day (mld), the Wazirabad waterworks supplies Sampling of water of river Yamuna from Hathnikund to 945 mld and Haiderpur waterworks supplies 900 mld Hassanpur, WYC from Tajewala barrage to Haiderpur of water to national capital of Delhi. The raw water for treatment plant, SB from Safido head to NH-10 bridge, these water works is drawn from the Yamuna River and Agra canal from Okhla to Hassanpur and Gurgon canal the Western Yamuna canal, respectively. from Meethapur to Ujjina was done in February, 1999. The presence of OCPs in water of river Yamuna A total of 44 samples, in triplicate, were collected. Site at selected sampling sites only has been reported specifications for the river and canals have been shown (Agarwal et al. 1986; Thakkar and Sarin 1987). The in Table 1 and position of the river and canals is present study was carried out, as no systematic data is depicted in the map (Fig. 1). The sampling sites have available on these pesticide residues in major stretch been chosen keeping in view the possibility of getting of 346 km of the river, and its canals flowing through accumulated residues in aquatic environment both the state of Haryana, predominantly an agricultural from agricultural run-off as well as from urban – state using significant quantities of pesticides. industrial area. Water samples were collected in the pre-cleaned, oven dried, hexane rinsed, amber coloured bottles of 1 L capacity and were sealed with screw caps Materials and methods lined with aluminium foil. River Yamuna originates from Yamunotri glacier near Experimental Bandarpunch (31°13′N 78°26′E) in the Mussorrie range of lower Himalayas at a height of 6,387 m The samples were extracted with hexane by using above mean sea level in the Uttarkashi district of conventional liquid–liquid extraction (LLE) method Uttarakhand. The river flows 1,367 km from here to immediately after bringing to the laboratory. This is a its confluence with the river Ganga at Allahabad in common method frequently used for the determina- the state of Uttar Pradesh. In the total 345,843 km2 of tion of organic pollutants in water (Tan 1992). One total catchment area of river Yamuna, Haryana state litre water sample was extracted with 40 ml of dis- has a share of 6.10%. tilled hexane and 2 g of anhydrous sodium sulphate in The Western Yamuna Canal (WYC) originates 1 L capacity separately funnel and shaken well for 4– from the river Yamuna at Tajewala barrage near 5 min. The upper hexane layer was collected in a flat Hathnikund in Haryana about 200 km upstream of bottom flask and the remaining portion was extracted Delhi. It flows through the agricultural and industrial twice with 30 ml of hexane by gently mixing the sam- belts of Yamunanagar, Karnal, Panipat and Sonepat ple with teflon coated magnet on a magnetic stirrer. just parallel to the river Yamuna before entering Delhi. Total 100 ml hexane was pooled and demoisturised by The WYC branches off at Munak head into two passing over Na2SO4 (anhydrous) and concentrated to
- 3. Environ Monit Assess (2008) 144:329–340 331 Table 1 Sampling locations of River Yamuna (Y), Western Yamuna Canal (WYC), Sunder Branch (SB), Agra Canal (AC) and Gurgaon Canal (GC) in Haryana Sampling station Distance from origin (km) Land use in adjoining area River Yamuna Y-1 Hathnikund 01 Rocky and agricultural Y-2 Kalanor 41 Industrial and residential Y-3 Kundaghat 62 Industrial and residential Y-4 Manglora Bridge 107 Agricultural and industrial Y-5 Kairana 150 Agricultural and industrial Y-6 Khojkipur 164 Agricultural and industrial Y-7 Mimarpur Ghat 184 Agricultural and industrial Y-8 Garh Bridge 200 Agricultural and industrial Y-9 Bhairabakipur 208 Agricultural and industrial Y-10 Palla Ghat 214 Agricultural and industrial Y-11 Wazirabad 225 Industrial and residential Y-12 Okhla 247 Industrial and residential Y-13 Dadasiya 268 Industrial and agricultural Y-14 Hassanpur 310 Agricultural Western Yamuna Canal WYC-01 Tajewala head 2 Rocky, agricultural, residential WYC-02 Yamunanagar 40 Industrial area; Yamunanagar Complex (distillery, sugar, starch, utensils, paper mill) WYC-03 Karnal 125 Agricultural WYC-04 Munak Agricultural WYC-05 Haiderpur Treatment plant 236 Industrial zone, Haiderpur water works Sunder Branch SB-01 Safido head 0 Agricultural SB-02 Ada Urlana 21 Agricultural SB-03 Saifabad 35 Agricultural SB-04 Mall Savana head 46 Agricultural SB-05 Bodipul (Nandgarh) RD33 56 Agricultural SB-06 Gatauli 67 Agricultural SB-07 100 m away from Gatauli 67 Agricultural (mixing of ground water) SB-08 Karela 78 Agricultural SB-09 Bass 87 Agricultural SB-10 National highway bridge, Mundhal 100 Agricultural Agra Canal AC-01 Okhla head 0 Abundant foaming, eutrophication in standing water AC-02 Faridabad 37 bridge 6 Industrial and residential AC-03 Old Faridabad bridge 11 Residential AC-04 Chandwai bridge 28 Agricultural AC-05 Mandkola village 41 Agricultural AC-06 Janoli 46 Agricultural AC-07 Ghodi 54 Agricultural AC-08 Hassanpur 73 Agricultural Gurgaon Canal GC-01 Meethapur 0 Residential, waste dumping from Badarpur Industrial area GC-02 Mowai 5 Residential, dumping of waste through pipeline GC-03 Banoli 23 Residential GC-04 Pratapgrah 26 Residential, industrial and agricultural GC-05 Bijopur 37 Agricultural GC-06 Mindkola 45 Agricultural GC-07 Ujjina 53 Agricultural
- 4. 332 Environ Monit Assess (2008) 144:329–340
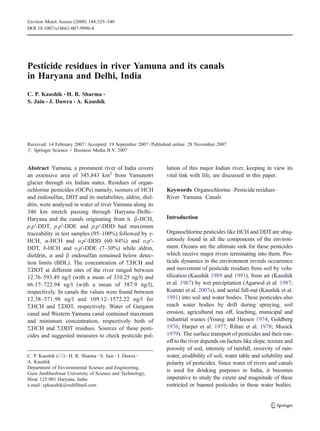
- 5. Environ Monit Assess (2008) 144:329–340 333 R Fig. 1 Course of river Yamuna and the sampling locations Table 2 Retention times, mean % recoveries and minimum (Inset: map of Haryana) detection limits of organochlorine pesticide standards by LLE with hexane as extracting solvent about 5–6 ml in a rotary evaporator (Buchhi type) at OCPs Retention time % recoveries Minimum 50–60 °C. The extract was cleaned by deactivated (min) on glass detection alumina (basic) column chromatography with 100 ml column limit (ng) of hexane and concentrated to 2 ml for analysis on a α-HCH 3.83 90 0.5 gas liquid chromatograph (GLC). +-HCH 4.77 87 0.4 Hexane and acetone used as solvents were of β-HCH 5.60 92 0.6 pesticide residue analysis grade and were distilled in δ-HCH 6.40 85 0.8 all glass distillation apparatus prior to use. Calibration Aldrin 7.35 88 0.04 of the instrument was done before the sample anal- o.p′-DDE; 10.40 83 0.7 ysis, using the standards of the pesticides obtained α-endosulfan 11.50 88 0.3 from Labour Dr. Ehrenstorfer, D-8900 Augsburg. p.p′-DDE 12.30 86 0.4 Qualitative and quantitative analyses were made by Dieldrin 13.11 87 0.14 o.p′-DDT 15.11 82 0.7 comparing the retention time and peak area of the o.p′-DDD 15.79 80 0.4 samples, respectively with those of the calibrated p.p′-DDD 16.15 86 0.5 reference standards. β-endosulfan 16.67 87 0.4 Analysis of pesticide residues was carried out on a p.p′-DDT 17.25 83 0.7 Chemito series 2865, microprocessor controlled gas chromatograph, equipped with electron capture detec- tor, having Nickel (63) foil as the electron source. The column specifications and operating conditions were: In river Yamuna, WYC, SB, AC and GC the range Column: 2 m glass, 0.25 in. I.D., packed with of temperature was 10.5–24 °C, 15.0–26.2 °C, 14.6– 1.5% OV-17/1.95% QF-1 on Gas Chrom Q, 100– 16.8 °C, 20.8–25.9 °C and 18.0–21.0 °C, respectively 120 mesh. while pH varied from 6.9–7.8, 7.8–8.6, 7.0–7.5, 6.0– Temperatures: Column 200 °C (6 min), 215 °C 6.9 and 7.14–7.99, respectively and the electrical (5 min) and 230 °C (5 min). Detector 280 °C, conductivity ranged from 0.2–1.1, 0.10–0.30, 0.3, Injector 220 °C 0.6–0.8 and 0.65–1.82 dS m−1 respectively. The water Carrier Gas: Nitrogen at a flow rate of 50 ml/min. quality of river Yamuna at the studied sites has already been discussed elsewhere by Ravindra et al. Confirmation of the identity of the organochlorine (2003) and the presence of heavy metals in these residues was done on Hewlett Packard series 5890 II water bodies by Kaushik et al. (2001, 2003). The gas chromatograph with the following operating levels (range and arithmetic mean±SD values) of conditions: pesticides detected in water samples of river Yamuna Column: BP5 Capillary 30 m, 0.25 mm I.D. and its canals are discussed here. All the samples Temperatures: Column 135 °C (20 min), 155 °C were analyzed in triplicates. Residues of HCH and (15 min), 210 °C (10 min) and 250 °C (5 min), DDT were found in all the water samples from river Detector 300 °C, Injector 250 °C and canals while aldrin and dieldrin remained below Carrier Gas: Nitrogen at a flow rate of 1 ml/min. detection limit (BDL) (Table 3). The mean concentra- tion of HCH and DDT at different sites is depicted in The identities were further confirmed by chemical de- Table 3 and Figs. 2 and 3. The maximum mean HCH hydrochlorination and subsequent gas chromatography. was found in Gurgaon canal (338.21 ng/l) followed by river Yamuna (310.25 ng/l), SB (184.58 ng/l), AC Results and discussion (161.26 ng/l) and WYC (76.75 ng/l). The relative abundance of HCH isomers in river Yamuna and its All the samples were analyzed in triplicate. Retention canals has been given in Figs. 2 and 3. times, mean % recoveries and minimum detection In river Yamuna the concentration of HCH ranged limits for various pesticides are mentioned in Table 2. between 12.76–593.49 ng/l with an average value of
- 6. 334 Environ Monit Assess (2008) 144:329–340 Table 3 HCH and DDT residues (range, mean±SD, ng/l) in water of Yamuna River and its canals Sr. no. Pesticide Yamuna WYC Sunder Branch Agra Canal Gurgaon canal All canals (n=14) (n=5) (n=10) (n=8) (n=6) (n=29) 1. α-HCH BDL*–166.89 BDL–13.68 BDL–134.73 BDL–39.9 BDL–16.81 BDL–134.73 63.57±59.39 3.85±6.00 30.03±40.65 16.97±13.10 2.80±6.87 16.28±26.87 2. +-HCH BDL–207.71 11.78–47.78 BDL–218.99 BDL–81.50 19.06–246.64 BDL–246.64 113.87±70.88 25.86±15.85 81.42±77.47 48.86±33.57 145.61±96.15 76.11±74.25 3. β-HCH 12.27–242.29 19.09–70.90 13.05–162.77 11.91–164.68 22.60–316.98 11.91–316.98 117.46±70.68 45.60±20.44 71.17±59.99 92.32±59.53 184.91±118.64 96.13±83.59 4. δ-HCH BDL–58.81 BDL BDL BDL BDL BDL 12.02±18.93 5. ΣHCH 12.76–593.49 38.23–134.59 35.01–455.86 12.38–298.41 42.23–571.98 12.38–571.98 310.25±191.57 76.75±38.60 184.58±135.89 161.26±108.01 338.21±219.04 191.34±157.14 6. o.p′-DDT BDL–20.49 BDL BDL–11.54 BDL BDL BDL–11.54 1.46±5.97 2.06±4.40 0.47±2.22 7. p.p′-DDT 25.38–470.67 78.70–123.19 33.77–183.07 164.54–743.41 307.54–1423.44 33.77–1423.44 170.89±134.40 103.11±18.18 101.45±45.63 421.19±163.97 843.02±462.72 343.36±363.47 8. o.p′-DDE BDL–6.67 BDL–1.54 BDL–1.38 BDL–1.66 BDL–2.00 BDL–2.00 0.90±1.99 0.35±0.67 0.32±0.51 0.20±0.59 0.56±0.89 0.34±0.63 9. p.p′-DDE 22.86–402.18 29.44–86.22 12.791–123.87 31.84–375.00 124.29–233.13 12.79–375.00 183.91±105.02 57.30±23.77 65.13±34.91 193.50±120.52 179.48±43.03 124.88±91.02 10. o.p′-DDD BDL–17.99 1.56–6.14 BDL–9.00 BDL 2.14–4.92 BDL–9.00 4.12±4.99 3.97±1.99 3.56±3.41 3.37±0.97 2.61±2.69 11. p.p′-DDD BDL–57.20 3.0–29.31 5.67–69.08 5.16–50.23 BDL–159.52 BDL–159.52 19.14±15.36 11.64±10.71 16.44±18.88 23.28±14.79 83.13±72.71 31.29±43.24 12. ΣDDT 66.17–722.94 113.57–222.21 109.12–291.35 308.11–1141.83 680.25–1572.21 109.12–1572.22 387.90±181.18 178.03±40.83 197.10±61.31 643.43±261.56 1114.51±383.26 506.74±427.56 * BDL – Below detection limit, Mean of three replicates. 310.25 ng/l. The minimum and maximum concen- 2 Km away from its origin and the maximum con- trations were observed at Bhairabakipur and Kalanor centration of 134.59 ng/l at Munak (WYC-04) having sites of the river. To determine the pollution load of agricultural fields. The concentration of HCH prior to the river in Haryana and Delhi states, the concentra- the origin of WYC at Y-1 was 298.54 ng/l which shows tion of OCPs was studied under three sections of river that the intake water is a source of pesticide pollution. In i.e. Section-I of Haryana state and Delhi upstream SB the minimum and maximum concentrations of HCH (Y-01 to Y-10), Section-II of Delhi State (Y-11 and were observed in Karela (SB-08) and Bodipul (SB-05) Y-12) and Section-III (Y-13 and Y-14) again of Haryana sites, respectively. The SB originates from WYC at state and Delhi down stream. The mean concentration Munak (WYC-04) having ΣHCH concentration of of ΣHCH in upstream, Delhi and down stream of 134.58 ng/l and in 60% of the sampling sites of SB, river Yamuna were 248.89, 468.40 and 458.88 ng/l, the concentration of ΣHCH exceeded the values that of respectively. The high concentration of ΣHCH in Delhi its intake water, indicating other sources of HCH section in the present study and in different lakes/ pollution. In Agra canal the concentration of ΣHCH reservoirs of Delhi (CPCB 2000) and in their benthic ranged from 12.38 to 298.41 ng/l. At all the sampling macroinvertebrates (Sharma et al. 2000) has been due to the usage of these pesticides in mosquito control (CPCB 2000). In WYC the minimum concentration of ΣHCH i.e. Fig. 2 Relative abundance of DDT and its metabolites (a), b isomers of HCH (b), and total DDT and total HCH (c) in water 38.23 ng/l was found in Tajewala head (WYC-01) just of river Yamuna
- 7. Environ Monit Assess (2008) 144:329–340 335
- 8. 336 Environ Monit Assess (2008) 144:329–340 Fig. 3 Relative abundance of DDT and its metabolites (a), isomers of HCH (b), and total DDT and total HCH (c) in water of canals of river Yamuna sites, concentration of ΣHCH remained lower than that for AC water. Except some sites of AC, a declining trend of intake water of AC i.e. river Yamuna at Okhla (Y-12) in ΣHCH concentration was observed. The concentra- had ΣHCH of 572.10 ng/l. As discussed above the tion of ΣHCH in Gurgaon canal was minimum at 42.23 already contaminated water of river Yamuna of Delhi ng/l at Meethapur (GC-01) and maximum at 571.98 ng/ section was one of the main sources of ΣHCH pollution l at Bijopur (GC-05). In the studied Yamuna river and
- 9. Environ Monit Assess (2008) 144:329–340 337 all canals the maximum mean concentration of HCH) were used. Although restricted use of lindane is ΣHCH was in this canal which showed further allowed in India, industries engaged in export of + increasing trend from upstream to downstream sites HCH generate α, β and δ as by-product and discard indicating additional pollution sources of Gurgaon this waste in the open (Prakash et al. 2004). Even in canal. countries where the use of insecticide HCH has been All the studied water samples were within maxi- discontinued for a number of years, the problem of mum permissible limit (MPL) of 3,000 ng/l for residues of all isomers of HCH remains because of the ΣHCH residues in drinking water (WHO 1971). high persistence and inter-conversion of these isomers However, on comparing with that of the European in soil (Steinwandter and Schluter 1978). The pes- Commission (1998) only 37% were within MPL of ticide residues which lie in the soil due to earlier 100 ng/l. The mean concentration of ΣHCH in river applications become a source of pesticide pollution of Yamuna (310.25 ng/l) was less as compared to that river water during agricultural run-off. The occurrence observed in some other Indian rivers i.e. river Krishna of relatively higher proportions of β and + HCH as and Godavari during 1993 (Reddy et al. 1997), river compared to α and δ is due to the fact that β HCH is Gandak during 1995–1996 (Srivastava et al. 1996). recalcitrant and the use (though restricted) of + HCH The ΣHCH concentration in river Ganga during still continues. Moreover, the loss of various isomers 1991–1992 (Agnihotri et al. 1994) was comparable due to volatilization depending upon their vapour pres- to the levels found in the present study. However, sure (Kaushik 1989) from the time of application and when compared with that of world rivers the mean run-off to join water bodies and differential solubility concentration of ΣHCH in Yamuna River was still explains variation in distribution and abundance in high as compared with that of river Liaohe in China relation to the proportion of their occurrence in the in during 1998 (Zhang et al. 2000), Yongding River in the river/canal water. Kumari et al. (2007b) have China during 2000 (Wang et al. 2003) and Tana River reported HCH concentration up to 0.051 μg/g in the in Kenya (Lalah et al. 2003). paddy wheat-paddy cotton and sugarcane field soils. In the present study the mean concentration of Prakash et al. (2004) have reported total HCH (α, β , ΣHCH in all the studied canals (191.34 ng/l) was + and δ) residues of up to 212.20 μg/kg in the surface quite low when compared with ΣHCH concentration soils of Delhi and adjoining areas of Haryana and in canals studied in 1991 and 1999 from Andhra Uttar Pradesh. They have reported still high concen- Pradesh and Tamil Nadu states of India, respectively tration of total HCH i.e. 637.00 mg/kg in soil sample (Reddy et al. 1997; Krishnamurthi 1999). However, of Indian Pesticide Limited (IPL), Lucknow. These when the concentration of ΣHCH in western Yamuna pesticides contaminate drinking water, the fact which canal was compared with that of our earlier investi- had caused considerable concern as various laborato- gation the present levels were found to be higher. ries detected pesticide residues in different brands of Among HCH isomers, β-HCH was found in all mineral water with the total HCH concentration of water samples and had concentration more than α- 24.10 μg/l (Prakash et al. 2004), and the highest HCH and +-HCH in more than 80% samples. In river concentration of lindane i.e. 0.0042 mg/l in various water the concentration of β-HCH ranged between brands of soft drinks (Centre for Science and Envi- 12.27–242.29 ng/l with a mean value of 117.46 ng/l ronment 2003). while in four canals the range was found between Water samples were also analysed for aldrin, 11.91–316.98 ng/l with an average concentration of dieldrin, α- and β-endosulfan. These pesticides re- 96.13 ng/l. The presence of β-HCH as the main iso- mained below the detection limit. Endosulfan sulfate mer contributing to ΣHCH in the studied river and could not be analysed. Singh (2001) also could not canals indicates an old source of pollution due to this detect endosulfan sulfate in any soil or groundwater isomer’s least reactiveness and most persistence among sample from Agra City. Sankararamakrishnan et al. HCH isomers (Wang et al. 2003). (2005) reported absence of endosulfan residues in Until ban on the use of HCH was imposed in 1997, Ganga River water and groundwater from agricultural two forms of HCH, technical HCH (a mixture of α, and industrial areas of Kanpur, Uttar Pradesh, India, β, +, and δ HCH in the proportion of 55–80, 5–14, which may be attributed to limited application of this 8–15 and 2–16%, respectively) and lindane (only + pesticide in this region.
- 10. 338 Environ Monit Assess (2008) 144:329–340 The mean concentration of ΣDDT in studied river sources of origin source (Y-1) indicating the origin and canals was observed in the order: Guargon canal > itself as a source of pollution. In SB the minimum Agra canal > Yamuna > Sunder branch and Western and maximum values of ΣDDT were found in Mall Yamuna canal. Except 19% samples, the concentration Savana Head (SB-04) and Karela (SB-08), respec- of ΣDDT was more than ΣHCH in all the water tively. The first four sampling (SB-01 to 04) sites samples analysed. HCH and DDT remain in soil for showed a declining while others (SB-05 to 09) an quite sometime. The high value of DDT reported in increasing trend. The high concentration of p.p′-DDT water is either from its residues in the environment or in these sites reflects the current use of DDT in the its current use in mosquito control/public health pro- corresponding areas. grammes in the catchment areas. However, higher In Agra canal the concentration of ΣDDT ranged vapour pressures of HCHs than DDTs facilitate rela- between 308.11–1141.83 ng/l at Hassanpur (AC-08) tively rapid atmospheric dissipation in the tropics, and Faridabad 37 bridge (AC-02) with a mean con- leaving fewer residues in soils and water (Kaushik centration of 643.43 ng/l. The canal water contained 1991; Kannan et al. 1995). very high concentration of ΣDDT when compared to In river Yamuna the maximum and minimum value its source of origin (Y-12), indicating use of DDT in the of ΣDDT was found at Kalanor (702.94 ng/l) and area. In 1996–1997 concentration of ΣDDT ranged Okhla barrage (66.17 ng/l), respectively. However, in between BDL-511.80 ng/l in the canal water at 26 km three segments of river Yamuna the most polluted downstream of Delhi (CPCB 2000). stretch, Delhi (Section II) had minimum concentration Gurgaon canal had the highest concentration of of ΣDDT in water, the maximum being in down- ΣDDT among all the studied canals and the river, stream stretch of the river. The organic matter adsorbs had further its minimum and maximum values of these pesticides and other pollutants and settles down 680.25 ng/l to 1,572.22 ng/l observed at Pratapgarh in form of sludge (CPCB 2000). In this section the (GC-04) and Bijopur (GC-05), respectively. As ob- estimated BOD load of 682.70 MT/day, was contrib- served earlier in case of SB and Agra canal, Gurgaon uted by domestic (449.85 MT/day), by industrial canal also has high concentrations of ΣDDT from its (127.32 MT/day) and other sources (105.53 MT/day) source of origin. The consumption of technical grade (CPCB 2000). Low concentration of heavy metals pesticide in India during the study period (1998–1999) and organochlorine pesticides were earlier observed was 57,240 MT (of which 60%, 34,628 MT, were in water of this stretch by Kaushik et al. (2001) and insecticides) and in Haryana it was about 5,030 MT Sharma et al. (2003), respectively while the accumu- (Agnihotri 2000). lated highest levels of OCPs in this section of river in The relative abundance of DDT and its metabolites in benthic macroinvertebrates was observed by (Sharma river Yamuna and its canals has been given in Figs. 2 et al. 2000). and 3. The mean concentration of ΣDDT in river The present study was conducted during February, Yamuna (387.90 ng/l) was quite low as compared to 1999, a period having no or scanty rains. Although values reported in river Krishna in 1993 (Reddy et al. not much load of agricultural run-off/dilution by rain 1997) but remained high in comparison to river Ganga is experienced and the sediments were also not (Agnihotri et al. 1994) and river Godavari (Reddy et al. analysed for pesticide residues, it was thought worth- 1997). However, the concentration of ΣDDT (66.17– while to conduct the study in order to assess pesticide 722.94 ng/l) in river Yamuna was found to be less residue concentration during this period of time as the when compared with earlier studies on the river during water is used for drinking purposes throughout the 1976–1978 (Agarwal et al. 1986) and 1996–1997 year. In fact, extensive regular monitoring should be (CPCB 2000). Similarly, the mean concentration of done to evaluate the extent of pesticide pollution of ΣDDT in water of canals was 506.74 ng/l which was this major river and its canals. low when compared with other canals in different In WYC the minimum concentration of ΣDDT states of India (Reddy et al. 1997; Krishnamurthi 1999). (113.57 ng/l) was observed in water of Tajewala Head The p.p′-DDT undergoes slow degradation to p.p′- (WYC-01) and maximum (222.21 ng/l) at Munak DDE and p.p′-DDD in natural environment by chem- (WYC-04). Lower levels of DDT were found at all ical and biological processes (Wedemeyer 1967; the sampling sites of WYC when compared with its Baxtor 1990). The ratio of (p.p′-DDE+p.p′-DDD)/
- 11. Environ Monit Assess (2008) 144:329–340 339 p.p′-DDT provides an indication of the extent of re- References cent release of DDT into the environment, with the ratio increasing over time as the DDT degraded. In Agarwal, H. C., Kaushik, C. P., & Pillai, M. K. K. (1987). river Yamuna the ratio was between 0.15–13.07 and Organochlorine insecticide residues in the rain water in Delhi, India. Water, Air and Soil Pollution, 32, 293–302. at only four sites the ratio was less than one. In Agarwal, H. C., Mittal, P. K., Menon, K. B., & Pillai, M. K. K. canals, except in five samples the ratio was less than (1986). DDT residues in the river Jamuna in Delhi, India. one. From the ratio and nature/types of metabolites Water, Air and Soil Pollution, 28, 89–104. we can say that in river Yamuna it was the earlier use Agnihotri, N. P. (2000). Pesticide consumption in agriculture in India – An update. Pesticide Research Journal, 12(1), of DDT in the catchment areas, as a possible source 150–155. of pollution. In canals the illegal use of these pes- Agnihotri, N. P., Gajbhiye, V. T., Kumar, M., & Mohapatra, S. P. ticides by the users and release from contaminated (1994). Organochlorine insecticides in Ganga river water soils were the main sources of pollution. near Farrukhabad, India. Environmental Monitoring and Assessment, 30, 105–112. Baxtor, R. M. (1990). Reductive dechlorination of certain chlorinated organic compounds by reduced haematin Conclusions and control measures compared with their behaviour in the environment. Chemosphere, 21, 451–458. Census of India (2001). www.censusindia.net/results/index.html From the present study it can be concluded that river Centre for Science and Environment (2003). www.downtoearth. Yamuna and its canals are contaminated with HCH and org.in DDT residues. In river water HCH was more while in CPCB (2000) Water quality status of Yamuna river. Assessment canals more DDT residues were observed. All the and Development of River Basin, Series: ADSORBS/32/ 1992–2000, Central Pollution Control Board, Delhi, studied water samples were within the maximum per- pp.1–156. missible limit (MPL) of 3,000 ng/l for ΣHCH residues European Commission (1998). Directive 98/93/EEC. while 03 samples had crossed the MPL of 1,000 ng/l of Goldberg, E. D. (1976). Pollution history of estuarine sediments. ΣDDT in drinking water (WHO 1971). However, on Oceanus, 19, 18–26. comparing with European Commission (1998) only Harper, D. B., Smith, R. V., & Gotto, D. M. (1977). BHC residues of domestic origin: a significant factor in pollution of fresh 37% were within MPL of 100 ng/l of ΣHCH while water in Northern Ireland. Environmental Pollution, 12, all the samples crossed 100 ng/l of ΣDDT. Conse- 223–233. quent upon banning/restriction on the use of persis- Kannan, K., Tanabe, S., & Tatsukawa, R. (1995). Geographical tent organochlorine compounds in India, the levels distribution and accumulation features of organochlorine residues in fish in tropical Asia and Oceania. Environmental of their residues have been coming down in river science & technology, 29, 2673–2683. and canals also. Kaushik, C. P. (1989). Loss of HCH from surface soil layers Treatment of water should be done before use as under subtropical conditions. Environmental Pollution, 59, in many samples the concentration of the studied 253–264. Kaushik, C. P. (1991). Persistence and metabolism of HCH and pesticides exceeded the permissible limits. There is DDT in soil under sub-tropical conditions. Soil Biology a need for awareness among farmers so that illegal and Biochemistry, 23(2), 131–134. use can be controlled. Strict action against sellers of Kaushik, C. P., Agarwal, H. C., & Pillai, M. K. K. (1991). Dry banned or spurious pesticides and adoption of inte- aerial fallout of organochlorine insecticides residues in Delhi, India. Environmental Pollution, 71, 83–86. grated pest management practices could be the pos- Kaushik, A., Jain, S., Dawra, J., Sahu, R., & Kaushik, C. P. sible ways to overcome/bring down the present levels (2001). Heavy metal pollution of river Yamuna in the in future. The illegal use of DDT in cattle sheds and industrially developing state of Haryana. Indian Journal of vegetable fields was observed in the command areas Environmental Health, 43(4), 64–168. of both Gurgaon canal and Agra canal which should Kaushik, A., Jain, S., Dawra, J., & Sharma, P. (2003). Heavy metal pollution in various canals originating from river be monitored for corrective measures. Yamuna in Haryana. Journal of Environmental Biology, 24 (3), 331–337. Acknowledgements The authors wish to thank Environment Kaushik, C. P., Pillai, M. K. K., Raman, A., & Agarwal, H. C. Department, Govt. of Haryana for providing financial assis- (1987). Organochlorine insecticide residues in air in Delhi, tance in the form of major research project ‘Water quality of India. Water, Air and Soil Pollution, 32, 63–76. major rivers and canals in Haryana’ under which the sampling Krishnamurthi, V. V. (1999). Monitoring of pesticide residues for the present study was also done. Assistance provided by Er. in lower Bhavani project canal water. Pestology, XX111(8), Anil Haritash in various forms is also thankfully acknowledged. 34–35.
- 12. 340 Environ Monit Assess (2008) 144:329–340 Kumari, B., Madan, V. K., & Kathpal, T. S. (2007a). Pesticide Sharma, H. R., Trivedi, R. C., Akolkar, P., & Gupta, A. (2003). residues in rain water from Hisar, India. Environmental Micropollutants levels in macroinvertebrates collected Monitoring And Assessment, Online, doi:10.1007/s10661- from drinking water sources of Delhi, India. International 006-9601-2. Journal of Environmental Studies, 60(2), 99–110. Kumari, B., Madan, V. K., & Kathpal, T. S. (2007b). Status of Singh, R. P. (2001). Composition of organochlorine pesticide levels insecticide contamination of soil and water in Haryana, in soil and ground water of Agra, India. Bulletin of India. Environmental Monitoring And Assessment, Online, Environmental Contamination and Toxicology, 67, 126–132. doi:10.1007/s10661-007-9679-1. Srivastava, V. K., Singh, B. B., Kumar, U., Gupta, R. P., & Lalah, J. O., Yugi, P. O., Jumba, I. O., & Wandiga, S. O. (2003). Shukla, K. C. (1996). Organochlorine pesticide residues Oranochlorine pesticide residues in Tana and Sabaki rivers analysis in river water and fishes. Journal of Environmental in Kenya. Bulletin of Environmental Contamination and Research, 6(4), 163–170. Toxicology, 71, 298–307. Steinwandter, H., & Schluter, H. (1978). Experiments on Musick, J. (1979). The role of deep-sea organisms in monitoring lindane metabolism in plants. IV: A kinetic investigation. environmental xenobiotics. In N. P. Lupke (Ed.) Monitoring Bulletin of Environmental Contamination and Toxicology, Environmental Materials and Specimen Banking (pp. 470– 20, 174–179. 478). The Hague: Martinus Hijhoff Publishers. Tan, G. H. (1992). Comparison of solvent extraction and solid- Prakash, O., Suar, M., Raina, V., Dogra, C., Pal, R., & Lal, R. phase extraction for the determination of organochlorine (2004). Residues of hexachlorocyclohexane isomers in pesticide residues in water. Analyst, 117, 1129. soil and water samples from Delhi and adjoining areas. Thakkar, N., & Sarin, R. (1987). Presence of DDT and its Current Science, 87(1), 73–77. metabolites in Delhi water source. Journal of the IWWA, Ravindra, K., Ameena, M., Monika, R., & Kaushik, A. (2003). XiX(3), 199–204. Seasonal variations in physico-chemical characteristics of Wang, X. T., Chu, S. G., & Xu, X. B. (2003). Organochlorine river Yamuna in Haryana and its ecological best-designated pesticide residues in water from Guanting reservoir and use. Journal of Environmental Monitoring, 5, 419–426. Yongding River, China. Bulletin of Environmental Con- Reddy, D. J., Rao, B. N., Reddy, K. N., Sultan, M. A., & Babu, T. R. tamination and Toxicology, 70, 351–358. (1997). Monitoring of pesticide residues in river, tank and Wedemeyer, G. (1967). Dechlorination of 1.1.1-trichloro-2.2-bis canal water. Pesticide Research Journal, 9(1), 97–100. (p-chlorophenyl) ethane by aerobacter aerogenes. Applied Rihan, T. I., Matofa, H. T., Caldwell, G., & Frazier, L. (1978). Microbiology, 15, 569–574. Chlorinated pesticides and heavy metals in streams and lakes WHO (1971). International standards for drinking water (3rd of Northern Mississippi water. Bulletin of Environmental Edrd ed.). World Health Organisation: Geneva. Contamination and Toxicology, 20, 568–572. Young, D. R., & Heesen, T. C. (1974). Inputs and distributions Sankararamakrishnan, N., Sharma, A. K., & Singh, R. (2005). of chlorinated hydrocarbons in three southern California Organochlorine and organophosphorus pesticide residues harbors. National Technical Information Service, PB-275, in ground water and surface water of Kanpur, Uttar 412–431. Pradesh, India. Environmental International, 31, 113–120. Zhang, X. F., Quan, X., Chen, J. W., Zhao, Y. Z., Chen, S., Sharma, H. R., Gupta, A., & Trivedi, R. C. (2000). Organochlorine Xue, D. M., & Yang, F. L. (2000). Investigation of pesticide residues in benthic macroinvertebrates from Western polychlorinated organic compounds (PCOCs) in middle Yamuna canal in Haryana, India. Ultra Scientist of Physical and lower reaches of Liaohe river. China Environmental Sciences, 12(1), 39–44. Science, 20, 31–35.