SlideShare a Scribd company logo
1 of 251
Download to read offline
Contents


         Preface ...............................................................................................vii
         Introduction .....................................................................................viii
         About the census ...............................................................................ix
         Technical notes...................................................................................x


   CHAPTERS
   1 Population                                                                                         1–32
         Overview..............................................................................................2
         From generation to generation .........................................................9
         Where do Australians live?................................................................16
         On the move .....................................................................................24


   2 Cultural diversity                                                                               33–58
         Overview............................................................................................34
         Second generation Australians.........................................................46
         Religion across the generations.......................................................54


   3 Living arrangements                                                                              59–88
         Overview............................................................................................60
         Children’s living arrangements ........................................................74
         Families with young children: a Sydney case study........................81


   4 Community                                                                                     89–112
         Overview............................................................................................90
         Volunteering across Australia.........................................................103
         Caring across the life cycle .............................................................107


   5 Education                                                                                   113–135
         Overview..........................................................................................114
         Adult education across the generations........................................123
         School teachers...............................................................................129


_______________________________________________________________________________________
                                                                   ABS · A Picture of the Nation · 2070.0 · 2006      iii
Contents


     6 Work                                                                                   137–172
         Overview..........................................................................................138
         Skill shortages .................................................................................151
         Generations of employment ..........................................................159
         Driving to work ...............................................................................167


     7 Economic resources                                                                     173–202
         Overview..........................................................................................175
         Workers’ incomes across Australia ................................................188
         Workers’ incomes in selected regions...........................................197


     8 Housing                                                                                203–232
         Overview..........................................................................................204
         Trends in housing utilisation .........................................................215
         Housing across Brisbane and Melbourne city rings .....................224


     ADDITIONAL INFORMATION
         Glossary ...........................................................................................233
         Appendix: Photo acknowledgements............................................251


_______________________________________________________________________________________
iv    ABS · A Picture of the Nation · 2070.0 · 2006
Preface


The renowned New South Wales Statistician T.A. Coghlan presented the first Statistician's Report for
the Census of New South Wales in 1891. It included details of all the previous censuses back to the
earliest musters of convicts in Sydney Cove and set a precedent for high quality analysis of the
population census.

George Handley Knibbs published the first Commonwealth Statistician's Report with the results of the
1911 Commonwealth Census. Following the comprehensive nature of previous reports, it was nearly
1000 pages long. The First World War impinged on its release and it took six years from the date of the
census before its release in 1917. It was the first time that a clear picture of the people of our young
nation was available.

The Commonwealth Statistician's Report was released for every subsequent census for 50 years—from
1911 until 1961. While the tradition of releasing a Commonwealth Statistician's Report dwindled with
the introduction of computing and the availability of census data on a mass scale, the need for
analytical publications remained. During the 1980s a number of smaller publications were released in
its place. For the censuses from 1986 to 2001, Australia in Profile along with other thematic
publications offered analysis of the census.

The fifteenth Census of Population and Housing was held on 8 August 2006. It incorporated a number
of changes designed to keep the census as efficient and contemporary as possible. For the first time,
people could complete their census form online. In addition, new questions on need for assistance
(a measure of disability), and voluntary and unpaid work were included. The first data from the
2006 Census were released in June 2007 and incorporated a completely redesigned web based system
that uses a wide range of searching and mapping facilities.

Ultimately, the purpose of each census is to put vital information into the hands of users across
Australia. It helps Australians understand how the nation is changing. The census covers a wide variety
of topics, with detailed data available down to the regional and small area levels and about small
population groups in our society. As a result, the census provides statistical information which can
assist decision making in all sections of society: governments, businesses, academics, researchers,
students, community organisations and individuals.

For previous censuses the Statistician’s Reports played a strong role in fulfilling this purpose. Now I
would like to reintroduce a Statistician's Report for the 21st century. Today, a huge breadth of
information is available from the census, and it would be impossible for one report to summarise it
all. The 2006 Australian Statistician's Report showcases the depth and range of information that the
2006 Census and previous censuses provides about Australia's diverse peoples. It covers topics as
varied as changes to families and living arrangements, commuting to work, skills shortages, and second
generation Australians. This edition has a particular focus on changes across the generations and
differences across Australia.

I would like to thank the Australian people for participating in the census and the tens of thousands
of people who worked on the 2006 Census. Thanks also to the ABS staff who prepared this report,
A Picture of the Nation: The Statistician's Report on the 2006 Census.


Brian Pink
Australian Statistician
January 2009


_______________________________________________________________________________________
                                                ABS · A Picture of the Nation · 2070.0 · 2006           vii
Introduction


A Picture of the Nation: The Statistician's Report on the 2006 Census analyses information collected in
the 2006 Census of Population and Housing. It also incorporates information from previous
censuses—in some instances going back as far as 1911. It presents stories about contemporary society
and trends that affect the lives of Australian people. Drawing on the rich variety of topics covered by
the census and looking across different geographic areas and population groups, this report showcases
the many strengths of census data.

The report consists of eight chapters, each focusing on different areas of social interest and concern:
population, cultural diversity, community, living arrangements, education, work, economic resources
and housing. Each chapter contains an overview and two or three feature articles. The overviews
report on relevant census findings at a broad level. The feature articles focus on specific social issues or
population subgroups. While the overviews and feature articles are self-contained and readable in their
own right, they complement the other articles in their chapters. For example, along with unpaid
childcare and unpaid care for people with disabilities, the ‘Community overview’ examines
volunteering in Australia at the broad level. Complementing this, one of the chapter’s feature articles,
‘Volunteering across Australia’, further explores the geographic dimension of volunteering by focusing
on smaller geographic areas across Australia.

To help readers get the most from the stories presented here, tables, graphs, maps and boxes are used
in conjunction with the easy-to-read analysis. For those wanting to understand more, a Glossary
provides definitions of the complex concepts used throughout the report, and definition boxes explain
terms and concepts that are specific to the overviews or articles where they are used. While the articles
primarily draw on census data, information or data obtained from other sources, such as other
publications or Australian Bureau of Statistics data collections, are referenced in endnotes for each
overview and article.

The fact that high quality national censuses have been held in Australia for almost a century, allows the
characteristics of Australia’s diverse population to be analysed in many different ways. Two approaches
for examining sub-groups of the population have been used in this report: Life cycle and Generational
group analysis. By grouping together people at similar stages of life, Life-cycle groups help to reveal the
common stories and trends experienced by members of these groups. For instance, young adults have
the greatest diversity in living arrangements, reflecting the many transitions they are facing (see the
‘Living arrangements overview’, p. 60–72). Similarly, by splitting the population into five age-based
Generation groups, such as the Lucky and Baby Boomer Generations, and Generation X and Y,
interesting differences emerge. For instance, more than three quarters of the Lucky Generation were
affiliated with a Christian denomination, compared with just over one half of Generation X and Y (see
‘Religion across the generations’, p. 54–58).

Reflecting the important role that the census has in providing information about small geographic
areas, many parts of this report illustrate the different ways that Australia can be divided geographically
from the census. These range from states and territories, cities and regions, down to small
communities and urban centres, as well as broad categories of remoteness that cross state and territory
borders.

More information about the basis of the different population counts used in this report, as well as the
techniques and standard methods used in analysing and presenting data, can be found in the
‘Technical notes’, p. x–xii.


_______________________________________________________________________________________
viii    ABS · A Picture of the Nation · 2070.0 · 2006
About the census
The five yearly Census of Population and Housing is the largest statistical collection undertaken by the
Australian Bureau of Statistics (ABS) and one of the largest regular peace time operations conducted in
Australia.

The 2006 Census was conducted on Tuesday, 8 August. The census included all people in Australia on
Census Night, with the exception of foreign diplomats and their families. Visitors to Australia are
counted regardless of how long they have been in the country or how long they plan to stay. Australian
residents out of the country on Census Night are not counted in the Census. More detail on the
conduct of the 2006 Census is available in How Australia Takes a Census (cat. no. 2903.0).

The legislative basis of the Census of Population and Housing is the Census and Statistics Act 1905.
This Act also requires the ABS and its officers to protect the confidentiality of the information
collected.

Two broad objectives underpin the Census. The first is to measure accurately the number and key
characteristics of Australian residents and the dwellings in which they live. The second is to provide
timely, high quality and relevant data on these topics for small geographic areas and small population
groups.

Census data provide a reliable basis for the estimation of the population of each of the states,
territories and local government areas, primarily for electoral purposes and the distribution of
government funds. The census also provides statistical information that can assist decision making in
all sections of society: governments, businesses, academics, researchers, students, community
organisations and individuals.

Census data complement other sources of information collected by the ABS and other organisations.
For instance, many of the household surveys conducted by the ABS use more detailed questions than
the census can support and therefore are much richer sources of information on their particular
topics. However, these surveys typically cannot provide these data for small population groups or small
areas.

To achieve accurate, high quality data from the census, extensive effort is put into census form design,
collection procedures, and processing. There are four principle sources of error in Census data:
respondent error, processing error, partial and non-response, and undercount. Quality management
aims to reduce these errors as much as possible. The Census page on the ABS website
(www.abs.gov.au/census) provides links to more information on census data quality, including
information about the quality of specific data items from the census.


_______________________________________________________________________________________
                                                 ABS · A Picture of the Nation · 2070.0 · 2006           ix
Technical notes


Different types of population counts
The estimated resident population (ERP) is Australia's official population measure. It is based on
census counts of usual residents (discussed below), which are adjusted for undercount in the census
and the number of Australian residents estimated to have been temporarily overseas at the time of the
census. Further adjustments are made for births, deaths and net migration in the period from the date
of the estimate (30 June) to Census Night (that is, 8 August 2006).

As they are the most accurate count of the population, ERP figures have been used wherever possible
in the Population chapter of this report. However, only a limited number of characteristics of the
population are available through ERP: age, sex, marital status (registered), country of birth and
geographic location. To allow analysis of the broad range of characteristics available from the census,
three different population counts from the census have been used in this report—place of
enumeration, place of usual residence and persons temporarily absent on Census Night.

In Australia the census counts people where they are located on Census Night—their ‘place of
enumeration’. The place of enumeration census count is only used in this report where comparisons
are made with censuses prior to 1976, as this was the only census count available from earlier
censuses.

The usual resident population count is derived from information people provide on their census form
about where they lived, or intend to live, for 6 months or more in 2006—their ‘place of usual
residence’. Information about people who are not at home on Census Night is linked back to the area
in which they usually live (that is, their Collection District). However, it is impractical to link the
information about these people back to their actual families, households or dwellings. In some
instances, the absence of this information could have an impact on the analysis of the characteristics of
families, households and dwellings.

The census count of persons temporarily absent from households is used in a limited number of places
in this report. Answers to questions on the census form, provided by residents present on Census
Night, indicate whether there were people temporarily absent from their household. The number and
characteristics of these temporarily absent people have been used in some instances to provide more
information on the total usual residents of households, as well as providing detail of family structures
and living arrangements, making the analysis undertaken more accurate.

As census usual resident population counts are the most common population count used in this
report, their use in tables, graphs and text is not noted. Where any of the other population counts
discussed above are used, this is noted in footnotes and in the text.

Time series comparisons
In a number of overviews and articles in this report, comparisons have been made between the 2006
Census and earlier censuses. Two significant events affecting the census have occurred that should be
considered when making comparisons of census data over time.

Firstly, under the constitution at Federation, ‘Aboriginal natives’ were not to be counted in the census
and so were excluded from the final results. This restriction was removed following a referendum in
1967. The ABS has endeavoured to conduct as full a count of Indigenous peoples as possible from the
1971 Census onwards, and has included these peoples in census results since then.


_______________________________________________________________________________________
x       ABS · A Picture of the Nation · 2070.0 · 2006
Technical notes


Secondly, the 1976 Census results are based on a sample of half of the forms received from private
dwellings, which have been weighted to represent a full count of the population. This was done
because of budgetary constraints introduced by the government at the time of processing the forms.
Exceptions were in the Northern Territory, where all of the forms from private dwellings were
processed, as well as all forms from non-private dwellings across Australia.

In most cases, the classifications used to make comparisons over time are the same in each census year
and the comparisons have been made with a high degree of certainty. In other cases, the classifications
and/or processing methods have changed over time and the comparisons are less certain.
Comparisons have only been made where the data have been assessed as fit for the purpose for which
they are used: in some instances, changes over time have not been discussed because of the degree of
uncertainty and change involved.

Of particular note, the 2006 Census introduced new classifications for occupation and industry of
employment: the Australian and New Zealand Standard Classification of Occupations (ANZSCO) and
Australian and New Zealand Standard Industrial Classification 2006 (ANZSIC). For the 2006 Census,
occupation and industry of employment data were dual coded to give users the option to use either
the current classification or the previous classification (ASCO Second Edition or ANZSIC 1993,
respectively). In this report, comparisons over time for these topics use the earlier classifications for
the 2006 Census data.


Totals—rounding and data perturbation
Figures have been rounded in this report. Therefore, discrepancies may occur between the sums of
the component items and totals.

A range of methods has been used to protect the confidentiality of respondents when data are released
from the census. This produces minor variations in the data that may result in totals not being equal in
all tables and quoted numbers.


Treatment of particular data items
To be as consistent as possible with ERP figures (see previous page) and to minimise the effect of
variations in the numbers of overseas visitors on time series data, all overseas visitors have been
excluded from data used in the report, unless otherwise specified.

Where classifications used included a ‘not stated’ category, data in this category have been excluded
prior to the calculation of percentages—in effect, this has ‘distributed’ those results across the
remaining categories. The only exception to this is for the Religious Affiliation classification, where ‘not
stated’ is an accepted response. Total numbers for all classifications, including those shown alongside
percentages, include the number of ‘not stated’ responses. Where the number of responses in a ‘not
stated’ category may have had an impact on the information presented, this is noted in footnotes and
in the text. In some instances, data have not been analysed because of large numbers of ‘not stated’
responses.

Where classifications used included an ‘inadequately described’ or similar category, data in these
categories were generally treated as a standard category—that is, they have not been distributed as for
the ‘not stated’ categories described above. In the instances where it was necessary to do this, this is
indicated in footnotes and in the text.


_______________________________________________________________________________________
                                                  ABS · A Picture of the Nation · 2070.0 · 2006             xi
Technical notes


Symbols and usages
The following symbols and usages mean:

               %         per cent
               ..        not applicable
               n.a.      not available
               no.       number
               $         dollar
               ‘000      thousand
               km2       square kilometre


Abbreviations
This report uses the following abbreviations.

Australia, states and territories of Australia
               Aust.     Australia
               NSW       New South Wales
               Vic.      Victoria
               Qld       Queensland
               SA        South Australia
               WA        Western Australia
               Tas.      Tasmania
               NT        Northern Territory
               ACT       Australian Capital Territory


Other abbreviations
               ABS     Australian Bureau of Statistics
               ABSCQ Australian Bureau of Statistics Classification of Qualifications
               AIFS    Australian Institute of Family Studies
               AIHW    Australian Institute of Health and Welfare
               ASCO    Australian Standard Classification of Occupations
               ANZSCO Australian and New Zealand Standard Classification of Occupations
               ANZSIC Australian and New Zealand Standard Industrial Classification
               ASCED Australian Standard Classification of Education
               AST     Australian Social Trends
               DEWR    Department of Education, Employment and Workplace Relations
               DIAC    Department of Immigration and Citizenship
               ERP     Estimated Resident Population
               GPO     General Post Office
               GSS     General Social Survey
               HECS    Higher Education Contribution Scheme
               LFS     Labour Force Survey
               LGA     Local Government Areas
               MCEETYA Ministerial Council on Education Employment Training and Youth Affairs
               MPHS    Multi-Purpose Household Survey
               SARS    Special Administrative Regions
               SD      Statistical District
               SDAC    Survey of Disability, Ageing and Carers
               SIH     Survey of Income and Housing
               SLA     Statistical Local Area
               SOLD    Survey of Labour Demand
               SSD     Statistical Subdivision
               TAFE    Technical and Further Education
               UK      United Kingdom


_______________________________________________________________________________________
xii     ABS · A Picture of the Nation · 2070.0 · 2006
Overview                        2
From generation to generation   9
Where do Australians live?      16
On the move                     24
Population overview


In August 2006, the Census of Population and            Population(a)(b)(c) 1906 to 2006
Housing counted 19.9 million people in
Australia on Census Night. This figure provided                                                              million
a base count from which the estimated                                                                            24
resident population (ERP) was derived (see                                                                      20
box below). After adjusting for undercount and                                                                  16
a number of other factors, Australia's ERP at
30 June 2006 was 20.7 million people.                                                                           12
                                                                                                                8

Population growth                                                                                               4
                                                                                                                0
Between 2001 and 2006, Australia's resident             1906      1926       1946      1966      1986      2006
population increased by nearly 1.3 million
people. Natural increase (excess of births over
                                                        (a) Includes estimates of the Indigenous population from
deaths) and net overseas migration each                 1961 onwards.
contributed about half of this growth (see              (b) Prior to 1971, estimates of the population were
Glossary for more information about these               based on the number of people actually present in
terms).                                                 Australia. From 1971 onwards the concept of estimated
                                                        resident population (ERP) was introduced.
Over the past 100 years Australia's population          (c) Includes Other Territories from 1994.
has increased steadily from 4.1 million in 1906         Source: Australian Historical Population Statistics, cat.
to 20.7 million in 2006. The only exception to          no. 3105.0.65.001.
this steady growth occurred in 1916 and 1917
during World War I, when the population
declined slightly. This was because defence
force personnel leaving Australia were                    Estimating Australia's
regarded as emigrants and excluded from                   population
population counts.1
                                                          The estimated resident population (ERP) is
Some of the highest annual population growth              Australia's official population figure. It is
rates were recorded in the period 1947–65,                based on census counts of usual residents,
known as the Baby Boom. Annual growth rates               adjusted for undercount and the number
over this period fluctuated between 1.6% and              of Australian residents estimated to have
3.3% with natural increase the main                       been temporarily overseas at the time of
component. High levels of immigration                     the census. Further adjustments are made
following World War II also contributed to                for births, deaths and net migration in the
strong population growth in this period.                  period from 1 July to Census Night (i.e.
Annual population growth rates then declined              8 August 2006) to estimate the population
to a low of 1.0% in 1975 and have remained at             at 30 June 2006. This chapter presents June
between 1% and 2% since then. Between 2001                2006 ERP where available, and unadjusted
and 2006, the annual growth rate fluctuated               census counts from August 2006 where
around 1.3%.                                              more detailed information on population
                                                          characteristics is needed. Later chapters
                                                          only use unadjusted census counts.
                                                          For more information on ERP see
                                                          Australian Demographic Statistics, Dec
                                                          2007, ABS cat. no. 3101.0.


_______________________________________________________________________________________
2       ABS · A Picture of the Nation · 2070.0 · 2006
Population…overview


  How the population grows
  The growth of Australia's population has two components: natural increase and net overseas
  migration. Natural increase refers to the excess of births over deaths. Net overseas migration is the
  net gain or loss of population through immigration to Australia and emigration from Australia.

  Population growth in the states and territories has a third component: net interstate migration. It
  refers to the difference between the number of persons who have changed their place of usual
  residence by moving into a given state or territory and the number who have changed their place
  of usual residence by moving out of that state or territory during a specified time period. Note that
  Urban Centres (see Glossary) with smaller populations may record high growth rates because the
  rates are calculated from a small base.


States and territories                                             (1.9%), the Northern Territory (2.2%) and the
                                                                   Australian Capital Territory (1.5%), although
In 2006, New South Wales continued to be the                       the causes of growth differed. While natural
most populous state (6.8 million residents)                        increase was an important component of
followed by Victoria (5.1 million). Together                       growth in each of these states and territories,
they were home to over half (58%) of                               Queensland was the only state to draw
Australia's total population. Average annual                       substantial numbers from interstate migration.
population growth in both states in the                            In Western Australia, high levels of net
25 years to 2006 was 1.1%, below the national                      overseas migration boosted population
rate of 1.3%.                                                      growth, allowing it to overtake South Australia
                                                                   in size in the early 1980s.
In the 5 years before the 2006 Census, the
average annual growth was lower for New                            Both South Australia and Tasmania
South Wales (0.7%) but higher for Victoria                         experienced low rates of growth in the 25 years
(1.3%) than in preceding years. Net overseas                       to 2006. Losses due to interstate migration,
migration and natural increase were the main                       primarily of young people, have resulted in
components of growth rather than interstate                        older populations with lower proportions of
migration.                                                         people of child-bearing age and subsequent
                                                                   low levels of natural increase.
Between 1981 and 2006, average annual
population growth was above the national rate
in Queensland (2.3%), Western Australia

Population growth and distribution(a)

                                                               Change     Change
                                                                1981–      2001–
                                        2006        2006      2006(b)    2006(b)
                                            '000       %            %          %
 New South Wales                      6 816.1        32.9          1.1        0.7

 Victoria                             5 126.5        24.8          1.1        1.3

 Queensland                           4 090.9        19.8          2.3        2.4

 South Australia                      1 567.9         7.6          0.7        0.7


 Western Australia                    2 059.4         9.9          1.9        1.6

 Tasmania                               490.0         2.4          0.5        0.8

 Northern Territory                     210.6         1.0          2.2        1.3

 Australian Capital Territory           334.1         1.6          1.5        0.9

 Australia                          20 697.9        100.0         1.3         1.3

 (a) Estimated Resident Population as at 30 June.
 (b) Average annual growth, see Glossary.
 Source: Australian Demographic Statistics, Dec 2007, cat. no. 3101.0.


_______________________________________________________________________________________
                                                            ABS · A Picture of the Nation · 2070.0 · 2006        3
Population…overview


20 largest Urban Centres(a)

                                             Change                                                    Change
                                              1996–                                                     1996–
                                2006        2006(b)                                        2006       2006(b)
                                 '000               %                                        '000            %
 Sydney                       3 794.8           1.1         Sunshine Coast(c)               197.6          4.3

 Melbourne                    3 517.6           1.6         Geelong                         143.1          0.9

 Brisbane                     1 733.5           2.8         Townsville                      137.5          2.2

 Perth                        1 322.7           1.5         Hobart                          132.1          0.2

 Adelaide                     1 078.9           0.7         Cairns                          105.4          2.6


 Gold Coast-Tweed
 Heads                          487.5           5.4         Toowoomba                       101.6          1.6

 Canberra-Queanbeyan            368.8           1.0         Ballarat                         81.2          1.9

 Newcastle                      303.2           0.8         Bendigo                          79.0          2.4

 Central Coast (NSW)            289.2           2.0         Launceston                       74.1          0.7

 Wollongong                     247.4           0.8         Darwin                           71.9          0.7

 Australia                   20 697.9           1.2

 (a) Estimated Resident Population as at 30 June.
 (b) Annual average growth, see Glossary.
 (c) Sunshine Coast only existed in its own right as a UCL area from the 2001 Census. For the 1996 Census, the
 Urban Centres in 2001 from the equivalent area have been used to represent the population at that time.
 Source: Regional Population Growth, Australia, 2005–06, cat. no. 3218.0.


Urban Centres                                                     include Melbourne (1.6%), Perth (1.5%), the
                                                                  Central Coast of NSW (2.0%), Ballarat (1.9%)
Most of Australia's population live in urban                      and Bendigo (2.4%). Of the 20 largest Urban
areas. In 2006, just over two thirds (69%) of the                 Centres, Hobart experienced the lowest
population lived in the 20 largest Urban                          average annual growth rate (0.2%).
Centres and half the population lived in the
4 largest Urban Centres (Sydney, Melbourne,
Brisbane and Perth). In the 10 years to 2006,
                                                                  Mobility
population growth in Sydney (average annual                       In the five years prior to the 2006 Census,
growth of 1.1%), did not keep pace with the                       6.6 million people, or 43% of the population
national average (1.2%). However, due to its                      aged 5 years and over, changed their place of
large size, this city accommodated an                             residence in Australia. Of all the people who
additional 400,000 people, or around one sixth                    moved within Australia during this period, the
of Australia's population growth in this period.                  majority (86%) moved within the same state or
                                                                  territory while the remainder moved interstate.
High rates of growth in Queensland's largest                      People aged 25–29 years were the most mobile
Urban Centres contributed to a high rate of                       age group, with 62% having moved within
growth in the state as a whole. Between 1996                      Australia in the previous 5 years, while those
and 2006, population growth in Brisbane, Gold                     aged 75–79 years were least likely to have
Coast-Tweed Heads, Townsville and Cairns was                      moved (19%). There was little difference
well above the national rate, with Gold Coast-                    recorded between the mobility rates of men
Tweed Heads experiencing the highest average                      and women.
annual growth rate of 5.4%. Over this period
the Sunshine Coast evolved from a number of                       The mobility rate of immigrants is very high
smaller settlements to become the country's                       after arrival and for the first decade of their
eleventh largest Urban Centre with a                              residence in Australia, reflecting that
population of 198,000 in 2006. Other large                        immigrants tend to move until they find a
Urban Centres with high rates of growth                           suitable place to work and settle into their new


_______________________________________________________________________________________
4         ABS · A Picture of the Nation · 2070.0 · 2006
Population…overview


Mobility rates by birthplace, 2001–06(a)                                   environment. Between 2001 and 2006, 60% of
                                                                           newly arrived migrants (who arrived in
 %
        Same SLA
                                                                           Australia in the 5 years to 2000) had moved
75      Other SLA, same SD                                                 residence compared to 42% of the Australian-
        Other SD, same state                                               born population, and their mobility rates were
        Interstate
50      Total                                                              higher in almost every age group. However,
                                                                           over the longer term, the mobility rates of
                                                                           immigrants are lower on average than the
25                                                                         Australian-born population.

  0
        Australian born   Recent arrivals(b)         Total                 Population distribution
                                                overseas born(c)
                                                                           Australia's population is mostly concentrated
                                                                           in two widely separated coastal regions. The
(a) Excludes children under 5 years of age in 2006 and                     larger of these by far (both in area and
people who were overseas in 2001.
                                                                           population) lies in the east and south-east of
(b) Who arrived in Australia between 1996 and 2000.
                                                                           Australia, stretching in a crescent from
(c) Who arrived in Australia prior to 2001.                                Queensland through New South Wales,
                                                                           Victoria and Tasmania to South Australia. The
                                                                           smaller region is in the south-west of the
                                                                           continent and is concentrated around the
                                                                           Perth metropolitan area.


Population density, Statistical Local Areas(a)


                                                Darwin


                                                                                                                Brisbane


        Perth
                                                                                                      Sydney

                                      People per sq km               Adelaide
                                                                                                     Canberra
                                          100.0 or more
                                           10.0 – 100.0                         Melbourne
                                            1.0 – 10.0
                                            0.1 – 1.0
                                          Less than 0.1
                                                                                            Hobart
                                  0                          1000

                                               Kilometres


(a) Estimated Resident Population as at 30 June 2006.
Source: Regional Population Growth, Australia, 2005–06, cat. no. 3218.0


_______________________________________________________________________________________
                                                                   ABS · A Picture of the Nation · 2070.0 · 2006            5
Population…overview


In 2006, the vast majority of Australia's                           The age structure of Australia's population has
population (85%) lived within 50 kilometres of                      changed considerably over the last century.
the coastline, reflecting the arid, inhospitable                    During this time the proportion of children
conditions of much of the Australian interior,                      aged under 15 years declined from 35% in 1901
as well as employment and lifestyle                                 to 20% in 2006, while the proportion of older
opportunities found in coastal areas and                            people aged 65 years and over increased from
historical settlement patterns. The population                      4% to 13%. These changes reflect: increased
was also highly urbanised. In Australia, an                         life expectancy of infants in the earlier part of
Urban Centre is defined as a population cluster                     the century, resulting in the survival of more
of 1,000 or more people. At 30 June 2006,                           people into old age; declining fertility from the
18.3 million people, or 88% of the total                            1970s; and improvements in life expectancy at
Australian population were living in 730 Urban                      older ages in recent decades.
Centres.
                                                                    The sex ratio is the number of males per one
Age and sex structure                                               hundred females. A sex ratio less than
                                                                    100 indicates that there are fewer males than
In June 2006 the median age of the Australian                       females. In 2006, Australia had an overall sex
population was 37 years. One in five                                ratio of 99 males for every 100 females in the
Australians (20%) were children aged under                          population. The sex ratio for children aged
15 years, and 13% were aged 65 years and over.                      0–4 was 105, as male births consistently
For most of the states and territories, the                         outnumber female births, and declined with
proportion of the population in each of these                       age reflecting lower female death rates at all
age groups varied only slightly. The Northern                       ages and the resultant higher life expectancy
Territory had the highest proportion of                             of women. Among those aged 75 years and
children aged under 15 years (25%) while                            over there were 523,200 males and 757,200
South Australia and Tasmania had the highest                        females, equating to a sex ratio of 69 males per
proportions of older people aged 65 years and                       100 females.
over (both 15%).


Age distribution(a)

                                                           People       People         People
                                              Total         aged         aged         aged 65       Median
                                         population         0–14        15–64         and over         age
                                               '000             %             %              %       years
 New South Wales                            6 816.1          19.6          66.9           13.5        36.8

 Victoria                                   5 126.5          19.0          67.6           13.4        36.7

 Queensland                                 4 090.9          20.4          67.5           12.1        36.0

 South Australia                            1 567.9          18.3          66.6           15.1        38.8


 Western Australia                          2 059.4          19.9          68.3           11.8        36.2

 Tasmania                                     490.0          19.7          65.7           14.6        38.8

 Northern Territory                           210.6          24.5          70.9             4.6       30.9

 Australian Capital Territory                 334.1          18.8          71.7             9.5       34.4

 Australia                                20 697.9           19.6          67.4           13.0        36.6

 (a) Estimated resident population as at 30 June, 2006.
 Source: Population by Age and Sex, Australian States and Territories, Jun 2006, cat. no. 3201.0.


_______________________________________________________________________________________
6           ABS · A Picture of the Nation · 2070.0 · 2006
Population…overview


Population profile, selected years(a)(b)

                                                 Age

                                                  85+
                                                80–84
                                                                       1901      1956    2006
                                                75–79
                                                70–74
                                                65–69
                                                60–64
                                                55–59
                                                50–54
                                                45–49
                                                40–44
                                                35–39
                                                30–34
                                                25–29
                                                20–24
                                                1 9
                                                 5–1
                                                1 4
                                                 0–1
                                                 5–9
                                                 0–4

 800       600       400       200        0             0      200       400      600          800
                                                '000
                   Males                                               Females

(a) Data for 1901 are census counts; data for 1956 are population estimates; data for 2006 are estimated resident
population.
(b) In 2006, Christmas Island and Cocos (Keeling) Islands are included as part of Australia.
Source: Australian Historical Population Statistics, cat. no. 3105.0.65.001.


Indigenous population                                                the state or territory with the highest
                                                                     proportion of Indigenous peoples in its total
At 30 June 2006, the Aboriginal and Torres                           population (32%).
Strait Islander population was estimated at
517,200, or 2.5% of the total Australian                             Indigenous Australians were more likely to live
population. Two states, New South Wales                              in remote areas of the country than non-
(29%) and Queensland (28%), contained over                           Indigenous Australians. Based on census
half the Indigenous population. While a                              counts, around one in four Indigenous
smaller proportion of all Indigenous peoples                         Australians (24%) lived in Remote or Very
lived in the Northern Territory (13%), it was                        Remote areas in 2006 compared with only one
                                                                     in fifty non-Indigenous Australians (2%).
                                                                     Conversely, 32% of the Indigenous population
                                                                     lived in the Major Cities (see Glossary)
Population by Remoteness Areas(a)                                    compared to 69% of the non-Indigenous
                                                                     population.
 %
                                          Indigenous
                                                                     Birthplace
80                                        Non-Indigenous

60
                                                                     In 2006, a quarter (25%) of Australia's
40
                                                                     population was born overseas. This represents
                                                                     a slight increase in the proportion born
20                                                                   overseas since 1996 (23%). People born in
                                                                     North-West Europe (including the United
  0                                                                  Kingdom) were the largest group of overseas-
        Major     Inner      Outer     Remote      Very              born residents in 2006, accounting for 7% of all
        Cities   Regional   Regional              Remote
                                                                     residents nationally, and almost a third of all
                                                                     overseas-born residents. Those born in
(a) 2006 Census counts.                                              Southern and Eastern Europe were the second

_______________________________________________________________________________________
                                                            ABS · A Picture of the Nation · 2070.0 · 2006            7
Population…overview


largest group of overseas-born, comprising 4%
of all residents nationally, followed by South-
East Asia, accounting for 3% of the total
population.

Based on census counts, the overseas-born
population was more likely to live in Urban
Centres than those born in Australia. In 2006,
85% of the overseas-born were living in Major
Cities, compared with 63% of Australian-born
residents. Those migrants who arrived in the
past two decades were more likely than other
overseas-born people to live in large
population centres, reflecting the settlement
patterns of migrants to Australia. In 2006, 9 out
of 10 migrants who had arrived in the
preceding 20 years lived in Major Cities (90%)
falling to around 8 in 10 of those who arrived
in 1986 or before (81%). For more information
on the overseas-born population, see the
‘Cultural diversity overview’, p. 34–44.


Regions of birth of Australia’s
population(a)

                                        %            '000
    Australian-born                  75.4     15 608.1


    Total overseas-born              24.6      5 093.4

      Oceania and Antarctica(b)       2.7        567.7

      North-West Europe               7.3      1 513.2

      Southern and Eastern
      Europe                          4.1        852.9

      North Africa and the Middle
      East                            1.4        295.4


      South-East Asia                 3.1        641.9

      North-East Asia                 2.3        470.1

      Southern and Central Asia       1.6        322.0

      Americas                        1.0        210.0

      Sub-Saharan Africa              1.1        220.2


    Total                           100.0     20 701.5

    (a) 2006 Census counts.
    (b) Excluding Australia.


Endnotes
1 Australian Bureau of Statistics 2003, Population
growth and distribution, 2001, cat. no. 2035.0,
p. 20–22, ABS, Canberra.


_______________________________________________________________________________________
8           ABS · A Picture of the Nation · 2070.0 · 2006
From generation
     to generation


Taking a generational view of the population             great deal of individual variety occurs.
provides a useful framework for analysing                Therefore, where useful, generations have
census data. Dividing the population into                been further divided into smaller age groups to
generations and looking at the different social          highlight this diversity.
and economic experiences they have had can
help us to understand the changes that have
occurred and continue to occur in Australian             Oldest Generation the
society.                                                 most likely to live alone
In this report 5 cohorts are identified: the             Born before 1927, the surviving members of
Oldest Generation; the Lucky Generation; the             this generation were aged 80 years and over in
Baby Boomers; Generation X and Y; and the                2006 and comprised 4% of the total
internet or iGeneration (see table below). This          population. As young adults, the older
article defines each generation, and briefly             members of this birth cohort may have
describes their social and economic history              experienced interrupted employment and
and current characteristics. These groups are            family formation during the Great Depression.
used in several articles throughout this report          Many of the men would have served in the
which provide more in-depth analysis of                  armed forces during World War II. Members of
various aspects of the life experience of these          the Oldest Generation had limited formal
generations. While each generation shares                educational opportunities: in 2006, 39%
certain characteristics, it should be                    reported they left school at Year 8 or below or
acknowledged that within each generation a               never attended school compared to 2% of
                                                         Generation X and Y.


  Defining the generations
  In defining the generations, a number of factors have been taken into account including birth
  rates, significant world events and shared life experiences. Each generation covers a similar sized
  age group (generally 20 years) to allow more meaningful comparisons across generations. For
  example, Generation X and Y, while separately identified by some social commentators, have many
  characteristics in common and have been combined to form a 20 year birth cohort. It should be
  noted that there is no widespread agreement about the names and definitions of these
  generations. Furthermore, the names adopted in this report have been used by other
  commentators to refer to slightly different groups.

  Summary of the generations

                                                                      Size of group     Proportion of the
                                   Birth cohort       Age in 2006          in 2006    population in 2006
                                                            years             '000                     %
 Oldest Generation                  1891–1926          80 and over           727.3                   3.7

 Lucky Generation                   1926–1946               60–79          2 875.1                  14.5

 Baby Boomers                       1946–1966               40–59          5 468.8                  27.5

 Generation X and Y                 1966–1986               20–39          5 489.9                  27.6

 iGeneration                        1986–2006                0–19          5 294.1                  26.7


_______________________________________________________________________________________
                                                  ABS · A Picture of the Nation · 2070.0 · 2006             9
Population…From generation to generation


Living arrangements and relationship in household

                                                  Oldest          Lucky            Baby           Generation
                                              Generation      Generation        Boomers              X and Y      iGeneration
                                             80 and over           60–79              40–59          20–39                 0–19
                                                         %               %                 %              %                    %
 In private dwellings
     Husband, wife or partner                         30.3             61.0            68.0             48.9                0.5

     Lone parent                                        5.3             3.4               7.4            5.0                0.1

     Lone person                                      32.9             19.2               9.9            7.1                0.3

     Group household member                             1.1             1.8               2.0            7.3                0.7

     Child                                              0.0             0.4               2.1           16.0               89.6

     Other(a)                                           8.2             7.5               4.4            8.0                3.5

 Total in private dwellings(b)                        80.4             96.6            97.6             97.1               98.5


 In non-private dwellings(c)                          19.6              3.4               2.4            2.9                1.5

 Total(d)                                           100.0             100.0           100.0           100.0             100.0

 (a) Includes other related individuals, non-family members and visitors from within Australia.
 (b) Includes persons in non-classifiable households.
 (c) Includes persons living in hospitals, nursing homes, cared accommodation for the retired and aged, other welfare
 institutions and other non-private dwellings such as hotels and motels.
 (d) Excludes people counted in migratory, off-shore and shipping Collection Districts.


In 2006, 33% of the Oldest Generation were                             because they generally perceive that they had
living alone, the highest proportion of all                            an easier time than their parents. They didn't
generations. A further 30% were living with                            live through World War I or have to make ends
their husband, wife or partner while 17% were                          meet during the Depression, and as young
living in nursing homes or cared                                       adults they experienced full employment and
accommodation for the retired or aged. Of                              prosperity during the post-World War II
those living alone, more than 4 in 5 were                              economic boom. This generation has also been
widowed. This generation reported the highest                          referred to as the Austerity Generation;
rate of religious affiliation (82%) of all the                         affected by the privations resulting from the
generations, with Anglican (30%) and Catholic                          Great Depression in their formative years, they
(23%) the most commonly reported faiths.                               are often regarded as a hardworking and stoic
                                                                       generation who seek stability and security. The
Lucky Generation retire                                                Lucky Generation has been a relatively small
                                                                       group compared to successive generations,
gradually                                                              partly due to low birth rates during the
                                                                       Depression and World War II and recent
Born between 1926 and 1946, just prior to and                          deaths.
during the Great Depression and World War II,
they are referred to as the Lucky Generation

Time line4
                                                                                                                Cold War
                                    World War I                                   World War II                   Korean War
                                    (1914–18)                                      (1939–45)                      (1950–53)

                                           Strong economy        Depression                                   Strong economy
 Federation (1901)
                                                                                                    Snowy
                                                              Sydney                                               White Australia
 women get the                             Spanish flu                           polio epidemic     Mountains
                                                              Harbour Bridge                                       Policy repealed
 vote (1902)                               epidemic (1919)                       (1938)             scheme
                                                              opened (1932)                                        (1958)
                                                                                                    (1949)

  1900                  1910                1920               1930               1940                 1950

                     Oldest Generation                             Lucky Generation                       Baby Boomers


_______________________________________________________________________________________
10           ABS · A Picture of the Nation · 2070.0 · 2006
Population…From generation to generation


Labour Force Status by generation

                                                   Oldest           Lucky             Baby         Generation
                                               Generation       Generation         Boomers            X and Y     iGeneration(a)
                                            80 and over              60–79            40–59           20–39               15–19
                                                          %                 %               %              %                      %
 Males
   Employed full-time                                    1.7             18.2            68.0            66.5               17.7

   Employed part-time                                    1.5               9.1           10.0            12.4               22.7

   Unemployed                                            0.1               1.2            3.2             5.0                    7.0

   Not in the labour force                              95.9             69.2            14.0            10.8               48.7


   Total males(b)                                      100.0           100.0           100.0           100.0               100.0


 Females
   Employed full-time                                    0.4               5.9           35.3            37.9                    9.9

   Employed part-time                                    0.5               8.7           30.5            27.1               33.7

   Unemployed                                            0.1               0.4            2.8             4.2                    6.8

   Not in the labour force                              98.6             83.5            27.3            26.0               45.5


   Total females(b)                                    100.0           100.0           100.0           100.0               100.0

 (a) Excludes those aged under 15 years.
 (b) Includes those employed but away from work during the reference period.


This cohort also experienced higher rates of                             part-time. See ‘Generations of employment’,
infectious diseases (such as polio, diphtheria                           p. 159–166, for a detailed analysis of the labour
and rubella), cancer and heart disease during                            force experiences of each generation over time.
their lifetime than subsequent generations.1 In
2006 the Lucky Generation were aged 60–79                                In 2006, the Lucky Generation had the highest
years and accounted for 14% of the total                                 proportion of members born overseas (36%
Australian population. By 2006 the majority had                          compared to 31%–32% for both the Oldest
retired from employment. Nearly twice as many                            Generation and the Baby Boomers and 24% for
men (30%) as women (16%) were employed,                                  Generation X and Y). Contributing to the high
reflecting the traditional breadwinner and                               proportion of overseas-born in this generation
homemaker roles adopted by the majority of                               was the post World War II influx of European
the Lucky Generation. Two thirds of those men                            migrants in the 1950s and 1960s: 12% of this
employed were working full-time, while the                               generation were born in the UK or Ireland and
majority of the employed women were working                              a further 11% in Southern and Eastern Europe
                                                                         (including 4% who were Italian-born).


Time line4
                                    Cold War
                                 Vietnam War                                             Gulf War
                                                                                                                         Iraq War
                                  (1962–73)                                             (1990–91)

                                                                                        Economic
         Strong economy                                                                                         Strong economy
                                                                                        downturn
                                     Aborigines included       no fault divorce
 post-war migration
                                     in the Census (1971)      (1975)

      television (1956)                 credit cards           computers             internet            mobile phones

                          1960             1970                   1980                  1990               2000                   2005

          Baby Boomers                         Generation X and Y                 iGeneration


_______________________________________________________________________________________
                                                               ABS ·       A Picture of the Nation · 2070.0 · 2006                     11
Population…From generation to generation


                                                         Registered marital status at 40–59 years
Baby Boomers share
breadwinning role                                         %
                                                         100
                                                                                        Oldest Generation (1966)
                                                                                        Lucky Generation (1986)
In 2006 the Baby Boomers were aged 40–59                                                Baby Boomers (2006)
                                                          80
years. Born between 1946 and 1966 during the
post-war economic boom, the Baby Boomers                  60
were the second largest generation in 2006,
                                                          40
numbering 5.5 million or 28% of the total
population. The size of this cohort can be                20
attributed to the high rates of marriage and               0
fertility, resulting from the catch up of                       Never     Married   Divorced Separated Widowed
marriage and child-bearing delayed by World                     married
War II, and the buoyant economy during their
parents' child-bearing years. The influx of
migrants to Australia following World War II
also contributed to the size of this generation          the norm. Just over two thirds of female Baby
both directly (through the migration of                  Boomers were employed in 2006, while 20%
children with their families) and indirectly             stated they had a Bachelor degree or higher
(through the migration of young adults who               qualification.
would later have Baby Boomer children). Of all
the generations, the Baby Boomers had the                This generation experienced increasing rates of
largest overseas-born population (1.6 million            marital separation resulting from the
people) in 2006. However, the overseas-born              introduction of 'no fault' divorce in 1975.2 In
comprise a smaller proportion (32%) of this              2006, 19% of Baby Boomers were separated or
generation than in the Lucky Generation (36%)            divorced, nearly double the rate recorded for
because they joined a large cohort of                    the previous generation: when the Lucky
Australian-born Boomers.                                 Generation were the same age (40–59 years) in
                                                         1986, 11% were separated or divorced.
The older Baby Boomers entered the labour
force when economic conditions were buoyant
and experienced high rates of employment.                Generation X and Y the
The younger members of this generation have              most highly qualified
not had the same employment opportunities
throughout their working lives as older Baby             Born between 1966 and 1986, this generation
Boomers, with many affected by the economic              were aged 20–39 years in 2006. The older
downturn in the late 1980s and early 1990s.              members of this birth cohort have been
                                                         dubbed Generation X for the perceived
The Baby Boomer Generation has lived                     namelessness felt by the generation
through enormous social change, experiencing             overshadowed by the Baby Boomers who
rising rates of female participation in both             preceded them. Generation Y simply refers to
tertiary education and the labour force, and             the generation following X. With a combined
the creation of the two income household as              size similar to the Baby Boomers, Generation X
                                                         and Y comprised 28% (5.5 million) of the total
                                                         population in 2006.

Higher education qualifications by                       Generation X and Y were the first generation
generation(a)                                            to experience increased rates of parental
                                                         separation and divorce. They are also regarded
 %                                                       as having fewer opportunities than their Baby
                                              Men
30                                            Women      Boomer predecessors, being the first to
                                                         experience user-pays higher education and job
20
                                                         insecurity.3 When Generation X and Y were
                                                         entering the workforce, unemployment levels
                                                         were high. For example in 1991, 15% of
10                                                       Generation X and Y men who were of working
                                                         age (15–24 years) were unemployed. In
  0
                                                         contrast, Baby Boomers started entering the
       Gen X & Y      Baby       Lucky        Oldest     workforce in the late 1960s when
                    Boomers    Generation   Generation   unemployment levels were very low. By 1971,
                                                         only 2% of working age Baby Boomer men
(a) Includes Bachelor degree, Graduate diploma,          (then aged 15–24 years) were unemployed.
Graduate certificate, Master degree and Doctoral
degree.


_______________________________________________________________________________________
12       ABS · A Picture of the Nation · 2070.0 · 2006
Population…From generation to generation


Unemployment experiences of the                                 (49%) were living with a spouse or partner. A
generations(a)                                                  further 7% were living in group households
                                                                while 7% were living alone.
Men

      Gen X & Y
                                                  %             iGeneration live up to
                                                  15
      Baby Boomers
      Lucky Generation                                          their name
                                                  10            Born between 1986 and 2006, the iGeneration
                                                                (Internet Generation) spent their formative
                                                                years in a period which saw the birth and rise
                                                  5             of the internet. Aged 0–19 years in 2006, they
                                                                take computers and the internet and a host of
                                                  0             electronic consumables, such as DVDs, mobile
1966 1971 1976 1981 1986 1991 1996 2001 2006
                                                                phones and MP3 players for granted. Uptake of
                                                                technology by the iGeneration is reflected in
                                                                their rates of internet access. In 2006, 80% of
                                                                the youngest generation had access to the
Women                                                           internet at home with just over two thirds of
                                                                this group having access to a broadband
                                                  %             connection. Access was also high among Baby
      Gen X & Y
      Baby Boomers
                                                  15
                                                                Boomers (76%) and Generation X and Y (75%),
      Lucky Generation
                                                                many of whom have their iGeneration children
                                                  10            living with them at home.

                                                                Despite the gradual increase in one parent
                                                  5
                                                                families, the majority of iGens in private
                                                                households were living with their couple
                                                  0             parents in 2006 (77%). Twenty years earlier in
1966 1971 1976 1981 1986 1991 1996 2001 2006                    1986, 85% of 0–19 year olds (Generation X and
                                                                Y) were living with couple parents. For iGens
                                                                living in couple families, around 9 out of 10
(a) Proportion of all men or women in each generation
aged 15 years and over at the time of each census who
                                                                were the natural or adopted child of both
were unemployed.                                                parents.

                                                                The iGeneration, along with Generation X and
The unemployment pattern was similar for                        Y, are the most secular generations, with
women. Lower levels of unemployment                             almost one in four reporting no religion in
experienced by Lucky Generation women                           2006. Of the other generations, those
partly reflect lower levels of labour force                     reporting no religion ranged from 6% of the
participation by women of that generation with                  Oldest Generation to 17% of Baby Boomers.
fewer women seeking employment than in                          See ‘Religion across the generations’, p. 54–58,
later generations.                                              for more information.

Despite the introduction of the Higher
Education Contribution Scheme (HECS),
Generation X and Y are the most highly                          Internet access by generation(a)
educated generation on record, with one in
four having a Bachelor degree or above in                        %
                                                                        Broadband
2006. In each successive generation, the                        80      Other
proportion of women who obtained higher                                 Total
                                                                60
education qualifications has increased relative
to that of their male counterparts. In 2006, 28%                40
of Generation X and Y women had a Bachelor
degree or above compared with 21% of                            20
Generation X and Y men.
                                                                  0
Spanning people in their early 20s to late 30s,                         Oldest     Lucky     Baby        Gen    iGeneration
                                                                      Generation Generation Boomers      X&Y
Generation X and Y were represented more
broadly across the different living
arrangements than other generations in 2006.                    (a) Usual residents living in private dwellings only.
While 16% were living with parents, almost half


_______________________________________________________________________________________
                                                        ABS ·   A Picture of the Nation · 2070.0 · 2006                 13
Population…From generation to generation


iGeneration aged 15–19: employment and education participation

                                                 Studying(a)
                                                                                       Not
                                    Full-time      Part-time          Total        studying        Total(b)
                                            %              %              %                %              %


 Employed
     Full-time                             0.5            3.1           3.7              9.9           13.9

     Part-time                           21.2             1.2          22.5              5.4           28.1

 Total employed(c)                       24.1             4.6          28.9             16.6           46.0


 Not employed                            44.9             1.2          46.4              7.1           54.0

 Total(d)                                69.3             5.9          74.8             25.2          100.0


 (a) At secondary school, TAFE college, university or other educational institution. Total includes students
 who did not state full-time or part-time study status.
 (b) Includes people who did not state attendance at an educational institution.
 (c) Includes people who were employed and away from work.
 (d) Includes people who did not state labour force status.


In 2006 the oldest members of the iGeneration
were in their mid to late teens (aged 15–19
                                                                     Endnotes
years). The majority (75%) were students, with                       1 Australian Bureau of Statistics (ABS) 2006,
nearly three quarters of these attending                             Measures of Australia's Progress, cat. no. 1370.0, p.
secondary school and the remainder attending                         33, ABS, Canberra.
a TAFE college, university or other tertiary
institution. Nearly half (46%) of all 15–19 year                     2 ABS 1994, ‘Changes in living arrangements’, in
old members of the iGeneration were                                  Australian Social Trends 1994, cat. no. 4102.0, ABS,
                                                                     Canberra.
employed in 2006 compared to 42% of 15–19
year old members of Generation X and Y in
                                                                     3 Baum, N. and Jackson, N. 2004, Planning the local
1986 and 62% of 15–19 year old Baby Boomers
                                                                     government response to ageing and place, Local
in 1966. In 2006, many 15–19 year old iGens                          Government Association of NSW and Shires
were combining work and study (29%), and of                          Association of NSW, Sydney.
these, the overwhelming majority were
studying full-time while working in a part-time                      4 Australian Government 2007, Guide to the
job.                                                                 Teaching of Australian History in Years 9 and 10.


_______________________________________________________________________________________
14        ABS · A Picture of the Nation · 2070.0 · 2006
Where do
     Australians live?


A person's wellbeing is closely linked to where
they live. Location largely determines the range
of opportunities, and goods and services                    In 2006, three quarters of
available to satisfy an individual's needs and              the population were in
lifestyle. Because people's needs vary they will
settle in different places, seeking out a location
                                                            coastal towns and cities.
which they can afford and that provides the
best mix of opportunities, and goods and
services for them and their family.
                                                        From the bush to the
For people with children, one area might be             coast
attractive because it provides access to the
support and care provided by other family and           Over time, changes have occurred in the
friends. Some locations might be important to           opportunities, such as employment, and goods
a person’s identity, allowing for the expression        and services, such as health facilities, that many
or development of particular cultural facets of         areas traditionally provided. Further, people's
a person's life; for example, traditional lands         idea of what is desirable has changed,
for Aboriginal and Torres Strait Islander               including an expectation of having a broader
peoples. Other places might offer particular            range of options available. This has brought
educational opportunities, or provide                   about a shift in Australia's settlement pattern
enhanced employment and promotional                     from one that was strongly rural at Federation
prospects in a chosen field. Other areas might          (in 1901) to one currently dominated by urban
be attractive for their environment—located             coastal settlement.
close to the ocean, or away from crowding and
pollution. In others, access to specialist              At the 1911 Census, the main focus of the
medical services may be important for people            Australian economy was primary production
with a serious illness.                                 and 42% of the population were living in Rural
                                                        Areas. This strong rural settlement pattern
Areas that have a range of the most popular             came about because of the settlement of
opportunities, and goods and services often             inland areas primarily for agricultural use and
have expensive housing because many other               the large amount of employment created by
people seek to live there. For many people,             the labour intensive farming practices of the
compromises must be made between                        day. Other factors encouraging rural
affordability and the distance travelled to             settlement were the population dispersal
access these opportunities, and goods and               caused by the gold rushes, the development of
services. The result of the decisions and               other mining industries, and the establishment
compromises made by all Australians is a                of road and rail infrastructure in these areas.
settlement pattern, but one which has been
dynamic over time—changing with shifts in               By 2006, only 12% of Australians were located
individual and family needs and preferences,            in Rural Areas, while just over three quarters
the ability of particular locations to meet those       (77%) were in towns and cities of over 1,000
needs and preferences, and the relative                 people within 50 km of the coast. This pattern
income and wealth of individuals and families.          reflects the attraction of coastal environments


_______________________________________________________________________________________
16      ABS · A Picture of the Nation · 2070.0 · 2006
Population…Where do Australians live?


Population(a) of Urban Centres and Rural Localities, Australia(b), 2006


                                             Darwin


                                                                                                                   Brisbane


         Perth


                                                                                                          Sydney

                                                                    Adelaide
                                                                                                      Canberra


                               Population
                                                                               Melbourne

                                  1,000,000

                                    500,000
                                    100,000                                                  Hobart

                           0                          1000

                                    Kilometres


(a) Population is census count on a place of enumeration basis.
(b) Excludes Cocos (Keeling) and Christmas Islands.


to contemporary Australians, but perhaps
more importantly it highlights the fact that the
                                                                    Increasing urbanisation
large coastal towns and cities are now the                          Over the past century, while remaining
centres of employment and provide many                              sparsely settled, Australia has emerged as a
other desirable opportunities, and goods and                        highly urbanised nation. Over this period,
services.                                                           there has been a consistent, general trend for a
                                                                    greater proportion of the population to live in
While the desire to live in these towns and                         Australia's cities and towns. Over the 30 years
cities are driven by contemporary preferences,                      prior to the 2006 Census, the relative
the concentration of these towns and cities                         importance of the Metropolitan Urban areas
along the coast to a large degree reflects                          (that is, the state capitals, and Canberra from
Australia's colonial history. Sites of the colonial                 1954) has generally declined, while the coastal
capitals and penal settlements required access                      population centres, especially those near these
to coastal anchorages, adequate supplies of                         cities, have increased their share of the
fresh water and land with good agricultural                         population.
potential, fixing the location of many current
Australian towns and cities on or near the
coast.

_______________________________________________________________________________________
                                                             ABS · A Picture of the Nation · 2070.0 · 2006              17
Population…Where do Australians live?


 Classification of urban and rural areas
 An area is classified as urban or rural according to the level of population density and the type of
 land use. Across censuses the size of urban areas generally increases as the number of people in
 these areas grows. This occurs as land that was previously classified as rural is developed to house
 the population or to be used for purposes that are urban in nature (for example, roads, shopping
 centres and airports). This reduces, by a relatively small amount, the area of land that is classed as
 rural.

 For the first part of this article, Australia is divided into urban and rural areas according to the
 Urban Divisions classification used in Statistician's Reports between 1921 and 1966, along with
 corresponding areas back to the 1901 Census. From the 1976 Census onwards, a close
 approximation to this classification has been made using the Urban Centre and Locality, and
 Section of State classifications, allowing comparison with statistics from the earlier censuses. It
 should be noted that the areas of most cities and towns have expanded as population has
 increased, and some cities and towns included separately in earlier censuses have been joined into
 the urban area of larger cities in later censuses (for example, Ipswich into Brisbane).

 Where data from the 1976–2006 censuses are presented separately, the Urban Centre and Locality
 and Section of State classifications are used as described in the text. For further information on
 these classifications please see Statistical Geography: Volume 1—Australian Standard
 Geographical Classification (ASGC), 2006, ABS cat. no. 1216.0.


 Urban Divisions classification
 Metropolitan Urban include the capital cities, and surrounding suburbs, of Sydney, Melbourne,
 Brisbane, Adelaide, Perth and Hobart, with Canberra included from 1954. The Urban Centres
 corresponding to these capitals, from the Urban Centre and Locality classification, make up this
 category from 1971 onwards.

 Other Urban include the remaining incorporated towns and cities (including Darwin) and, from
 1954, other towns that contained 1,000 or more people (750 for Tasmania until 1966) at the time
 of each census. The change to the towns and cities included in Other Urban between the 1947 and
 1954 Censuses prevent comparison of the Other Urban and Rural Areas categories across these
 two censuses. From 1971 onwards, Urban Centres of 1,000 persons or more are used for this
 category.

 Rural Areas are the balance of the Australian population, including towns (or localities) not
 included in Other Urban above, and the migratory population.

 Where these categories of Urban Division are used in the text of this article they are capitalised.
 Where the words are not capitalised their use has a more general meaning.

 Population counts in urban and rural areas
 In this article populations in urban and rural areas are examined back as far as the 1901 Census.
 Data from these early censuses are only available on a place of enumeration basis, and so data on
 this basis are used for all censuses years examined. As Cocos (Keeling) Islands and Christmas
 Island were only included from the 1996 Census, the Other Territories category has been excluded
 from the analysis and the figures used in this article, including total Australia populations. This
 ensures figures are as comparable as possible.


_______________________________________________________________________________________
18     ABS · A Picture of the Nation · 2070.0 · 2006
20700 a picture_of_the_nation

More Related Content

What's hot

Promente Seeyn Voluntarism Research Results
Promente Seeyn Voluntarism Research ResultsPromente Seeyn Voluntarism Research Results
Promente Seeyn Voluntarism Research ResultsproMENTE social research
 
Lesser Slave Lake Sustainable Development Study_Ganna Samoylenko
Lesser Slave Lake Sustainable Development Study_Ganna SamoylenkoLesser Slave Lake Sustainable Development Study_Ganna Samoylenko
Lesser Slave Lake Sustainable Development Study_Ganna SamoylenkoGanna Samoylenko
 
Assessment of Juvenile Justice Reform Achievements in Kyrgyzstan
Assessment of Juvenile Justice Reform Achievements in KyrgyzstanAssessment of Juvenile Justice Reform Achievements in Kyrgyzstan
Assessment of Juvenile Justice Reform Achievements in KyrgyzstanUNICEF Europe & Central Asia
 
Ealy Warning Report, nr.2, January-March 2010
Ealy Warning Report, nr.2, January-March 2010Ealy Warning Report, nr.2, January-March 2010
Ealy Warning Report, nr.2, January-March 2010IDIS Viitorul
 
A comprehensive guide to zakat charity in islam by omer faruk senturk
A comprehensive guide to zakat charity in islam  by omer faruk senturkA comprehensive guide to zakat charity in islam  by omer faruk senturk
A comprehensive guide to zakat charity in islam by omer faruk senturkdocsforu
 
World Employment and Social Outloock
World Employment and Social OutloockWorld Employment and Social Outloock
World Employment and Social OutloockYsrrael Camero
 
Informe de la calidad del empleo 2013 de la oit
Informe de la calidad del empleo 2013 de la oitInforme de la calidad del empleo 2013 de la oit
Informe de la calidad del empleo 2013 de la oitSusana MIño Cedeño
 
Vietnam prsp(july 2006)
Vietnam prsp(july 2006)Vietnam prsp(july 2006)
Vietnam prsp(july 2006)Jarchin Raj
 
MichaelWagnerPhDDissertation
MichaelWagnerPhDDissertationMichaelWagnerPhDDissertation
MichaelWagnerPhDDissertationMichael Wagner
 
Marine corps intelligence activity romania country handbook
Marine corps intelligence activity romania country handbookMarine corps intelligence activity romania country handbook
Marine corps intelligence activity romania country handbookRepentSinner
 

What's hot (20)

Promente Seeyn Voluntarism Research Results
Promente Seeyn Voluntarism Research ResultsPromente Seeyn Voluntarism Research Results
Promente Seeyn Voluntarism Research Results
 
Master Thesis_Organic Brand Heritage
Master Thesis_Organic Brand HeritageMaster Thesis_Organic Brand Heritage
Master Thesis_Organic Brand Heritage
 
Lesser Slave Lake Sustainable Development Study_Ganna Samoylenko
Lesser Slave Lake Sustainable Development Study_Ganna SamoylenkoLesser Slave Lake Sustainable Development Study_Ganna Samoylenko
Lesser Slave Lake Sustainable Development Study_Ganna Samoylenko
 
National Sled Hockey League
National Sled Hockey League National Sled Hockey League
National Sled Hockey League
 
CASE Network Studies and Analyses 461 - Costs and Benefits of Labour Mobility...
CASE Network Studies and Analyses 461 - Costs and Benefits of Labour Mobility...CASE Network Studies and Analyses 461 - Costs and Benefits of Labour Mobility...
CASE Network Studies and Analyses 461 - Costs and Benefits of Labour Mobility...
 
Assessment of Juvenile Justice Reform Achievements in Kyrgyzstan
Assessment of Juvenile Justice Reform Achievements in KyrgyzstanAssessment of Juvenile Justice Reform Achievements in Kyrgyzstan
Assessment of Juvenile Justice Reform Achievements in Kyrgyzstan
 
LPALT
LPALTLPALT
LPALT
 
CASE Network Studies and Analyses 465 - Costs and Benefits of Labour Mobility...
CASE Network Studies and Analyses 465 - Costs and Benefits of Labour Mobility...CASE Network Studies and Analyses 465 - Costs and Benefits of Labour Mobility...
CASE Network Studies and Analyses 465 - Costs and Benefits of Labour Mobility...
 
Trends 2015
Trends 2015Trends 2015
Trends 2015
 
Ealy Warning Report, nr.2, January-March 2010
Ealy Warning Report, nr.2, January-March 2010Ealy Warning Report, nr.2, January-March 2010
Ealy Warning Report, nr.2, January-March 2010
 
Social harmonization and labor market performance in europe
Social harmonization and labor market performance in europeSocial harmonization and labor market performance in europe
Social harmonization and labor market performance in europe
 
A comprehensive guide to zakat charity in islam by omer faruk senturk
A comprehensive guide to zakat charity in islam  by omer faruk senturkA comprehensive guide to zakat charity in islam  by omer faruk senturk
A comprehensive guide to zakat charity in islam by omer faruk senturk
 
World Employment and Social Outloock
World Employment and Social OutloockWorld Employment and Social Outloock
World Employment and Social Outloock
 
Informe de la calidad del empleo 2013 de la oit
Informe de la calidad del empleo 2013 de la oitInforme de la calidad del empleo 2013 de la oit
Informe de la calidad del empleo 2013 de la oit
 
Vietnam prsp(july 2006)
Vietnam prsp(july 2006)Vietnam prsp(july 2006)
Vietnam prsp(july 2006)
 
CASE Network Report 71 - The New EU Frontier: Perspectives on Enhanced Econom...
CASE Network Report 71 - The New EU Frontier: Perspectives on Enhanced Econom...CASE Network Report 71 - The New EU Frontier: Perspectives on Enhanced Econom...
CASE Network Report 71 - The New EU Frontier: Perspectives on Enhanced Econom...
 
Max weber
Max weberMax weber
Max weber
 
Success Stories of Reforms
Success Stories of ReformsSuccess Stories of Reforms
Success Stories of Reforms
 
MichaelWagnerPhDDissertation
MichaelWagnerPhDDissertationMichaelWagnerPhDDissertation
MichaelWagnerPhDDissertation
 
Marine corps intelligence activity romania country handbook
Marine corps intelligence activity romania country handbookMarine corps intelligence activity romania country handbook
Marine corps intelligence activity romania country handbook
 

Viewers also liked

The best that England has to offer - Scot Carson
The best that England has to offer - Scot CarsonThe best that England has to offer - Scot Carson
The best that England has to offer - Scot CarsonBruce Henderson
 
Vanity of Indians and the Success of the Cosmetic Advertisements
Vanity of Indians and the Success of the Cosmetic AdvertisementsVanity of Indians and the Success of the Cosmetic Advertisements
Vanity of Indians and the Success of the Cosmetic AdvertisementsShanthi Parasuraman
 
Att programmera med javascript grunder
Att programmera med javascript   grunderAtt programmera med javascript   grunder
Att programmera med javascript grunderHåkan Elderstig
 
Управление информацией с помощью он-лайн сервисов
Управление информацией с помощью он-лайн сервисовУправление информацией с помощью он-лайн сервисов
Управление информацией с помощью он-лайн сервисовМихаил Цыкарев
 
When the faith rubber meets the road mile 3
When the faith rubber meets the road   mile 3When the faith rubber meets the road   mile 3
When the faith rubber meets the road mile 3Donald Jacobs
 
The nuts bolts_of_prudal (1)
The nuts bolts_of_prudal (1)The nuts bolts_of_prudal (1)
The nuts bolts_of_prudal (1)Michael Grigsby
 
Misterele holocaustului
Misterele holocaustuluiMisterele holocaustului
Misterele holocaustuluiCitesteLiber
 
Waste! Is it really a problem?
Waste! Is it really a problem?Waste! Is it really a problem?
Waste! Is it really a problem?athna11
 
OpenWest Conference at UVU, Ruby on Rails and BDD
OpenWest Conference at UVU, Ruby on Rails and BDDOpenWest Conference at UVU, Ruby on Rails and BDD
OpenWest Conference at UVU, Ruby on Rails and BDDStephen Felt
 
Virtual Disaster Recovery ROI
Virtual Disaster Recovery ROIVirtual Disaster Recovery ROI
Virtual Disaster Recovery ROIJason Dea
 
Doing More with Less in Challenging Economic Times
Doing More with Less in Challenging Economic TimesDoing More with Less in Challenging Economic Times
Doing More with Less in Challenging Economic TimesJason Dea
 
Prevención del sida en la escuela secundaria
Prevención del sida en la escuela secundariaPrevención del sida en la escuela secundaria
Prevención del sida en la escuela secundarialucmcgreb
 
Final exam 2 (grade 8 esl)
Final exam 2 (grade 8 esl)Final exam 2 (grade 8 esl)
Final exam 2 (grade 8 esl)Deb Homillano
 
Presentera entreprenöriellt lärande efter kick off2
Presentera entreprenöriellt lärande efter kick off2Presentera entreprenöriellt lärande efter kick off2
Presentera entreprenöriellt lärande efter kick off2Håkan Elderstig
 

Viewers also liked (20)

Filosofie
FilosofieFilosofie
Filosofie
 
Seo Manual
Seo ManualSeo Manual
Seo Manual
 
Mya (26.12.10)
Mya (26.12.10)Mya (26.12.10)
Mya (26.12.10)
 
The best that England has to offer - Scot Carson
The best that England has to offer - Scot CarsonThe best that England has to offer - Scot Carson
The best that England has to offer - Scot Carson
 
Vanity of Indians and the Success of the Cosmetic Advertisements
Vanity of Indians and the Success of the Cosmetic AdvertisementsVanity of Indians and the Success of the Cosmetic Advertisements
Vanity of Indians and the Success of the Cosmetic Advertisements
 
Newsletter January - February 2011
Newsletter January  - February 2011Newsletter January  - February 2011
Newsletter January - February 2011
 
Att programmera med javascript grunder
Att programmera med javascript   grunderAtt programmera med javascript   grunder
Att programmera med javascript grunder
 
Управление информацией с помощью он-лайн сервисов
Управление информацией с помощью он-лайн сервисовУправление информацией с помощью он-лайн сервисов
Управление информацией с помощью он-лайн сервисов
 
When the faith rubber meets the road mile 3
When the faith rubber meets the road   mile 3When the faith rubber meets the road   mile 3
When the faith rubber meets the road mile 3
 
The nuts bolts_of_prudal (1)
The nuts bolts_of_prudal (1)The nuts bolts_of_prudal (1)
The nuts bolts_of_prudal (1)
 
Misterele holocaustului
Misterele holocaustuluiMisterele holocaustului
Misterele holocaustului
 
Waste! Is it really a problem?
Waste! Is it really a problem?Waste! Is it really a problem?
Waste! Is it really a problem?
 
OpenWest Conference at UVU, Ruby on Rails and BDD
OpenWest Conference at UVU, Ruby on Rails and BDDOpenWest Conference at UVU, Ruby on Rails and BDD
OpenWest Conference at UVU, Ruby on Rails and BDD
 
Virtual Disaster Recovery ROI
Virtual Disaster Recovery ROIVirtual Disaster Recovery ROI
Virtual Disaster Recovery ROI
 
PDC prsentation
PDC prsentationPDC prsentation
PDC prsentation
 
Doing More with Less in Challenging Economic Times
Doing More with Less in Challenging Economic TimesDoing More with Less in Challenging Economic Times
Doing More with Less in Challenging Economic Times
 
Prevención del sida en la escuela secundaria
Prevención del sida en la escuela secundariaPrevención del sida en la escuela secundaria
Prevención del sida en la escuela secundaria
 
Final exam 2 (grade 8 esl)
Final exam 2 (grade 8 esl)Final exam 2 (grade 8 esl)
Final exam 2 (grade 8 esl)
 
Addventure
AddventureAddventure
Addventure
 
Presentera entreprenöriellt lärande efter kick off2
Presentera entreprenöriellt lärande efter kick off2Presentera entreprenöriellt lärande efter kick off2
Presentera entreprenöriellt lärande efter kick off2
 

Similar to 20700 a picture_of_the_nation

The WalkUP Wake-Up Call: Atlanta The Poster Child of Sprawl Builds a Walkable...
The WalkUP Wake-Up Call: Atlanta The Poster Child of Sprawl Builds a Walkable...The WalkUP Wake-Up Call: Atlanta The Poster Child of Sprawl Builds a Walkable...
The WalkUP Wake-Up Call: Atlanta The Poster Child of Sprawl Builds a Walkable...Jesse Budlong
 
ROC (Taiwan) Yearbook 2011 Indices
ROC (Taiwan) Yearbook 2011 IndicesROC (Taiwan) Yearbook 2011 Indices
ROC (Taiwan) Yearbook 2011 IndicesKlaus Bardenhagen
 
The ILO and the informal sector: an institutional history
The ILO and the informal sector: an institutional historyThe ILO and the informal sector: an institutional history
The ILO and the informal sector: an institutional historyDr Lendy Spires
 
VicgovtabledreportMental_Health_Report_FCDC2012
VicgovtabledreportMental_Health_Report_FCDC2012VicgovtabledreportMental_Health_Report_FCDC2012
VicgovtabledreportMental_Health_Report_FCDC2012Ingrid Ozols
 
Society at a Glance 2016 OECD. Social indicators
Society at a Glance 2016 OECD. Social indicatorsSociety at a Glance 2016 OECD. Social indicators
Society at a Glance 2016 OECD. Social indicatorsLino Agudelo Luna
 
Zimbabwe's 2013 constitution
Zimbabwe's 2013 constitution Zimbabwe's 2013 constitution
Zimbabwe's 2013 constitution Povo News
 
Plan Nacional para el Buen Vivir (inglés)
Plan Nacional para el Buen Vivir (inglés)Plan Nacional para el Buen Vivir (inglés)
Plan Nacional para el Buen Vivir (inglés)Vethowen Chica
 
Hofstede's Cultural Dimensions
Hofstede's Cultural DimensionsHofstede's Cultural Dimensions
Hofstede's Cultural DimensionsPakeezaTehmuri
 
UK Commercial Banking industry analysis
UK Commercial Banking industry analysisUK Commercial Banking industry analysis
UK Commercial Banking industry analysisManan Kakkar
 
CREATIVE INDUSTRIES IN ESTONIA, LATVIA AND LITHUANIA 2011
CREATIVE INDUSTRIES IN ESTONIA, LATVIA AND LITHUANIA 2011CREATIVE INDUSTRIES IN ESTONIA, LATVIA AND LITHUANIA 2011
CREATIVE INDUSTRIES IN ESTONIA, LATVIA AND LITHUANIA 2011Daniel Dufourt
 

Similar to 20700 a picture_of_the_nation (20)

Growing importance of men in families (1)
Growing importance of men in families (1)Growing importance of men in families (1)
Growing importance of men in families (1)
 
US Grains Council, Food 2040
US Grains Council, Food 2040US Grains Council, Food 2040
US Grains Council, Food 2040
 
The WalkUP Wake-Up Call: Atlanta The Poster Child of Sprawl Builds a Walkable...
The WalkUP Wake-Up Call: Atlanta The Poster Child of Sprawl Builds a Walkable...The WalkUP Wake-Up Call: Atlanta The Poster Child of Sprawl Builds a Walkable...
The WalkUP Wake-Up Call: Atlanta The Poster Child of Sprawl Builds a Walkable...
 
ROC (Taiwan) Yearbook 2011 Indices
ROC (Taiwan) Yearbook 2011 IndicesROC (Taiwan) Yearbook 2011 Indices
ROC (Taiwan) Yearbook 2011 Indices
 
The ILO and the informal sector: an institutional history
The ILO and the informal sector: an institutional historyThe ILO and the informal sector: an institutional history
The ILO and the informal sector: an institutional history
 
VicgovtabledreportMental_Health_Report_FCDC2012
VicgovtabledreportMental_Health_Report_FCDC2012VicgovtabledreportMental_Health_Report_FCDC2012
VicgovtabledreportMental_Health_Report_FCDC2012
 
Thesis
ThesisThesis
Thesis
 
Society at a Glance 2016 OECD. Social indicators
Society at a Glance 2016 OECD. Social indicatorsSociety at a Glance 2016 OECD. Social indicators
Society at a Glance 2016 OECD. Social indicators
 
Zimbabwe's 2013 constitution
Zimbabwe's 2013 constitution Zimbabwe's 2013 constitution
Zimbabwe's 2013 constitution
 
Zimbabwe 2013
Zimbabwe 2013Zimbabwe 2013
Zimbabwe 2013
 
San Diego Regional Homeless Profile
San Diego Regional Homeless ProfileSan Diego Regional Homeless Profile
San Diego Regional Homeless Profile
 
RAND_TR715
RAND_TR715RAND_TR715
RAND_TR715
 
Plan Nacional para el Buen Vivir (inglés)
Plan Nacional para el Buen Vivir (inglés)Plan Nacional para el Buen Vivir (inglés)
Plan Nacional para el Buen Vivir (inglés)
 
RAND_Aff_housing
RAND_Aff_housingRAND_Aff_housing
RAND_Aff_housing
 
NAS-Report
NAS-ReportNAS-Report
NAS-Report
 
Men in Families and Family Policy in a Changing World
Men in Families and Family Policy in a Changing WorldMen in Families and Family Policy in a Changing World
Men in Families and Family Policy in a Changing World
 
Hofstede's Cultural Dimensions
Hofstede's Cultural DimensionsHofstede's Cultural Dimensions
Hofstede's Cultural Dimensions
 
UK Commercial Banking industry analysis
UK Commercial Banking industry analysisUK Commercial Banking industry analysis
UK Commercial Banking industry analysis
 
CREATIVE INDUSTRIES IN ESTONIA, LATVIA AND LITHUANIA 2011
CREATIVE INDUSTRIES IN ESTONIA, LATVIA AND LITHUANIA 2011CREATIVE INDUSTRIES IN ESTONIA, LATVIA AND LITHUANIA 2011
CREATIVE INDUSTRIES IN ESTONIA, LATVIA AND LITHUANIA 2011
 
2019 wdr-report-min
2019 wdr-report-min2019 wdr-report-min
2019 wdr-report-min
 

Recently uploaded

Expanded definition: technical and operational
Expanded definition: technical and operationalExpanded definition: technical and operational
Expanded definition: technical and operationalssuser3e220a
 
Student Profile Sample - We help schools to connect the data they have, with ...
Student Profile Sample - We help schools to connect the data they have, with ...Student Profile Sample - We help schools to connect the data they have, with ...
Student Profile Sample - We help schools to connect the data they have, with ...Seán Kennedy
 
Transaction Management in Database Management System
Transaction Management in Database Management SystemTransaction Management in Database Management System
Transaction Management in Database Management SystemChristalin Nelson
 
Unraveling Hypertext_ Analyzing Postmodern Elements in Literature.pptx
Unraveling Hypertext_ Analyzing  Postmodern Elements in  Literature.pptxUnraveling Hypertext_ Analyzing  Postmodern Elements in  Literature.pptx
Unraveling Hypertext_ Analyzing Postmodern Elements in Literature.pptxDhatriParmar
 
Man or Manufactured_ Redefining Humanity Through Biopunk Narratives.pptx
Man or Manufactured_ Redefining Humanity Through Biopunk Narratives.pptxMan or Manufactured_ Redefining Humanity Through Biopunk Narratives.pptx
Man or Manufactured_ Redefining Humanity Through Biopunk Narratives.pptxDhatriParmar
 
Visit to a blind student's school🧑‍🦯🧑‍🦯(community medicine)
Visit to a blind student's school🧑‍🦯🧑‍🦯(community medicine)Visit to a blind student's school🧑‍🦯🧑‍🦯(community medicine)
Visit to a blind student's school🧑‍🦯🧑‍🦯(community medicine)lakshayb543
 
Narcotic and Non Narcotic Analgesic..pdf
Narcotic and Non Narcotic Analgesic..pdfNarcotic and Non Narcotic Analgesic..pdf
Narcotic and Non Narcotic Analgesic..pdfPrerana Jadhav
 
BIOCHEMISTRY-CARBOHYDRATE METABOLISM CHAPTER 2.pptx
BIOCHEMISTRY-CARBOHYDRATE METABOLISM CHAPTER 2.pptxBIOCHEMISTRY-CARBOHYDRATE METABOLISM CHAPTER 2.pptx
BIOCHEMISTRY-CARBOHYDRATE METABOLISM CHAPTER 2.pptxSayali Powar
 
Mythology Quiz-4th April 2024, Quiz Club NITW
Mythology Quiz-4th April 2024, Quiz Club NITWMythology Quiz-4th April 2024, Quiz Club NITW
Mythology Quiz-4th April 2024, Quiz Club NITWQuiz Club NITW
 
Oppenheimer Film Discussion for Philosophy and Film
Oppenheimer Film Discussion for Philosophy and FilmOppenheimer Film Discussion for Philosophy and Film
Oppenheimer Film Discussion for Philosophy and FilmStan Meyer
 
Congestive Cardiac Failure..presentation
Congestive Cardiac Failure..presentationCongestive Cardiac Failure..presentation
Congestive Cardiac Failure..presentationdeepaannamalai16
 
4.11.24 Poverty and Inequality in America.pptx
4.11.24 Poverty and Inequality in America.pptx4.11.24 Poverty and Inequality in America.pptx
4.11.24 Poverty and Inequality in America.pptxmary850239
 
Q4-PPT-Music9_Lesson-1-Romantic-Opera.pptx
Q4-PPT-Music9_Lesson-1-Romantic-Opera.pptxQ4-PPT-Music9_Lesson-1-Romantic-Opera.pptx
Q4-PPT-Music9_Lesson-1-Romantic-Opera.pptxlancelewisportillo
 
4.16.24 21st Century Movements for Black Lives.pptx
4.16.24 21st Century Movements for Black Lives.pptx4.16.24 21st Century Movements for Black Lives.pptx
4.16.24 21st Century Movements for Black Lives.pptxmary850239
 
Q-Factor General Quiz-7th April 2024, Quiz Club NITW
Q-Factor General Quiz-7th April 2024, Quiz Club NITWQ-Factor General Quiz-7th April 2024, Quiz Club NITW
Q-Factor General Quiz-7th April 2024, Quiz Club NITWQuiz Club NITW
 
INTRODUCTION TO CATHOLIC CHRISTOLOGY.pptx
INTRODUCTION TO CATHOLIC CHRISTOLOGY.pptxINTRODUCTION TO CATHOLIC CHRISTOLOGY.pptx
INTRODUCTION TO CATHOLIC CHRISTOLOGY.pptxHumphrey A Beña
 
Using Grammatical Signals Suitable to Patterns of Idea Development
Using Grammatical Signals Suitable to Patterns of Idea DevelopmentUsing Grammatical Signals Suitable to Patterns of Idea Development
Using Grammatical Signals Suitable to Patterns of Idea Developmentchesterberbo7
 
Daily Lesson Plan in Mathematics Quarter 4
Daily Lesson Plan in Mathematics Quarter 4Daily Lesson Plan in Mathematics Quarter 4
Daily Lesson Plan in Mathematics Quarter 4JOYLYNSAMANIEGO
 

Recently uploaded (20)

Expanded definition: technical and operational
Expanded definition: technical and operationalExpanded definition: technical and operational
Expanded definition: technical and operational
 
Student Profile Sample - We help schools to connect the data they have, with ...
Student Profile Sample - We help schools to connect the data they have, with ...Student Profile Sample - We help schools to connect the data they have, with ...
Student Profile Sample - We help schools to connect the data they have, with ...
 
Transaction Management in Database Management System
Transaction Management in Database Management SystemTransaction Management in Database Management System
Transaction Management in Database Management System
 
Unraveling Hypertext_ Analyzing Postmodern Elements in Literature.pptx
Unraveling Hypertext_ Analyzing  Postmodern Elements in  Literature.pptxUnraveling Hypertext_ Analyzing  Postmodern Elements in  Literature.pptx
Unraveling Hypertext_ Analyzing Postmodern Elements in Literature.pptx
 
Man or Manufactured_ Redefining Humanity Through Biopunk Narratives.pptx
Man or Manufactured_ Redefining Humanity Through Biopunk Narratives.pptxMan or Manufactured_ Redefining Humanity Through Biopunk Narratives.pptx
Man or Manufactured_ Redefining Humanity Through Biopunk Narratives.pptx
 
Visit to a blind student's school🧑‍🦯🧑‍🦯(community medicine)
Visit to a blind student's school🧑‍🦯🧑‍🦯(community medicine)Visit to a blind student's school🧑‍🦯🧑‍🦯(community medicine)
Visit to a blind student's school🧑‍🦯🧑‍🦯(community medicine)
 
Narcotic and Non Narcotic Analgesic..pdf
Narcotic and Non Narcotic Analgesic..pdfNarcotic and Non Narcotic Analgesic..pdf
Narcotic and Non Narcotic Analgesic..pdf
 
BIOCHEMISTRY-CARBOHYDRATE METABOLISM CHAPTER 2.pptx
BIOCHEMISTRY-CARBOHYDRATE METABOLISM CHAPTER 2.pptxBIOCHEMISTRY-CARBOHYDRATE METABOLISM CHAPTER 2.pptx
BIOCHEMISTRY-CARBOHYDRATE METABOLISM CHAPTER 2.pptx
 
Mythology Quiz-4th April 2024, Quiz Club NITW
Mythology Quiz-4th April 2024, Quiz Club NITWMythology Quiz-4th April 2024, Quiz Club NITW
Mythology Quiz-4th April 2024, Quiz Club NITW
 
prashanth updated resume 2024 for Teaching Profession
prashanth updated resume 2024 for Teaching Professionprashanth updated resume 2024 for Teaching Profession
prashanth updated resume 2024 for Teaching Profession
 
Oppenheimer Film Discussion for Philosophy and Film
Oppenheimer Film Discussion for Philosophy and FilmOppenheimer Film Discussion for Philosophy and Film
Oppenheimer Film Discussion for Philosophy and Film
 
INCLUSIVE EDUCATION PRACTICES FOR TEACHERS AND TRAINERS.pptx
INCLUSIVE EDUCATION PRACTICES FOR TEACHERS AND TRAINERS.pptxINCLUSIVE EDUCATION PRACTICES FOR TEACHERS AND TRAINERS.pptx
INCLUSIVE EDUCATION PRACTICES FOR TEACHERS AND TRAINERS.pptx
 
Congestive Cardiac Failure..presentation
Congestive Cardiac Failure..presentationCongestive Cardiac Failure..presentation
Congestive Cardiac Failure..presentation
 
4.11.24 Poverty and Inequality in America.pptx
4.11.24 Poverty and Inequality in America.pptx4.11.24 Poverty and Inequality in America.pptx
4.11.24 Poverty and Inequality in America.pptx
 
Q4-PPT-Music9_Lesson-1-Romantic-Opera.pptx
Q4-PPT-Music9_Lesson-1-Romantic-Opera.pptxQ4-PPT-Music9_Lesson-1-Romantic-Opera.pptx
Q4-PPT-Music9_Lesson-1-Romantic-Opera.pptx
 
4.16.24 21st Century Movements for Black Lives.pptx
4.16.24 21st Century Movements for Black Lives.pptx4.16.24 21st Century Movements for Black Lives.pptx
4.16.24 21st Century Movements for Black Lives.pptx
 
Q-Factor General Quiz-7th April 2024, Quiz Club NITW
Q-Factor General Quiz-7th April 2024, Quiz Club NITWQ-Factor General Quiz-7th April 2024, Quiz Club NITW
Q-Factor General Quiz-7th April 2024, Quiz Club NITW
 
INTRODUCTION TO CATHOLIC CHRISTOLOGY.pptx
INTRODUCTION TO CATHOLIC CHRISTOLOGY.pptxINTRODUCTION TO CATHOLIC CHRISTOLOGY.pptx
INTRODUCTION TO CATHOLIC CHRISTOLOGY.pptx
 
Using Grammatical Signals Suitable to Patterns of Idea Development
Using Grammatical Signals Suitable to Patterns of Idea DevelopmentUsing Grammatical Signals Suitable to Patterns of Idea Development
Using Grammatical Signals Suitable to Patterns of Idea Development
 
Daily Lesson Plan in Mathematics Quarter 4
Daily Lesson Plan in Mathematics Quarter 4Daily Lesson Plan in Mathematics Quarter 4
Daily Lesson Plan in Mathematics Quarter 4
 

20700 a picture_of_the_nation

  • 1. Contents Preface ...............................................................................................vii Introduction .....................................................................................viii About the census ...............................................................................ix Technical notes...................................................................................x CHAPTERS 1 Population 1–32 Overview..............................................................................................2 From generation to generation .........................................................9 Where do Australians live?................................................................16 On the move .....................................................................................24 2 Cultural diversity 33–58 Overview............................................................................................34 Second generation Australians.........................................................46 Religion across the generations.......................................................54 3 Living arrangements 59–88 Overview............................................................................................60 Children’s living arrangements ........................................................74 Families with young children: a Sydney case study........................81 4 Community 89–112 Overview............................................................................................90 Volunteering across Australia.........................................................103 Caring across the life cycle .............................................................107 5 Education 113–135 Overview..........................................................................................114 Adult education across the generations........................................123 School teachers...............................................................................129 _______________________________________________________________________________________ ABS · A Picture of the Nation · 2070.0 · 2006 iii
  • 2. Contents 6 Work 137–172 Overview..........................................................................................138 Skill shortages .................................................................................151 Generations of employment ..........................................................159 Driving to work ...............................................................................167 7 Economic resources 173–202 Overview..........................................................................................175 Workers’ incomes across Australia ................................................188 Workers’ incomes in selected regions...........................................197 8 Housing 203–232 Overview..........................................................................................204 Trends in housing utilisation .........................................................215 Housing across Brisbane and Melbourne city rings .....................224 ADDITIONAL INFORMATION Glossary ...........................................................................................233 Appendix: Photo acknowledgements............................................251 _______________________________________________________________________________________ iv ABS · A Picture of the Nation · 2070.0 · 2006
  • 3.
  • 4. Preface The renowned New South Wales Statistician T.A. Coghlan presented the first Statistician's Report for the Census of New South Wales in 1891. It included details of all the previous censuses back to the earliest musters of convicts in Sydney Cove and set a precedent for high quality analysis of the population census. George Handley Knibbs published the first Commonwealth Statistician's Report with the results of the 1911 Commonwealth Census. Following the comprehensive nature of previous reports, it was nearly 1000 pages long. The First World War impinged on its release and it took six years from the date of the census before its release in 1917. It was the first time that a clear picture of the people of our young nation was available. The Commonwealth Statistician's Report was released for every subsequent census for 50 years—from 1911 until 1961. While the tradition of releasing a Commonwealth Statistician's Report dwindled with the introduction of computing and the availability of census data on a mass scale, the need for analytical publications remained. During the 1980s a number of smaller publications were released in its place. For the censuses from 1986 to 2001, Australia in Profile along with other thematic publications offered analysis of the census. The fifteenth Census of Population and Housing was held on 8 August 2006. It incorporated a number of changes designed to keep the census as efficient and contemporary as possible. For the first time, people could complete their census form online. In addition, new questions on need for assistance (a measure of disability), and voluntary and unpaid work were included. The first data from the 2006 Census were released in June 2007 and incorporated a completely redesigned web based system that uses a wide range of searching and mapping facilities. Ultimately, the purpose of each census is to put vital information into the hands of users across Australia. It helps Australians understand how the nation is changing. The census covers a wide variety of topics, with detailed data available down to the regional and small area levels and about small population groups in our society. As a result, the census provides statistical information which can assist decision making in all sections of society: governments, businesses, academics, researchers, students, community organisations and individuals. For previous censuses the Statistician’s Reports played a strong role in fulfilling this purpose. Now I would like to reintroduce a Statistician's Report for the 21st century. Today, a huge breadth of information is available from the census, and it would be impossible for one report to summarise it all. The 2006 Australian Statistician's Report showcases the depth and range of information that the 2006 Census and previous censuses provides about Australia's diverse peoples. It covers topics as varied as changes to families and living arrangements, commuting to work, skills shortages, and second generation Australians. This edition has a particular focus on changes across the generations and differences across Australia. I would like to thank the Australian people for participating in the census and the tens of thousands of people who worked on the 2006 Census. Thanks also to the ABS staff who prepared this report, A Picture of the Nation: The Statistician's Report on the 2006 Census. Brian Pink Australian Statistician January 2009 _______________________________________________________________________________________ ABS · A Picture of the Nation · 2070.0 · 2006 vii
  • 5. Introduction A Picture of the Nation: The Statistician's Report on the 2006 Census analyses information collected in the 2006 Census of Population and Housing. It also incorporates information from previous censuses—in some instances going back as far as 1911. It presents stories about contemporary society and trends that affect the lives of Australian people. Drawing on the rich variety of topics covered by the census and looking across different geographic areas and population groups, this report showcases the many strengths of census data. The report consists of eight chapters, each focusing on different areas of social interest and concern: population, cultural diversity, community, living arrangements, education, work, economic resources and housing. Each chapter contains an overview and two or three feature articles. The overviews report on relevant census findings at a broad level. The feature articles focus on specific social issues or population subgroups. While the overviews and feature articles are self-contained and readable in their own right, they complement the other articles in their chapters. For example, along with unpaid childcare and unpaid care for people with disabilities, the ‘Community overview’ examines volunteering in Australia at the broad level. Complementing this, one of the chapter’s feature articles, ‘Volunteering across Australia’, further explores the geographic dimension of volunteering by focusing on smaller geographic areas across Australia. To help readers get the most from the stories presented here, tables, graphs, maps and boxes are used in conjunction with the easy-to-read analysis. For those wanting to understand more, a Glossary provides definitions of the complex concepts used throughout the report, and definition boxes explain terms and concepts that are specific to the overviews or articles where they are used. While the articles primarily draw on census data, information or data obtained from other sources, such as other publications or Australian Bureau of Statistics data collections, are referenced in endnotes for each overview and article. The fact that high quality national censuses have been held in Australia for almost a century, allows the characteristics of Australia’s diverse population to be analysed in many different ways. Two approaches for examining sub-groups of the population have been used in this report: Life cycle and Generational group analysis. By grouping together people at similar stages of life, Life-cycle groups help to reveal the common stories and trends experienced by members of these groups. For instance, young adults have the greatest diversity in living arrangements, reflecting the many transitions they are facing (see the ‘Living arrangements overview’, p. 60–72). Similarly, by splitting the population into five age-based Generation groups, such as the Lucky and Baby Boomer Generations, and Generation X and Y, interesting differences emerge. For instance, more than three quarters of the Lucky Generation were affiliated with a Christian denomination, compared with just over one half of Generation X and Y (see ‘Religion across the generations’, p. 54–58). Reflecting the important role that the census has in providing information about small geographic areas, many parts of this report illustrate the different ways that Australia can be divided geographically from the census. These range from states and territories, cities and regions, down to small communities and urban centres, as well as broad categories of remoteness that cross state and territory borders. More information about the basis of the different population counts used in this report, as well as the techniques and standard methods used in analysing and presenting data, can be found in the ‘Technical notes’, p. x–xii. _______________________________________________________________________________________ viii ABS · A Picture of the Nation · 2070.0 · 2006
  • 6. About the census The five yearly Census of Population and Housing is the largest statistical collection undertaken by the Australian Bureau of Statistics (ABS) and one of the largest regular peace time operations conducted in Australia. The 2006 Census was conducted on Tuesday, 8 August. The census included all people in Australia on Census Night, with the exception of foreign diplomats and their families. Visitors to Australia are counted regardless of how long they have been in the country or how long they plan to stay. Australian residents out of the country on Census Night are not counted in the Census. More detail on the conduct of the 2006 Census is available in How Australia Takes a Census (cat. no. 2903.0). The legislative basis of the Census of Population and Housing is the Census and Statistics Act 1905. This Act also requires the ABS and its officers to protect the confidentiality of the information collected. Two broad objectives underpin the Census. The first is to measure accurately the number and key characteristics of Australian residents and the dwellings in which they live. The second is to provide timely, high quality and relevant data on these topics for small geographic areas and small population groups. Census data provide a reliable basis for the estimation of the population of each of the states, territories and local government areas, primarily for electoral purposes and the distribution of government funds. The census also provides statistical information that can assist decision making in all sections of society: governments, businesses, academics, researchers, students, community organisations and individuals. Census data complement other sources of information collected by the ABS and other organisations. For instance, many of the household surveys conducted by the ABS use more detailed questions than the census can support and therefore are much richer sources of information on their particular topics. However, these surveys typically cannot provide these data for small population groups or small areas. To achieve accurate, high quality data from the census, extensive effort is put into census form design, collection procedures, and processing. There are four principle sources of error in Census data: respondent error, processing error, partial and non-response, and undercount. Quality management aims to reduce these errors as much as possible. The Census page on the ABS website (www.abs.gov.au/census) provides links to more information on census data quality, including information about the quality of specific data items from the census. _______________________________________________________________________________________ ABS · A Picture of the Nation · 2070.0 · 2006 ix
  • 7. Technical notes Different types of population counts The estimated resident population (ERP) is Australia's official population measure. It is based on census counts of usual residents (discussed below), which are adjusted for undercount in the census and the number of Australian residents estimated to have been temporarily overseas at the time of the census. Further adjustments are made for births, deaths and net migration in the period from the date of the estimate (30 June) to Census Night (that is, 8 August 2006). As they are the most accurate count of the population, ERP figures have been used wherever possible in the Population chapter of this report. However, only a limited number of characteristics of the population are available through ERP: age, sex, marital status (registered), country of birth and geographic location. To allow analysis of the broad range of characteristics available from the census, three different population counts from the census have been used in this report—place of enumeration, place of usual residence and persons temporarily absent on Census Night. In Australia the census counts people where they are located on Census Night—their ‘place of enumeration’. The place of enumeration census count is only used in this report where comparisons are made with censuses prior to 1976, as this was the only census count available from earlier censuses. The usual resident population count is derived from information people provide on their census form about where they lived, or intend to live, for 6 months or more in 2006—their ‘place of usual residence’. Information about people who are not at home on Census Night is linked back to the area in which they usually live (that is, their Collection District). However, it is impractical to link the information about these people back to their actual families, households or dwellings. In some instances, the absence of this information could have an impact on the analysis of the characteristics of families, households and dwellings. The census count of persons temporarily absent from households is used in a limited number of places in this report. Answers to questions on the census form, provided by residents present on Census Night, indicate whether there were people temporarily absent from their household. The number and characteristics of these temporarily absent people have been used in some instances to provide more information on the total usual residents of households, as well as providing detail of family structures and living arrangements, making the analysis undertaken more accurate. As census usual resident population counts are the most common population count used in this report, their use in tables, graphs and text is not noted. Where any of the other population counts discussed above are used, this is noted in footnotes and in the text. Time series comparisons In a number of overviews and articles in this report, comparisons have been made between the 2006 Census and earlier censuses. Two significant events affecting the census have occurred that should be considered when making comparisons of census data over time. Firstly, under the constitution at Federation, ‘Aboriginal natives’ were not to be counted in the census and so were excluded from the final results. This restriction was removed following a referendum in 1967. The ABS has endeavoured to conduct as full a count of Indigenous peoples as possible from the 1971 Census onwards, and has included these peoples in census results since then. _______________________________________________________________________________________ x ABS · A Picture of the Nation · 2070.0 · 2006
  • 8. Technical notes Secondly, the 1976 Census results are based on a sample of half of the forms received from private dwellings, which have been weighted to represent a full count of the population. This was done because of budgetary constraints introduced by the government at the time of processing the forms. Exceptions were in the Northern Territory, where all of the forms from private dwellings were processed, as well as all forms from non-private dwellings across Australia. In most cases, the classifications used to make comparisons over time are the same in each census year and the comparisons have been made with a high degree of certainty. In other cases, the classifications and/or processing methods have changed over time and the comparisons are less certain. Comparisons have only been made where the data have been assessed as fit for the purpose for which they are used: in some instances, changes over time have not been discussed because of the degree of uncertainty and change involved. Of particular note, the 2006 Census introduced new classifications for occupation and industry of employment: the Australian and New Zealand Standard Classification of Occupations (ANZSCO) and Australian and New Zealand Standard Industrial Classification 2006 (ANZSIC). For the 2006 Census, occupation and industry of employment data were dual coded to give users the option to use either the current classification or the previous classification (ASCO Second Edition or ANZSIC 1993, respectively). In this report, comparisons over time for these topics use the earlier classifications for the 2006 Census data. Totals—rounding and data perturbation Figures have been rounded in this report. Therefore, discrepancies may occur between the sums of the component items and totals. A range of methods has been used to protect the confidentiality of respondents when data are released from the census. This produces minor variations in the data that may result in totals not being equal in all tables and quoted numbers. Treatment of particular data items To be as consistent as possible with ERP figures (see previous page) and to minimise the effect of variations in the numbers of overseas visitors on time series data, all overseas visitors have been excluded from data used in the report, unless otherwise specified. Where classifications used included a ‘not stated’ category, data in this category have been excluded prior to the calculation of percentages—in effect, this has ‘distributed’ those results across the remaining categories. The only exception to this is for the Religious Affiliation classification, where ‘not stated’ is an accepted response. Total numbers for all classifications, including those shown alongside percentages, include the number of ‘not stated’ responses. Where the number of responses in a ‘not stated’ category may have had an impact on the information presented, this is noted in footnotes and in the text. In some instances, data have not been analysed because of large numbers of ‘not stated’ responses. Where classifications used included an ‘inadequately described’ or similar category, data in these categories were generally treated as a standard category—that is, they have not been distributed as for the ‘not stated’ categories described above. In the instances where it was necessary to do this, this is indicated in footnotes and in the text. _______________________________________________________________________________________ ABS · A Picture of the Nation · 2070.0 · 2006 xi
  • 9. Technical notes Symbols and usages The following symbols and usages mean: % per cent .. not applicable n.a. not available no. number $ dollar ‘000 thousand km2 square kilometre Abbreviations This report uses the following abbreviations. Australia, states and territories of Australia Aust. Australia NSW New South Wales Vic. Victoria Qld Queensland SA South Australia WA Western Australia Tas. Tasmania NT Northern Territory ACT Australian Capital Territory Other abbreviations ABS Australian Bureau of Statistics ABSCQ Australian Bureau of Statistics Classification of Qualifications AIFS Australian Institute of Family Studies AIHW Australian Institute of Health and Welfare ASCO Australian Standard Classification of Occupations ANZSCO Australian and New Zealand Standard Classification of Occupations ANZSIC Australian and New Zealand Standard Industrial Classification ASCED Australian Standard Classification of Education AST Australian Social Trends DEWR Department of Education, Employment and Workplace Relations DIAC Department of Immigration and Citizenship ERP Estimated Resident Population GPO General Post Office GSS General Social Survey HECS Higher Education Contribution Scheme LFS Labour Force Survey LGA Local Government Areas MCEETYA Ministerial Council on Education Employment Training and Youth Affairs MPHS Multi-Purpose Household Survey SARS Special Administrative Regions SD Statistical District SDAC Survey of Disability, Ageing and Carers SIH Survey of Income and Housing SLA Statistical Local Area SOLD Survey of Labour Demand SSD Statistical Subdivision TAFE Technical and Further Education UK United Kingdom _______________________________________________________________________________________ xii ABS · A Picture of the Nation · 2070.0 · 2006
  • 10. Overview 2 From generation to generation 9 Where do Australians live? 16 On the move 24
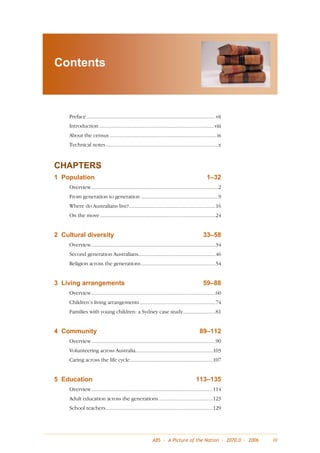
  • 11. Population overview In August 2006, the Census of Population and Population(a)(b)(c) 1906 to 2006 Housing counted 19.9 million people in Australia on Census Night. This figure provided million a base count from which the estimated 24 resident population (ERP) was derived (see 20 box below). After adjusting for undercount and 16 a number of other factors, Australia's ERP at 30 June 2006 was 20.7 million people. 12 8 Population growth 4 0 Between 2001 and 2006, Australia's resident 1906 1926 1946 1966 1986 2006 population increased by nearly 1.3 million people. Natural increase (excess of births over (a) Includes estimates of the Indigenous population from deaths) and net overseas migration each 1961 onwards. contributed about half of this growth (see (b) Prior to 1971, estimates of the population were Glossary for more information about these based on the number of people actually present in terms). Australia. From 1971 onwards the concept of estimated resident population (ERP) was introduced. Over the past 100 years Australia's population (c) Includes Other Territories from 1994. has increased steadily from 4.1 million in 1906 Source: Australian Historical Population Statistics, cat. to 20.7 million in 2006. The only exception to no. 3105.0.65.001. this steady growth occurred in 1916 and 1917 during World War I, when the population declined slightly. This was because defence force personnel leaving Australia were Estimating Australia's regarded as emigrants and excluded from population population counts.1 The estimated resident population (ERP) is Some of the highest annual population growth Australia's official population figure. It is rates were recorded in the period 1947–65, based on census counts of usual residents, known as the Baby Boom. Annual growth rates adjusted for undercount and the number over this period fluctuated between 1.6% and of Australian residents estimated to have 3.3% with natural increase the main been temporarily overseas at the time of component. High levels of immigration the census. Further adjustments are made following World War II also contributed to for births, deaths and net migration in the strong population growth in this period. period from 1 July to Census Night (i.e. Annual population growth rates then declined 8 August 2006) to estimate the population to a low of 1.0% in 1975 and have remained at at 30 June 2006. This chapter presents June between 1% and 2% since then. Between 2001 2006 ERP where available, and unadjusted and 2006, the annual growth rate fluctuated census counts from August 2006 where around 1.3%. more detailed information on population characteristics is needed. Later chapters only use unadjusted census counts. For more information on ERP see Australian Demographic Statistics, Dec 2007, ABS cat. no. 3101.0. _______________________________________________________________________________________ 2 ABS · A Picture of the Nation · 2070.0 · 2006
  • 12. Population…overview How the population grows The growth of Australia's population has two components: natural increase and net overseas migration. Natural increase refers to the excess of births over deaths. Net overseas migration is the net gain or loss of population through immigration to Australia and emigration from Australia. Population growth in the states and territories has a third component: net interstate migration. It refers to the difference between the number of persons who have changed their place of usual residence by moving into a given state or territory and the number who have changed their place of usual residence by moving out of that state or territory during a specified time period. Note that Urban Centres (see Glossary) with smaller populations may record high growth rates because the rates are calculated from a small base. States and territories (1.9%), the Northern Territory (2.2%) and the Australian Capital Territory (1.5%), although In 2006, New South Wales continued to be the the causes of growth differed. While natural most populous state (6.8 million residents) increase was an important component of followed by Victoria (5.1 million). Together growth in each of these states and territories, they were home to over half (58%) of Queensland was the only state to draw Australia's total population. Average annual substantial numbers from interstate migration. population growth in both states in the In Western Australia, high levels of net 25 years to 2006 was 1.1%, below the national overseas migration boosted population rate of 1.3%. growth, allowing it to overtake South Australia in size in the early 1980s. In the 5 years before the 2006 Census, the average annual growth was lower for New Both South Australia and Tasmania South Wales (0.7%) but higher for Victoria experienced low rates of growth in the 25 years (1.3%) than in preceding years. Net overseas to 2006. Losses due to interstate migration, migration and natural increase were the main primarily of young people, have resulted in components of growth rather than interstate older populations with lower proportions of migration. people of child-bearing age and subsequent low levels of natural increase. Between 1981 and 2006, average annual population growth was above the national rate in Queensland (2.3%), Western Australia Population growth and distribution(a) Change Change 1981– 2001– 2006 2006 2006(b) 2006(b) '000 % % % New South Wales 6 816.1 32.9 1.1 0.7 Victoria 5 126.5 24.8 1.1 1.3 Queensland 4 090.9 19.8 2.3 2.4 South Australia 1 567.9 7.6 0.7 0.7 Western Australia 2 059.4 9.9 1.9 1.6 Tasmania 490.0 2.4 0.5 0.8 Northern Territory 210.6 1.0 2.2 1.3 Australian Capital Territory 334.1 1.6 1.5 0.9 Australia 20 697.9 100.0 1.3 1.3 (a) Estimated Resident Population as at 30 June. (b) Average annual growth, see Glossary. Source: Australian Demographic Statistics, Dec 2007, cat. no. 3101.0. _______________________________________________________________________________________ ABS · A Picture of the Nation · 2070.0 · 2006 3
  • 13. Population…overview 20 largest Urban Centres(a) Change Change 1996– 1996– 2006 2006(b) 2006 2006(b) '000 % '000 % Sydney 3 794.8 1.1 Sunshine Coast(c) 197.6 4.3 Melbourne 3 517.6 1.6 Geelong 143.1 0.9 Brisbane 1 733.5 2.8 Townsville 137.5 2.2 Perth 1 322.7 1.5 Hobart 132.1 0.2 Adelaide 1 078.9 0.7 Cairns 105.4 2.6 Gold Coast-Tweed Heads 487.5 5.4 Toowoomba 101.6 1.6 Canberra-Queanbeyan 368.8 1.0 Ballarat 81.2 1.9 Newcastle 303.2 0.8 Bendigo 79.0 2.4 Central Coast (NSW) 289.2 2.0 Launceston 74.1 0.7 Wollongong 247.4 0.8 Darwin 71.9 0.7 Australia 20 697.9 1.2 (a) Estimated Resident Population as at 30 June. (b) Annual average growth, see Glossary. (c) Sunshine Coast only existed in its own right as a UCL area from the 2001 Census. For the 1996 Census, the Urban Centres in 2001 from the equivalent area have been used to represent the population at that time. Source: Regional Population Growth, Australia, 2005–06, cat. no. 3218.0. Urban Centres include Melbourne (1.6%), Perth (1.5%), the Central Coast of NSW (2.0%), Ballarat (1.9%) Most of Australia's population live in urban and Bendigo (2.4%). Of the 20 largest Urban areas. In 2006, just over two thirds (69%) of the Centres, Hobart experienced the lowest population lived in the 20 largest Urban average annual growth rate (0.2%). Centres and half the population lived in the 4 largest Urban Centres (Sydney, Melbourne, Brisbane and Perth). In the 10 years to 2006, Mobility population growth in Sydney (average annual In the five years prior to the 2006 Census, growth of 1.1%), did not keep pace with the 6.6 million people, or 43% of the population national average (1.2%). However, due to its aged 5 years and over, changed their place of large size, this city accommodated an residence in Australia. Of all the people who additional 400,000 people, or around one sixth moved within Australia during this period, the of Australia's population growth in this period. majority (86%) moved within the same state or territory while the remainder moved interstate. High rates of growth in Queensland's largest People aged 25–29 years were the most mobile Urban Centres contributed to a high rate of age group, with 62% having moved within growth in the state as a whole. Between 1996 Australia in the previous 5 years, while those and 2006, population growth in Brisbane, Gold aged 75–79 years were least likely to have Coast-Tweed Heads, Townsville and Cairns was moved (19%). There was little difference well above the national rate, with Gold Coast- recorded between the mobility rates of men Tweed Heads experiencing the highest average and women. annual growth rate of 5.4%. Over this period the Sunshine Coast evolved from a number of The mobility rate of immigrants is very high smaller settlements to become the country's after arrival and for the first decade of their eleventh largest Urban Centre with a residence in Australia, reflecting that population of 198,000 in 2006. Other large immigrants tend to move until they find a Urban Centres with high rates of growth suitable place to work and settle into their new _______________________________________________________________________________________ 4 ABS · A Picture of the Nation · 2070.0 · 2006
  • 14. Population…overview Mobility rates by birthplace, 2001–06(a) environment. Between 2001 and 2006, 60% of newly arrived migrants (who arrived in % Same SLA Australia in the 5 years to 2000) had moved 75 Other SLA, same SD residence compared to 42% of the Australian- Other SD, same state born population, and their mobility rates were Interstate 50 Total higher in almost every age group. However, over the longer term, the mobility rates of immigrants are lower on average than the 25 Australian-born population. 0 Australian born Recent arrivals(b) Total Population distribution overseas born(c) Australia's population is mostly concentrated in two widely separated coastal regions. The (a) Excludes children under 5 years of age in 2006 and larger of these by far (both in area and people who were overseas in 2001. population) lies in the east and south-east of (b) Who arrived in Australia between 1996 and 2000. Australia, stretching in a crescent from (c) Who arrived in Australia prior to 2001. Queensland through New South Wales, Victoria and Tasmania to South Australia. The smaller region is in the south-west of the continent and is concentrated around the Perth metropolitan area. Population density, Statistical Local Areas(a) Darwin Brisbane Perth Sydney People per sq km Adelaide Canberra 100.0 or more 10.0 – 100.0 Melbourne 1.0 – 10.0 0.1 – 1.0 Less than 0.1 Hobart 0 1000 Kilometres (a) Estimated Resident Population as at 30 June 2006. Source: Regional Population Growth, Australia, 2005–06, cat. no. 3218.0 _______________________________________________________________________________________ ABS · A Picture of the Nation · 2070.0 · 2006 5
  • 15. Population…overview In 2006, the vast majority of Australia's The age structure of Australia's population has population (85%) lived within 50 kilometres of changed considerably over the last century. the coastline, reflecting the arid, inhospitable During this time the proportion of children conditions of much of the Australian interior, aged under 15 years declined from 35% in 1901 as well as employment and lifestyle to 20% in 2006, while the proportion of older opportunities found in coastal areas and people aged 65 years and over increased from historical settlement patterns. The population 4% to 13%. These changes reflect: increased was also highly urbanised. In Australia, an life expectancy of infants in the earlier part of Urban Centre is defined as a population cluster the century, resulting in the survival of more of 1,000 or more people. At 30 June 2006, people into old age; declining fertility from the 18.3 million people, or 88% of the total 1970s; and improvements in life expectancy at Australian population were living in 730 Urban older ages in recent decades. Centres. The sex ratio is the number of males per one Age and sex structure hundred females. A sex ratio less than 100 indicates that there are fewer males than In June 2006 the median age of the Australian females. In 2006, Australia had an overall sex population was 37 years. One in five ratio of 99 males for every 100 females in the Australians (20%) were children aged under population. The sex ratio for children aged 15 years, and 13% were aged 65 years and over. 0–4 was 105, as male births consistently For most of the states and territories, the outnumber female births, and declined with proportion of the population in each of these age reflecting lower female death rates at all age groups varied only slightly. The Northern ages and the resultant higher life expectancy Territory had the highest proportion of of women. Among those aged 75 years and children aged under 15 years (25%) while over there were 523,200 males and 757,200 South Australia and Tasmania had the highest females, equating to a sex ratio of 69 males per proportions of older people aged 65 years and 100 females. over (both 15%). Age distribution(a) People People People Total aged aged aged 65 Median population 0–14 15–64 and over age '000 % % % years New South Wales 6 816.1 19.6 66.9 13.5 36.8 Victoria 5 126.5 19.0 67.6 13.4 36.7 Queensland 4 090.9 20.4 67.5 12.1 36.0 South Australia 1 567.9 18.3 66.6 15.1 38.8 Western Australia 2 059.4 19.9 68.3 11.8 36.2 Tasmania 490.0 19.7 65.7 14.6 38.8 Northern Territory 210.6 24.5 70.9 4.6 30.9 Australian Capital Territory 334.1 18.8 71.7 9.5 34.4 Australia 20 697.9 19.6 67.4 13.0 36.6 (a) Estimated resident population as at 30 June, 2006. Source: Population by Age and Sex, Australian States and Territories, Jun 2006, cat. no. 3201.0. _______________________________________________________________________________________ 6 ABS · A Picture of the Nation · 2070.0 · 2006
  • 16. Population…overview Population profile, selected years(a)(b) Age 85+ 80–84 1901 1956 2006 75–79 70–74 65–69 60–64 55–59 50–54 45–49 40–44 35–39 30–34 25–29 20–24 1 9 5–1 1 4 0–1 5–9 0–4 800 600 400 200 0 0 200 400 600 800 '000 Males Females (a) Data for 1901 are census counts; data for 1956 are population estimates; data for 2006 are estimated resident population. (b) In 2006, Christmas Island and Cocos (Keeling) Islands are included as part of Australia. Source: Australian Historical Population Statistics, cat. no. 3105.0.65.001. Indigenous population the state or territory with the highest proportion of Indigenous peoples in its total At 30 June 2006, the Aboriginal and Torres population (32%). Strait Islander population was estimated at 517,200, or 2.5% of the total Australian Indigenous Australians were more likely to live population. Two states, New South Wales in remote areas of the country than non- (29%) and Queensland (28%), contained over Indigenous Australians. Based on census half the Indigenous population. While a counts, around one in four Indigenous smaller proportion of all Indigenous peoples Australians (24%) lived in Remote or Very lived in the Northern Territory (13%), it was Remote areas in 2006 compared with only one in fifty non-Indigenous Australians (2%). Conversely, 32% of the Indigenous population lived in the Major Cities (see Glossary) Population by Remoteness Areas(a) compared to 69% of the non-Indigenous population. % Indigenous Birthplace 80 Non-Indigenous 60 In 2006, a quarter (25%) of Australia's 40 population was born overseas. This represents a slight increase in the proportion born 20 overseas since 1996 (23%). People born in North-West Europe (including the United 0 Kingdom) were the largest group of overseas- Major Inner Outer Remote Very born residents in 2006, accounting for 7% of all Cities Regional Regional Remote residents nationally, and almost a third of all overseas-born residents. Those born in (a) 2006 Census counts. Southern and Eastern Europe were the second _______________________________________________________________________________________ ABS · A Picture of the Nation · 2070.0 · 2006 7
  • 17. Population…overview largest group of overseas-born, comprising 4% of all residents nationally, followed by South- East Asia, accounting for 3% of the total population. Based on census counts, the overseas-born population was more likely to live in Urban Centres than those born in Australia. In 2006, 85% of the overseas-born were living in Major Cities, compared with 63% of Australian-born residents. Those migrants who arrived in the past two decades were more likely than other overseas-born people to live in large population centres, reflecting the settlement patterns of migrants to Australia. In 2006, 9 out of 10 migrants who had arrived in the preceding 20 years lived in Major Cities (90%) falling to around 8 in 10 of those who arrived in 1986 or before (81%). For more information on the overseas-born population, see the ‘Cultural diversity overview’, p. 34–44. Regions of birth of Australia’s population(a) % '000 Australian-born 75.4 15 608.1 Total overseas-born 24.6 5 093.4 Oceania and Antarctica(b) 2.7 567.7 North-West Europe 7.3 1 513.2 Southern and Eastern Europe 4.1 852.9 North Africa and the Middle East 1.4 295.4 South-East Asia 3.1 641.9 North-East Asia 2.3 470.1 Southern and Central Asia 1.6 322.0 Americas 1.0 210.0 Sub-Saharan Africa 1.1 220.2 Total 100.0 20 701.5 (a) 2006 Census counts. (b) Excluding Australia. Endnotes 1 Australian Bureau of Statistics 2003, Population growth and distribution, 2001, cat. no. 2035.0, p. 20–22, ABS, Canberra. _______________________________________________________________________________________ 8 ABS · A Picture of the Nation · 2070.0 · 2006
  • 18. From generation to generation Taking a generational view of the population great deal of individual variety occurs. provides a useful framework for analysing Therefore, where useful, generations have census data. Dividing the population into been further divided into smaller age groups to generations and looking at the different social highlight this diversity. and economic experiences they have had can help us to understand the changes that have occurred and continue to occur in Australian Oldest Generation the society. most likely to live alone In this report 5 cohorts are identified: the Born before 1927, the surviving members of Oldest Generation; the Lucky Generation; the this generation were aged 80 years and over in Baby Boomers; Generation X and Y; and the 2006 and comprised 4% of the total internet or iGeneration (see table below). This population. As young adults, the older article defines each generation, and briefly members of this birth cohort may have describes their social and economic history experienced interrupted employment and and current characteristics. These groups are family formation during the Great Depression. used in several articles throughout this report Many of the men would have served in the which provide more in-depth analysis of armed forces during World War II. Members of various aspects of the life experience of these the Oldest Generation had limited formal generations. While each generation shares educational opportunities: in 2006, 39% certain characteristics, it should be reported they left school at Year 8 or below or acknowledged that within each generation a never attended school compared to 2% of Generation X and Y. Defining the generations In defining the generations, a number of factors have been taken into account including birth rates, significant world events and shared life experiences. Each generation covers a similar sized age group (generally 20 years) to allow more meaningful comparisons across generations. For example, Generation X and Y, while separately identified by some social commentators, have many characteristics in common and have been combined to form a 20 year birth cohort. It should be noted that there is no widespread agreement about the names and definitions of these generations. Furthermore, the names adopted in this report have been used by other commentators to refer to slightly different groups. Summary of the generations Size of group Proportion of the Birth cohort Age in 2006 in 2006 population in 2006 years '000 % Oldest Generation 1891–1926 80 and over 727.3 3.7 Lucky Generation 1926–1946 60–79 2 875.1 14.5 Baby Boomers 1946–1966 40–59 5 468.8 27.5 Generation X and Y 1966–1986 20–39 5 489.9 27.6 iGeneration 1986–2006 0–19 5 294.1 26.7 _______________________________________________________________________________________ ABS · A Picture of the Nation · 2070.0 · 2006 9
  • 19. Population…From generation to generation Living arrangements and relationship in household Oldest Lucky Baby Generation Generation Generation Boomers X and Y iGeneration 80 and over 60–79 40–59 20–39 0–19 % % % % % In private dwellings Husband, wife or partner 30.3 61.0 68.0 48.9 0.5 Lone parent 5.3 3.4 7.4 5.0 0.1 Lone person 32.9 19.2 9.9 7.1 0.3 Group household member 1.1 1.8 2.0 7.3 0.7 Child 0.0 0.4 2.1 16.0 89.6 Other(a) 8.2 7.5 4.4 8.0 3.5 Total in private dwellings(b) 80.4 96.6 97.6 97.1 98.5 In non-private dwellings(c) 19.6 3.4 2.4 2.9 1.5 Total(d) 100.0 100.0 100.0 100.0 100.0 (a) Includes other related individuals, non-family members and visitors from within Australia. (b) Includes persons in non-classifiable households. (c) Includes persons living in hospitals, nursing homes, cared accommodation for the retired and aged, other welfare institutions and other non-private dwellings such as hotels and motels. (d) Excludes people counted in migratory, off-shore and shipping Collection Districts. In 2006, 33% of the Oldest Generation were because they generally perceive that they had living alone, the highest proportion of all an easier time than their parents. They didn't generations. A further 30% were living with live through World War I or have to make ends their husband, wife or partner while 17% were meet during the Depression, and as young living in nursing homes or cared adults they experienced full employment and accommodation for the retired or aged. Of prosperity during the post-World War II those living alone, more than 4 in 5 were economic boom. This generation has also been widowed. This generation reported the highest referred to as the Austerity Generation; rate of religious affiliation (82%) of all the affected by the privations resulting from the generations, with Anglican (30%) and Catholic Great Depression in their formative years, they (23%) the most commonly reported faiths. are often regarded as a hardworking and stoic generation who seek stability and security. The Lucky Generation retire Lucky Generation has been a relatively small group compared to successive generations, gradually partly due to low birth rates during the Depression and World War II and recent Born between 1926 and 1946, just prior to and deaths. during the Great Depression and World War II, they are referred to as the Lucky Generation Time line4 Cold War World War I World War II Korean War (1914–18) (1939–45) (1950–53) Strong economy Depression Strong economy Federation (1901) Snowy Sydney White Australia women get the Spanish flu polio epidemic Mountains Harbour Bridge Policy repealed vote (1902) epidemic (1919) (1938) scheme opened (1932) (1958) (1949) 1900 1910 1920 1930 1940 1950 Oldest Generation Lucky Generation Baby Boomers _______________________________________________________________________________________ 10 ABS · A Picture of the Nation · 2070.0 · 2006
  • 20. Population…From generation to generation Labour Force Status by generation Oldest Lucky Baby Generation Generation Generation Boomers X and Y iGeneration(a) 80 and over 60–79 40–59 20–39 15–19 % % % % % Males Employed full-time 1.7 18.2 68.0 66.5 17.7 Employed part-time 1.5 9.1 10.0 12.4 22.7 Unemployed 0.1 1.2 3.2 5.0 7.0 Not in the labour force 95.9 69.2 14.0 10.8 48.7 Total males(b) 100.0 100.0 100.0 100.0 100.0 Females Employed full-time 0.4 5.9 35.3 37.9 9.9 Employed part-time 0.5 8.7 30.5 27.1 33.7 Unemployed 0.1 0.4 2.8 4.2 6.8 Not in the labour force 98.6 83.5 27.3 26.0 45.5 Total females(b) 100.0 100.0 100.0 100.0 100.0 (a) Excludes those aged under 15 years. (b) Includes those employed but away from work during the reference period. This cohort also experienced higher rates of part-time. See ‘Generations of employment’, infectious diseases (such as polio, diphtheria p. 159–166, for a detailed analysis of the labour and rubella), cancer and heart disease during force experiences of each generation over time. their lifetime than subsequent generations.1 In 2006 the Lucky Generation were aged 60–79 In 2006, the Lucky Generation had the highest years and accounted for 14% of the total proportion of members born overseas (36% Australian population. By 2006 the majority had compared to 31%–32% for both the Oldest retired from employment. Nearly twice as many Generation and the Baby Boomers and 24% for men (30%) as women (16%) were employed, Generation X and Y). Contributing to the high reflecting the traditional breadwinner and proportion of overseas-born in this generation homemaker roles adopted by the majority of was the post World War II influx of European the Lucky Generation. Two thirds of those men migrants in the 1950s and 1960s: 12% of this employed were working full-time, while the generation were born in the UK or Ireland and majority of the employed women were working a further 11% in Southern and Eastern Europe (including 4% who were Italian-born). Time line4 Cold War Vietnam War Gulf War Iraq War (1962–73) (1990–91) Economic Strong economy Strong economy downturn Aborigines included no fault divorce post-war migration in the Census (1971) (1975) television (1956) credit cards computers internet mobile phones 1960 1970 1980 1990 2000 2005 Baby Boomers Generation X and Y iGeneration _______________________________________________________________________________________ ABS · A Picture of the Nation · 2070.0 · 2006 11
  • 21. Population…From generation to generation Registered marital status at 40–59 years Baby Boomers share breadwinning role % 100 Oldest Generation (1966) Lucky Generation (1986) In 2006 the Baby Boomers were aged 40–59 Baby Boomers (2006) 80 years. Born between 1946 and 1966 during the post-war economic boom, the Baby Boomers 60 were the second largest generation in 2006, 40 numbering 5.5 million or 28% of the total population. The size of this cohort can be 20 attributed to the high rates of marriage and 0 fertility, resulting from the catch up of Never Married Divorced Separated Widowed marriage and child-bearing delayed by World married War II, and the buoyant economy during their parents' child-bearing years. The influx of migrants to Australia following World War II also contributed to the size of this generation the norm. Just over two thirds of female Baby both directly (through the migration of Boomers were employed in 2006, while 20% children with their families) and indirectly stated they had a Bachelor degree or higher (through the migration of young adults who qualification. would later have Baby Boomer children). Of all the generations, the Baby Boomers had the This generation experienced increasing rates of largest overseas-born population (1.6 million marital separation resulting from the people) in 2006. However, the overseas-born introduction of 'no fault' divorce in 1975.2 In comprise a smaller proportion (32%) of this 2006, 19% of Baby Boomers were separated or generation than in the Lucky Generation (36%) divorced, nearly double the rate recorded for because they joined a large cohort of the previous generation: when the Lucky Australian-born Boomers. Generation were the same age (40–59 years) in 1986, 11% were separated or divorced. The older Baby Boomers entered the labour force when economic conditions were buoyant and experienced high rates of employment. Generation X and Y the The younger members of this generation have most highly qualified not had the same employment opportunities throughout their working lives as older Baby Born between 1966 and 1986, this generation Boomers, with many affected by the economic were aged 20–39 years in 2006. The older downturn in the late 1980s and early 1990s. members of this birth cohort have been dubbed Generation X for the perceived The Baby Boomer Generation has lived namelessness felt by the generation through enormous social change, experiencing overshadowed by the Baby Boomers who rising rates of female participation in both preceded them. Generation Y simply refers to tertiary education and the labour force, and the generation following X. With a combined the creation of the two income household as size similar to the Baby Boomers, Generation X and Y comprised 28% (5.5 million) of the total population in 2006. Higher education qualifications by Generation X and Y were the first generation generation(a) to experience increased rates of parental separation and divorce. They are also regarded % as having fewer opportunities than their Baby Men 30 Women Boomer predecessors, being the first to experience user-pays higher education and job 20 insecurity.3 When Generation X and Y were entering the workforce, unemployment levels were high. For example in 1991, 15% of 10 Generation X and Y men who were of working age (15–24 years) were unemployed. In 0 contrast, Baby Boomers started entering the Gen X & Y Baby Lucky Oldest workforce in the late 1960s when Boomers Generation Generation unemployment levels were very low. By 1971, only 2% of working age Baby Boomer men (a) Includes Bachelor degree, Graduate diploma, (then aged 15–24 years) were unemployed. Graduate certificate, Master degree and Doctoral degree. _______________________________________________________________________________________ 12 ABS · A Picture of the Nation · 2070.0 · 2006
  • 22. Population…From generation to generation Unemployment experiences of the (49%) were living with a spouse or partner. A generations(a) further 7% were living in group households while 7% were living alone. Men Gen X & Y % iGeneration live up to 15 Baby Boomers Lucky Generation their name 10 Born between 1986 and 2006, the iGeneration (Internet Generation) spent their formative years in a period which saw the birth and rise 5 of the internet. Aged 0–19 years in 2006, they take computers and the internet and a host of 0 electronic consumables, such as DVDs, mobile 1966 1971 1976 1981 1986 1991 1996 2001 2006 phones and MP3 players for granted. Uptake of technology by the iGeneration is reflected in their rates of internet access. In 2006, 80% of the youngest generation had access to the Women internet at home with just over two thirds of this group having access to a broadband % connection. Access was also high among Baby Gen X & Y Baby Boomers 15 Boomers (76%) and Generation X and Y (75%), Lucky Generation many of whom have their iGeneration children 10 living with them at home. Despite the gradual increase in one parent 5 families, the majority of iGens in private households were living with their couple 0 parents in 2006 (77%). Twenty years earlier in 1966 1971 1976 1981 1986 1991 1996 2001 2006 1986, 85% of 0–19 year olds (Generation X and Y) were living with couple parents. For iGens living in couple families, around 9 out of 10 (a) Proportion of all men or women in each generation aged 15 years and over at the time of each census who were the natural or adopted child of both were unemployed. parents. The iGeneration, along with Generation X and The unemployment pattern was similar for Y, are the most secular generations, with women. Lower levels of unemployment almost one in four reporting no religion in experienced by Lucky Generation women 2006. Of the other generations, those partly reflect lower levels of labour force reporting no religion ranged from 6% of the participation by women of that generation with Oldest Generation to 17% of Baby Boomers. fewer women seeking employment than in See ‘Religion across the generations’, p. 54–58, later generations. for more information. Despite the introduction of the Higher Education Contribution Scheme (HECS), Generation X and Y are the most highly Internet access by generation(a) educated generation on record, with one in four having a Bachelor degree or above in % Broadband 2006. In each successive generation, the 80 Other proportion of women who obtained higher Total 60 education qualifications has increased relative to that of their male counterparts. In 2006, 28% 40 of Generation X and Y women had a Bachelor degree or above compared with 21% of 20 Generation X and Y men. 0 Spanning people in their early 20s to late 30s, Oldest Lucky Baby Gen iGeneration Generation Generation Boomers X&Y Generation X and Y were represented more broadly across the different living arrangements than other generations in 2006. (a) Usual residents living in private dwellings only. While 16% were living with parents, almost half _______________________________________________________________________________________ ABS · A Picture of the Nation · 2070.0 · 2006 13
  • 23. Population…From generation to generation iGeneration aged 15–19: employment and education participation Studying(a) Not Full-time Part-time Total studying Total(b) % % % % % Employed Full-time 0.5 3.1 3.7 9.9 13.9 Part-time 21.2 1.2 22.5 5.4 28.1 Total employed(c) 24.1 4.6 28.9 16.6 46.0 Not employed 44.9 1.2 46.4 7.1 54.0 Total(d) 69.3 5.9 74.8 25.2 100.0 (a) At secondary school, TAFE college, university or other educational institution. Total includes students who did not state full-time or part-time study status. (b) Includes people who did not state attendance at an educational institution. (c) Includes people who were employed and away from work. (d) Includes people who did not state labour force status. In 2006 the oldest members of the iGeneration were in their mid to late teens (aged 15–19 Endnotes years). The majority (75%) were students, with 1 Australian Bureau of Statistics (ABS) 2006, nearly three quarters of these attending Measures of Australia's Progress, cat. no. 1370.0, p. secondary school and the remainder attending 33, ABS, Canberra. a TAFE college, university or other tertiary institution. Nearly half (46%) of all 15–19 year 2 ABS 1994, ‘Changes in living arrangements’, in old members of the iGeneration were Australian Social Trends 1994, cat. no. 4102.0, ABS, Canberra. employed in 2006 compared to 42% of 15–19 year old members of Generation X and Y in 3 Baum, N. and Jackson, N. 2004, Planning the local 1986 and 62% of 15–19 year old Baby Boomers government response to ageing and place, Local in 1966. In 2006, many 15–19 year old iGens Government Association of NSW and Shires were combining work and study (29%), and of Association of NSW, Sydney. these, the overwhelming majority were studying full-time while working in a part-time 4 Australian Government 2007, Guide to the job. Teaching of Australian History in Years 9 and 10. _______________________________________________________________________________________ 14 ABS · A Picture of the Nation · 2070.0 · 2006
  • 24. Where do Australians live? A person's wellbeing is closely linked to where they live. Location largely determines the range of opportunities, and goods and services In 2006, three quarters of available to satisfy an individual's needs and the population were in lifestyle. Because people's needs vary they will settle in different places, seeking out a location coastal towns and cities. which they can afford and that provides the best mix of opportunities, and goods and services for them and their family. From the bush to the For people with children, one area might be coast attractive because it provides access to the support and care provided by other family and Over time, changes have occurred in the friends. Some locations might be important to opportunities, such as employment, and goods a person’s identity, allowing for the expression and services, such as health facilities, that many or development of particular cultural facets of areas traditionally provided. Further, people's a person's life; for example, traditional lands idea of what is desirable has changed, for Aboriginal and Torres Strait Islander including an expectation of having a broader peoples. Other places might offer particular range of options available. This has brought educational opportunities, or provide about a shift in Australia's settlement pattern enhanced employment and promotional from one that was strongly rural at Federation prospects in a chosen field. Other areas might (in 1901) to one currently dominated by urban be attractive for their environment—located coastal settlement. close to the ocean, or away from crowding and pollution. In others, access to specialist At the 1911 Census, the main focus of the medical services may be important for people Australian economy was primary production with a serious illness. and 42% of the population were living in Rural Areas. This strong rural settlement pattern Areas that have a range of the most popular came about because of the settlement of opportunities, and goods and services often inland areas primarily for agricultural use and have expensive housing because many other the large amount of employment created by people seek to live there. For many people, the labour intensive farming practices of the compromises must be made between day. Other factors encouraging rural affordability and the distance travelled to settlement were the population dispersal access these opportunities, and goods and caused by the gold rushes, the development of services. The result of the decisions and other mining industries, and the establishment compromises made by all Australians is a of road and rail infrastructure in these areas. settlement pattern, but one which has been dynamic over time—changing with shifts in By 2006, only 12% of Australians were located individual and family needs and preferences, in Rural Areas, while just over three quarters the ability of particular locations to meet those (77%) were in towns and cities of over 1,000 needs and preferences, and the relative people within 50 km of the coast. This pattern income and wealth of individuals and families. reflects the attraction of coastal environments _______________________________________________________________________________________ 16 ABS · A Picture of the Nation · 2070.0 · 2006
  • 25. Population…Where do Australians live? Population(a) of Urban Centres and Rural Localities, Australia(b), 2006 Darwin Brisbane Perth Sydney Adelaide Canberra Population Melbourne 1,000,000 500,000 100,000 Hobart 0 1000 Kilometres (a) Population is census count on a place of enumeration basis. (b) Excludes Cocos (Keeling) and Christmas Islands. to contemporary Australians, but perhaps more importantly it highlights the fact that the Increasing urbanisation large coastal towns and cities are now the Over the past century, while remaining centres of employment and provide many sparsely settled, Australia has emerged as a other desirable opportunities, and goods and highly urbanised nation. Over this period, services. there has been a consistent, general trend for a greater proportion of the population to live in While the desire to live in these towns and Australia's cities and towns. Over the 30 years cities are driven by contemporary preferences, prior to the 2006 Census, the relative the concentration of these towns and cities importance of the Metropolitan Urban areas along the coast to a large degree reflects (that is, the state capitals, and Canberra from Australia's colonial history. Sites of the colonial 1954) has generally declined, while the coastal capitals and penal settlements required access population centres, especially those near these to coastal anchorages, adequate supplies of cities, have increased their share of the fresh water and land with good agricultural population. potential, fixing the location of many current Australian towns and cities on or near the coast. _______________________________________________________________________________________ ABS · A Picture of the Nation · 2070.0 · 2006 17
  • 26. Population…Where do Australians live? Classification of urban and rural areas An area is classified as urban or rural according to the level of population density and the type of land use. Across censuses the size of urban areas generally increases as the number of people in these areas grows. This occurs as land that was previously classified as rural is developed to house the population or to be used for purposes that are urban in nature (for example, roads, shopping centres and airports). This reduces, by a relatively small amount, the area of land that is classed as rural. For the first part of this article, Australia is divided into urban and rural areas according to the Urban Divisions classification used in Statistician's Reports between 1921 and 1966, along with corresponding areas back to the 1901 Census. From the 1976 Census onwards, a close approximation to this classification has been made using the Urban Centre and Locality, and Section of State classifications, allowing comparison with statistics from the earlier censuses. It should be noted that the areas of most cities and towns have expanded as population has increased, and some cities and towns included separately in earlier censuses have been joined into the urban area of larger cities in later censuses (for example, Ipswich into Brisbane). Where data from the 1976–2006 censuses are presented separately, the Urban Centre and Locality and Section of State classifications are used as described in the text. For further information on these classifications please see Statistical Geography: Volume 1—Australian Standard Geographical Classification (ASGC), 2006, ABS cat. no. 1216.0. Urban Divisions classification Metropolitan Urban include the capital cities, and surrounding suburbs, of Sydney, Melbourne, Brisbane, Adelaide, Perth and Hobart, with Canberra included from 1954. The Urban Centres corresponding to these capitals, from the Urban Centre and Locality classification, make up this category from 1971 onwards. Other Urban include the remaining incorporated towns and cities (including Darwin) and, from 1954, other towns that contained 1,000 or more people (750 for Tasmania until 1966) at the time of each census. The change to the towns and cities included in Other Urban between the 1947 and 1954 Censuses prevent comparison of the Other Urban and Rural Areas categories across these two censuses. From 1971 onwards, Urban Centres of 1,000 persons or more are used for this category. Rural Areas are the balance of the Australian population, including towns (or localities) not included in Other Urban above, and the migratory population. Where these categories of Urban Division are used in the text of this article they are capitalised. Where the words are not capitalised their use has a more general meaning. Population counts in urban and rural areas In this article populations in urban and rural areas are examined back as far as the 1901 Census. Data from these early censuses are only available on a place of enumeration basis, and so data on this basis are used for all censuses years examined. As Cocos (Keeling) Islands and Christmas Island were only included from the 1996 Census, the Other Territories category has been excluded from the analysis and the figures used in this article, including total Australia populations. This ensures figures are as comparable as possible. _______________________________________________________________________________________ 18 ABS · A Picture of the Nation · 2070.0 · 2006