SlideShare uma empresa Scribd logo
1 de 150
Baixar para ler offline
Traders World Magazine
In cooperation with Prognosis Software Development


         Some parts of this book are copyrighted
          to Prognosis Software Development
Copyright 2001 by Halliker’s, Inc., dba Traders World

No part of this publication may be reproduced, stored in a retrieval system or transmitted
in any form or by any means, electronic, mechanical, photocopying, recording, scanning or
otherwise, except as permitted under Sections 107 or 108 of the 1976 United Stated
Copyright Act, without either the prior written permission of the Publisher, or authorization
through payment of the appropriate per-copy fee to the Copyright Clearance Center, 222
Rosewood Drive, Danvers, MA 01923, (978) 750-8400, fax (978) 750-4744. Requests to
the Publisher for permission should be addressed to the Permissions Department,
Halliker’s, Inc. 2508 W. Grayrock St, Springfield, MO 65810. (417) 882-9697, Fax
(417)886-5180. E-Mail: publisher@tradersworld.com

Parts of this book came from the ELWAVE software manual produced by Prognosis
Software Development. This publication is written to provide accurate information in regard
to the subject matter covered. It is sold with the understanding that the publisher is not
engaged in rendering professional services. If professional advice or other expert
assistance is required, the services of a competent professional person should be sought.

To receive a password for the Internet Support Site for the Book via E-Mail:

publisher@tradersworld.com
CAVEAT: It should be noted that all commodity trades, patterns, charts, systems, etc.,
discussed in this book are for illustrative purposes only and are not to be considered as
specific advisory recommendations. Further note that no method of trading or investing
is foolproof or without difficulty, and past performance is no guarantee of future
performance. All ideas and material presented are entirely those of the author and do
not reflect those of the publisher or bookseller.

Library of Congress Cataloging-in-Publication Data:


Printed in the United States of America


                                           2
Introduction
R.N. Elliott developed Elliott Wave Theory in the 1920’s. Mr. Elliott
discovered there is no chaos in the markets, but on the contrary this is a
natural order in the markets that manifests it self in wave patterns, which
continually repeat themselves. These wave patterns continually repeat
themselves over and over again in the markets. The wave patterns are also
fractal in nature, which means that you can subdivide these waves into
smaller and smaller waves and they was have the same pattern, just a
different degree.
In the 1970’s the Elliott Wave Principal was extremely popular because of
books published by Prechter and Frost. The most famous book they
published was “The Elliott Wave Principle…key to stock market profits” in
1978. Robert Prechter was extremely popular and was frequently
interviewed by the news media during the time. He predicted the bull
market of the time and even the crash of 1987.
The secret of the Elliott Wave Theory is to learn how to correctly detect
these wave patterns that tend to occur over and over again in the markets.
These wave patterns can be divided into basically two kinds, the trending
wave and the non-trending wave. Some people call them impulse waves
and corrective waves. The markets tend to trend only 20% of the time and
they go into corrections 80% of the time.
The impulse wave has five price movements. Three of them are in the
direction of the market and two of them are in the opposite direction of the
market. See Fig. 1.


Fig. 1


                                    3
These five waves can also be broken down into smaller waves. Each
impulse wave has five waves and each correction has 3 waves. See Fig. 2.


Fig. 2
The corrective waves can also be broken down into a smaller degree.
Waves A and C are in the direction of the reaction. This would illustrate the
reaction in a bullish trend. See Fig. 3.


Fig. 3


                                    4
It should be very easy now to distinguish between the trends of the market
and the corrections. See Fig 4. Also it’s important to understand the
concept that the wave structure of the large degree is composed of the
same wave structure in the smaller degree.


Fig. 4


                                   5
The following are the wave degrees the most Elliott Wave Technicians
follow:


You must remember that the possible number of wave degrees is infinite.
You can only trade so many waves down. The smallest detectable wave
pattern would be using a 1 minute bar chart. The advantage of having
different degrees of waves is that you can trade the degree that you are
most comfortable with. Day-traders might trade the Sub Minuette Wave
Degree and intermediate investors might use the Primary Wave Degree to
trade.


                                  6
Patterns
Recognizing the patterns of the waves as they are developing is the most
important thing you can do. Many Elliott Wave technicians can correctly
analyze a completed chart with the correct patterns, but what good does
that do. You need to do it as it is happening. You can correctly determine
the where you are in the Elliott Wave pattern, as it is unfolding, it will tell
you the levels the market will rise or fall to. That’s the importance of the
Elliott Wave theory.
The unique software ELWAVE gives you the Elliott Wave patterns
automatically so you can better trade the markets.

Classic Patterns vs. Modern Elliott Wave Patterns
There are two versions of the Elliott Wave Theory. One is the classic
version brought out by Elliott and the modern version that Prognosis
Software Development found after 10 years of research and experience.
You will have to experiment which each of the markets to determine which
set of patterns to use. The ELWAVE software program makes it easy to do.
You can select which to use with just a click of the mouse button.
Now let’s look at the various Elliott Wave Patterns in a very strict manner
according to the rules followed by Elliott Wave technicians:


                                      7
Trends
   a. Impulse

Pattern


Fig. 5
Description
Impulse waves are composed of five waves labeled 1,2,3,4,5.
Waves 1, 3, 5 are themselves impulse waves.
Waves 1, 3, 5 are usually equal in length.
Waves 2 and 4 are corrective waves.
Rules and Guidelines
Wave 2 cannot be longer in price than wave 1.
It can’t go beyond the origin of wave 1.
Wave 3 is never the shortest when compared to waves 1 and 5.
Wave 4 cannot overlap wave 1. Exception, diagonal triangles.
The third wave usually shows the highest momentum.
Exception, when the fifth wave is the extended wave.

In Which Wave
Impulse patterns occur in wave 1, 3, 5 and waves A and C

Internal Structure
Composed of five waves 5-3-5-3-5


                                   8
Trends
   b. Extension
Pattern


Fig. 6
Description
An extension occurs in a impulse wave.
It can be wave 1, 3, or 5
Usually one of these waves is extended.
Normally the third wave is the extended wave.
The other two waves are normally equal in length.

Rules
Extended waves are composed of 5, 9, 13 or 17 waves.
Wave 2 can’t be long in price distance than wave 1.
Wave 3 is never the shortest when compared to wave 1 and 5.
Wave 4 can’t overlap wave 1.
Wave 5 exceeds the end of wave 3.
The extended wave normally shows the highest acceleration.

In Which Wave
Extensions occur in wave 1, 3, 5 and in A and C waves.


Internal Structure
Minimum number of waves of an extended wave is 9, 13 or 17.
Minimum internal structure of 9 waves is 5-3-5-3-5-3-5-3-5.


                                   9
Trends
   c. Diagonal Triangle Type 1
Pattern


Fig. 7

Description
Diagonals are impulse patterns.
They occur in terminal waves like fifth or a C wave.
Diagonals are relatively rare.
They occur a lot in lower wave degree charts.
Usually they are followed by a violent change.
Rules and Guidelines
It is composed of 5 waves.
Waves 4 and 1 do overlap.
Wave 4 can’t go beyond the origin of wave 3.
Wave 3 can’t be the shortest wave.
Internally all waves of the diagonal have a corrective structure.
Wave 1 is the longest wave and wave 5 the shortest.
The Channel lines of Diagonals must converge
The internal wave structure should show alternation.


                                    10
In Which Wave
Diagonal triangles type 2 occur in waves 1 and A.
Internal Structure
The five waves of the diagonal type 2 show an internal structure of 5-3-5-3-
5.

Trends
                            th
   d. Failure or Truncated 5

Pattern


Fig. 8

Description
Impulse wave in which the fifth doesn’t extend beyond the third.
Fifth wave goes only slightly beyond the third wave.
Classified as a failure wave.

Trend is week and will accelerate in opposite direction.


Rules and Guidelines
Wave 2 can’t be longer in price than wave 1.
Wave 2 can’t go beyond the origin of wave1.
Wave 4 can’t overlap wave 1 or A.
Wave 5 fails to go beyond the end of wave 3.
Wave 3 shows the highest momentum.
Internal wave structure should show alternation.

Internal Structure
It must be composed of five waves.


                                    11
Corrections
  a. Zigzag
Pattern


Fig. 9

Description
The most common corrective wave structure.
Begins with a sharp reversal.
It looks like an impulsive wave
Can extend into a double or triple zigzag. (not common)

Rules and Guidelines
Composed of 3 waves
Wave A and C are impulses, Wave B is corrective.
The B wave retraces no more than 61.8% of A
The C wave must go beyond the end of A
The C wave normally is at least equal to A

In Which Wave
Most of time it happens in A, X or 2.
Also common in B waves or part of a Flat or Triangles or in 4.

Internal Structure
Internal structure of the 3 waves is 5-3-5 in a single Zigzag, 5-3-5-3-5-3-5 in
a double.


                                    12
Corrections
    Example of a Double Zigzag


Fig. 10

The above is a modern representation of the Double Zigzag using the
labels WXY instead of ABCXABC. This is more consistent because this
way 2 zigzags of lower degree get corrected to each other by waves of
higher degree.


                                 13
Corrections
  b. Flat
Pattern


Fig. 11
Description
Flats are very common form of correction patterns.
Shows sideways direction.
Waves A and B of the Flat are both corrective patterns.
Wave C is an impulse pattern.
Normally eave C will not go far beyond the end of wave A.


Rules and Guidelines
It is composed of 3 waves.
Wave C is an impulse, Wave A and B are corrective.
Wave B retraces more than 61.8% of A
Wave B shows a common retracement to the end of previous wave.
Wave C shouldn’t go far beyond the end of A
Normally wave C is at least equal to A.


In Which Wave
It occurs mostly in B waves, also common in 4 and 2.
Internal Structure
The internal structure of these waves is 3-3-5. Both waves A and B are
normally Zigzags.


                                  14
Corrections
  c. Expanded Flat or Irregular Flat


Fig. 12
Description
This is a common special type of a Flat.
B wave is extended and goes beyond the end of the previous wave.
The B wave has a lot of strength and shows the direction of B.
Strong acceleration is present which starts the 3rd or 5th wave.
If C wave is much longer than A, the strength will be less.


Rules and Guidelines
It is composed of 3 waves.
Wave C is an impulse, wave A and B are corrective.
Wave B retraces beyond the end of the previous impulse wave A.
The C wave normally is much longer than A.


In Which Wave
Can happen in 2, 4, B and X. It can happen in 2 and C is relatively short,
normally an acceleration in the third will take place.
Internal Structure
Composed of five waves, which has a structure of 3-3-5-5.


                                    15
Corrections
  d. Triangles (Contracting)
Pattern


Fig. 13
Description
A triangle is a corrective pattern, which can contract or expand.
It can ascend or descent.
It is composed of five waves; each of them has a corrective nature.
Rules and Guidelines
It is composed of 5 waves.
Wave 4 and 1 do not overlap.
Wave 4 can’t go beyond the origin of wave 3
Internally all waves have a corrective wave structure.
Wave 1 is the longest wave and wave 5 is the shortest.

In Which Wave
Triangles occur in wave B, X and 4, never in wave 2 or A.
Internal Structure
It is composed of fives waves, internal structure 3-3-3-3-3.


                                    16
Corrections
  Expanding Triangle
Pattern


Fig. 14


Ascending Triangle
This triangle slopes upwards.
This pattern has been implements in Modern Rules.


Descending Triangle
This is a triangle, which slopes downwards.
This pattern has been implemented in modern rules.
Running Triangle
This is a triangle where the B wave exceeds the origin of wave A.


                                   17
Corrections
  e. WXY or Combination

Pattern


Fig. 15
Description
Combines several types of corrections.
Labeled WXY and WXYXZ.

Rules and Guidelines
Forms small patterns to make a larger one.
The triangle should normally appear at the end.


In Which Way
Generally a combination occurs mostly in B, X and 4.
Less common in A and rare in 2.
Internal Structure
A Zigzag followed by a flat, followed by a Triangle has the following internal
structure. 5-3-5 (Zigzag)-5-3-3-5


                                    18
Corrections
  f. Running Flat
Pattern


Fig. 16

Description
Rare form of a failure.
Kind of a Flat with elongated B wave and very small C wave.
ELWAVE doesn’t accept a C wave that fails to reach wave A.
This could be an extension in an impulse wave.
If B is a clear three wave, then it is a running correction.
The market will explode in the direction of the B wave.

Rules and Guidelines
The B wave must be composed of three waves.
The C wave must be composed of five waves.
Wave C must be very short and not reach wave A.
Wave C must retrace less than 100% of wave B.
Wave C must retrace more than 60% of wave A.

In Which Wave
Most of the time it should occur in wave 2 or B.


Internal Structure
It is a three-wave structure 3-3-5.


                                      19
Modern Elliott Wave Patterns
In the Modern Rules ELWAVE engine the program has defined extra
pattern that are mostly hybrid patterns derived from the known patterns that
have existed from the beginning. In addition the program allows for
occurrence of more patterns in some wave. For example, wave 1 may also
contain a diagonal 1, diagonal 2 and impulse 2 pattern, next to the other
trend patterns, that a classic interpretation accepts.


                                   20
Trends
   a. Impulse 2


Fig. 17
Description
An impulse 2 is an uncommon pattern.
ELWAVE allows for a maximum retrace of 51.5% for wave 4.
Sometimes the retrace of wave 4 could be 51.6%.


Rules and Guidelines
The same rules and guidelines apply as with a normal impulse except for
the following:
Wave 4 is allowed to retrace in between 51.5% and 62%.
Must not penetrate the region of wave 1.
As a guideline, wave 4 very often is a Zigzag.

In Which Wave
Impulse 2 patterns occur in wave 1, A or C, never in wave 3.
Internal Structure
It is composed of five waves 5-3-5-3-5.
The mentioned 3’s are corrective waves.


                                   21
Corrections
  Impulse 2


Fig. 18

Description
Apart from contracting triangles, a failure in a corrective pattern happens
when the C wave is shorter than wave A and fails to go beyond the end of
A.
Happens in running flats or in zigzags.
Indicated strength in the direction of the main trend.

Rules and Guidelines
The rules as mentioned with other corrective patterns apply.
Wave C fails to go beyond the end of wave A.
In Which Wave
Failures can occur in a C wave 2, in a C or E wave of 4 in a C wave of B or
X.


                                   22
Corrections
  b. Failed Flat

Pattern


Fig. 19

Description
This pattern is exactly the same as a Flat, except for the fact the wave C
does not reach the end of wave A and therefore is shorter than wave B.


                                    23
Corrections
  c. Running Flat (modern)
Pattern


Fig. 20


Description
This pattern is exactly the same as a Running Flat, except for the fact that it
must retrace more than 60%, of not ELWAVE considers it to be a normal
Running Flat. This distinction is necessary, because normally a Running
Flat is rare. But if it retraces more than 60% and still fails to race the end of
wave A, it suddenly becomes a much more probable pattern to occur. In
that case it will get a much higher score.


                                     24
Channeling
This is an important tool to determine which subwaves belong together and
to project targets for the next wave up.
Channels are parallel lines, which contain complete price moves.
Trendlines of triangles are also considered a channel.
The following is an example of a channel in impulse wave and a channel in
corrective waves.


Fig. 21

Waves of the same degree can be recognized by drawing channels.
Especially this is the case for Impulse (5) wave structures, Zigzags and
Triangles. If these waves do not fit properly, you have a strong indication to
search for an alternative count.


                                    25
Targets for Wave 3 or C
To begin with you can draw a channel as soon as wave 1 and 2 are
finished. Connect the origin of wave 1, which has been labeled as zero,
and the end of wave 2. then draw a parallel line from the top of wave 1.
Generally this channel is regarded as not being very useful, but it is, First of
all the parallel line services as a absolute minimum target for the 3rd wave
under development. If the 3rd wave can’t break through the upper line or
fails to reach it, you are probably dealing with a C wave instead of wave 3.
Furthermore the base line from 0 to wave 2 serves as a stop. When this
base line gets broken, there is a strong probability that wave 2 (or B) gets
more complex, thus wave 3 or C has not begun yet.
Keep in mind that wave 3 is normally the strongest wave and often will go
far beyond the upper trend line.


Fig. 22


                                     26
Targets for Wave 4
As soon as wave 3 has finished you can draw a channel connecting the
end of wave 1 and wave 3 with a trend line and drawing a parallel line from
the end of wave 2. by Doing this you can project a target for wave 4. Keep
in mind that normally the base line from wave 3 will be broken slightly by
the price action of wave 4. If wave 4 doesn’t come near the base line at all
this is a sign of a very strong trend. You are probably still in wave 3 or your
should get ready to a blow off in wave 5.


Fig. 23


                                     27
Targets for Wave 5

Method 1
As soon as wave 4 has finished you can draw a channel connecting the
end of wave 2 and wave 4 with a trend line and draw a parallel line from the
end of wave 3 and project upward to wave 5. This is your target for wave 5.
This would be for a normal wave 5. An extended wave 5 would push
higher. It the price fails to hit the projected trend line to wave 5 then the
market is weak and you should look for a sell off.


Fig. 24


                                   28
Targets for Wave 5

Method 2
Mostly wave 3 is the strongest wave showing a very fast acceleration
relative to wave 1 and 5. If wave 3 indeed shows a nearly vertical rise or
decline, then draw a trend line-connecting wave 2 and 4 and draw a
parallel line from wave 1. This parallel line will cut through wave 3 and will
target wave 5. Experience shows this is a very valuable channel.


Fig. 25


                                     29
Targets for Wave D and E
As soon as wave B has finished you can draw a trend line connecting the
origin of wave A and the end of wave B to get a target for wave D, provided
a triangle indeed is developing, which is more certain after completion of
wave C.
As soon as wave C has finished you can craw a trend line connecting wave
A and the end of wave C to get a target for wave E almost never stops at
the trend line precisely, it either never reaches the trend line or it
overshoots the trend line fast and temporarily.


Fig. 26


                                   30
Targets in a Double Zigzag
Drawing a channel is very useful to separate Double Zigzags from
impulsive waves, which is difficult since both have impulsive
characteristics.
Double Zigzags tend to fit a channel almost perfect, while in an impulsive
wave the third wave clearly breaks out of the channel.


Fig. 27


                                   31
Fibonacci Ratios
The Fibonacci series are a mathematical sequence in which any number is
the sum of the two preceding numbers.
The sequence goes as follows: 1, 2, 3, 5, 8, 13, 21, 34, 55, 89, 144 and so
on.
The properties of this sequence appear throughout nature and in the arts
and science. Most notable is the ratio of 1.618 which is called the “Golden
Mean”. It was discovered even in ancient times. The number can be
approached by dividing a Fibonacci number by its preceding number as the
sequence extends into infinity. The ratio of .618 is also very prominent
when analyzing Fibonacci relationships.
The wave counts of the impulse and corrective patterns 5 + 3 = 8 are
Fibonacci numbers.
Analyzing Fibonacci relationships between price movements is important
for several reasons:
   1) You can control your wave analysis.
   2) The better the Fibonacci ratios of your wave count, the more
       accurate your count is, because in some way or the other all waves
       are related to each other.
   3) You can project realistic targets once you have distinguished
       different scenarios, which point in the same direction.
   4) Since Fibonacci manifests itself in the proportions of one wave to
       another, waves are often related to each other by the ratios of 2.618,
       1.618, 1, 0.618, 0.382 and 0.236. This fact can help you in
       estimating price targets for expected waves. If , for example a wave
       1 or A of any degree has been completed, you can project
       retracements of 0.382, 0.50 and .618 for wave 2 or B, which will give
       you your targets.
   5) Most of the time the third wave is the strongest, so often you will find
       that wave 3 is approximately 1.618 times wave 1.
   6) Wave 4 normally shows a retracement, which is less than wave 2,
       like 0.236 or 0.382. If wave three is the longest wave, the
       relationship between wave 5 and three often is 0.618.
   7) Also wave 5 equals wave 1 most of the time.
   8) The same relationship can be found between A and C waves.
       Normally C equals A or is 1.618 times the length of A.
   9) You can even combine waves to find support and resistance zones.
       For example the next price movement of wave 1 and 3 times 0.618
       creates another interesting target for wave 5.
   10) It is worthwhile to experiment a lot with your wave count, Fibonacci
       will help you to solve the rhythm of the markets.


                                    32
Targets
Wave 1
The first wave of a new impulsive price movement tends to stop at the base
of the previous correction, which is the B wave. The often coincides with a
38.2% or a 61.8% retracement of the previous correction.
Wave 2
Wave 2 minimally retraces 38.2% and mostly 61.8% or more of wave 1. It
often stops at subwave 4 and more often at subwave 2 of previous wave 1.
A retrace of more than 76% is highly suspicious, although it doesn’t break
any rules yet.

Wave 3
Wave 3 minimally is equal to wave 1, except for a
Triangle. If wave 3 is the longest wave it will tend to be
161% of wave 1 or even 26l%.

Wave 4
Wave 4 minimally retraces 23% of wave 3 and more often reaches a 38.2%
retracement. It normally reaches the territory of subwave 4 of the previous
3rd wave. In very strong markets wave 4 could only retrace 14% of wave 3.

Wave 5
Wave 5 normally is equal to wave 1 or travels a distance of 61.8% of the
length of wave 1. It could also have the same relationships to wave 3 or it
could travel 61.8% of the net length of wave 1 and 3 together. If wave 5 is
the extended wave it mostly will be 161.8% of wave 3 or 161.8% of the net
length of wave 1 and 3 together.

Wave A
After a Triangle in a fifth wave, wave A retraces to wave 2 of the Triangle of
previous wave 5. When wave A is part of a Triangle, B or 4 it often retraces
38.2% of the complete previous 5 wave (so not only the fifth of the fifth) into
the territory of the previous 4th wave. In a Zigzag it often retraces 61.8% of
the fifth wave.

Wave B
In a Zigzag wave B mostly retraces 38.2% or 61.8% of wave A. In a Flat, it
is approximately equal to wave A. In an Expanded Flat, it usually will travel
a distance of 138.2% of wave A.


                                     33
Wave C
Wave C minimally has a length of 61.8% of wave A. It could be shorter in
which case it normally is a failure, which foretells an acceleration in the
opposite direction. Generally wave C is equal to wave A or travels a
distance of 161.8% of wave A.
Wave C often reaches 161.8% of the length of wave A in an Expanded
Flat. In a contracting Triangle wave C often is 61.8% of wave
A.

Wave D
In a contracting Triangle wave D often travels 61.8% of wave B.

Wave E
In a contracting Triangle wave E often travels 61.8% of wave C. It cannot
be longer than wave C!

Wave X
Wave X minimally retraces 38.2% of the previous A-B-C correction; a
retracement of 61.8% is also common.


                                    34
Trading the Elliott Wave
The Elliott Wave provides you with the most objective and disciplined
method available for trading. Only a handful of patterns exist, sometimes
easy to recognize especially in strong impulsive waves. The available
patterns tell you where the market is heading; in what way (or structure)
this will happen and under what circumstances the pattern gets a stronger
probability. Also the pattern will tell you when it is no longer valid because
of the occurrence of an intolerable price action. This makes it possible to
exactly determine your entry and exit points, which is an outstanding
characteristic of the Elliott Wave.

The key to forecasting markets with the Elliott Wave lies in determining the
probabilities of alternative scenarios. If you find several alternative counts
pointing in the same direction, you have found an excellent trading
opportunity.

Some people, mainly those who could not successfully apply the Elliott
Wave themselves, will tell you either it is too complex and subjective or that
the waves don’t exists at all, suggesting the market follows a random
pattern.

Obviously the Elliott Wave can get very complex-especially in corrective
waves- since you will have to look for patterns, which contain patterns,
which contain patterns etc. etc. But it never loses its objectivity if you apply
the rules and guidelines. The only problem is that sometimes it is not totally
clear if the internal structure of a wave is a 3 wave or a 5 wave. In that case
you will have to determine alternatives for both internal wave structures and
look for other confirmations, such as channels, indicators and Fibonacci
ratios. Below we will mention the key steps for Elliott Wave analysis and
supply basic trading patterns to search for.


                                     35
General Directives for Trading
Now you can use the Automatic Analysis to trade profitably, the more
probable an outcome the better opportunities. The more alternatives point
in the same direction the more certain the market will move accordingly.
The Automatic analysis will generate an ever objective and consistent wave
count and will always present the most probable outcome first, set by
objective rules and guidelines implementing a true Elliott Wave model.
Those who really would like to learn the Elliott Wave have to really study
the ins and outs. In the following we offer some directives. These directives
come from our own experience as well as many publications on this
subject. Of course every trader or analyst should find his own path to
success.

Study the Patterns
   •    know the rules and guidelines

   •    learn the internal structure of patterns, which enables you to
        recognize a pattern within a pattern
   •    remember that only waves 1,3,5, A and C can be impulsive waves

   •    all other waves are corrective, against the trend, and show overlap
        in their internal structure


Design Alternative Scenarios by Labeling the Chart.
    • Start labeling the chart by taking into account the following rules and
      guidelines:

    • Separate impulses from corrections, an impulse normally shows
      acceleration and no overlap, a correction a sideways pattern

    •   Waves of the same degree should have the same proportions,
        which is especially important for wave 2 and 4. A minuscule 4th
        wave cannot belong to a big wave 2 and so on.

    • Wave 2 can never retrace more than 100% and go beyond the
      origin of wave 1.

    • Wave 3 normally is the longest wave and shows the most powerful
      acceleration

    • In wave 3 there is never an overlap between wave 4 and 1, as it
      occurs in fifth waves (and first or A waves

    • Label the big picture, is it a three or a five?

    • Label more in detail, by labeling the smaller wave degrees, then go
      back to the large wave degrees, changing your labels if necessary


                                     36
• Check if the required internal structure of your waves comply with
     the rules and guidelines. For example a B wave never can consist of
     five waves and so on

   • Check if the internal structure of the internal structure is correct. For
     example an (expanded) Flat consists of a 3 wave, again a 3 wave
     and a 5 wave structure. If this is not true, change your labeling

   • Check your wave count for alternation, especially with wave 2 and 4.
     If wave 2 showed a simple Zigzag, wave 4 should show a complex
     pattern

   • A corrective pattern mostly minimally carries into the territory of the
     4th wave of the previous impulse wave

   • Use momentum indicators and volume to support your wave
     labeling. Wave 3 should have the highest momentum and volume (if
     it is the longest wave).
   • Calculate Fibonacci relationships. If your wave count reveals a lot of
     reasonable Fibonacci ratios, you have found an interesting count.

   • Throw in channels and determine if your wave count more or less
     fits these channels

   • Design as many scenarios as the Wave Principle allows for, with
     regard to the wave degree or time frame you are analyzing

   • Do the same for shorter and longer time frames (or lower and higher
     wave degrees) and try to narrow down alternatives by fitting them to
     a multiple of wave degrees

   • Assess the probabilities of these scenarios by studying their
     compliance with the permitted internal wave structure, the outcome
     of Fibonacci ratios and the fit of channels

   • Draw the expected price action/pattern of each scenario you have
     designed, mark price levels where you get signals to enter/exit
     market.

Design a Trading System
  • Determine what time frame (or wave degree) you would like to trade

   •   Determine which patterns and alternative wave counts give the best
       trading opportunities, such as when several alternatives all produce
       a price movement in the same direction

   •   Determine objective entry points based on patterns

   •   Determine objective exit points, also based on patterns. You should


                                    37
for example exit a trade when a price movement makes your
      preferred wave count invalid.

Control Your Emotions
  • Don’t be afraid to take a loss if your stop gets hit. This means you
      will have to admit you were wrong on this trade. Don’t be afraid of
      loosing the (little) profit you have made, only exit if your system or
      wave analysis tells you to
  • Follow the rules of the Elliott Wave and don’t second-guess the
      market. Believe what the Elliott Wave tells you, your stop will protect
      you
  • Of course there will be loosing trades; a 100% score is impossible.
      But if you limit your losses (by executing your stop) and let your
      profits run, you could be very successful. So maintain your discipline
      and learn from all trades


                                    38
Trading Example
In this section you will be shown how to recognize an impulsive wave from
a corrective wave. In the same way as these basic patterns are compared
and analyzed here, you can do it yourself with all other patterns. Suppose
the market has experienced a big sell off. From the bottom it starts to rise.
Wave 1 (or A) and wave 2 (or B) have been completed and the market
starts to rise again. The first picture shows two scenarios possible, either
an impulse (1,2,3) or an A,B,C correction. The pictures there under
demonstrate which price action to expect in an impulse or in a correction:
The pattern can be an impulse only if the 4th wave does not overlap the
first, a level indicated by the horizontal “stop” line. As soon as the price
drops under this line-before wave 5 has been completed- you have your
first signal of a pending correction (picture above at the right). This
correction will be confirmed when the price drops under the origin of wave
C, which is the end of wave B. As long as it doesn’t drop under the
“confirmation” line, it could still be an extended 3rd wave that subdivides. In
that case the C or 3 wave is only wave 1 of the third wave! You will find the
pattern called extension under the chapter “Patterns”.


Fig. 28


                                     39
See the successful impulse wave 1 on the AOL chart.


See the failure of a wave to go up and the result of and an A B C correction
wave in the gold chart.


                                   40
Indicators
A selective set of indicators can help you determine the wave structure.
Remember that an Elliott Wave trader makes his trading decision mostly on
the wave count and not solely on indicator values, On the other hand some
indicators can be very helpful, because they show specific characteristics in
different waves.

Indicators can be added to the price chart or in a separate window.
Normally, indicators like moving averages and others, which have the same
scaling as a price chart, are added to the price chart itself. Other indicators,
like RSI for example, are clearer if displayed in a separate window.

The most useful indicators are the following, not all of them have been
explained, since all books on technical analysis already clarify their use:

   •   RSI
   •   MACD
   •   DM1
   •   Momentum
   •   Exponential Moving Average
   •   Simple Moving Average
   •   Displaced Moving average
   •   Rate of Change
   •   Elliott Oscillator
   •   Stochastic
   •   Volume
   •   Bollinger Bands

Indicators always have the same compression as the price chart. For
example if the RSI has been set to a time period of 14 and a daily bar is
displayed in the price chart, then the RSI will calculate a 14-day RSI. If you
change the price chart to weekly, the RSI will calculate a 14-week RSI. The
same accounts for intra day (intra day version only), for example an hourly
chart creates an 14-hourly RSI and so on.


                                     41
Relative Strength Index
Relative Strength Index (RSI) is an oscillator developed by J. Welles
Wilder, JR. It is a very popular indicator and useful when applying the Elliott
Wave.

RSI measures the strength of any price action by monitoring changes in its
closing prices. It is a leading or a coincident indicator, it never lags the price
action. The RSI indicator fluctuates between 0 and 100. Horizontal
reference lines in the RSI are often drawn at 30 and 70.
RSI gives several buy or sell signals, which are divergences, patterns,
trend lines and the absolute level of RSI, the RSI levels as already
mentioned. Divergences are the most important signals. Divergences
between RSI and prices give the strongest buy and sell signals. Normally
this happens at tops and bottoms in an impulsive wave, which consists of
five waves. If the C wave is equal in length to wave A, the RSI should also
show a divergence. Generally a divergence indicates that the trend is weak
and ready to reverse.

A bullish divergence gives a buy signal, when prices fall to a new low but
RSI fails to make a new low. You can buy as soon as the first RSI bottom
has been below its lower reference line (for example at 30) and the second
bottom of the RSI happens above the reference line. See chart below.


                                      42
A bearish divergence works exactly the same, but the other way round. It
gives sell signals. You can sell as soon as the first RSI high has been
above its higher reference line (for example at 70) and the second top of
the RSI happens underneath the reference line. See Chart below.

Trend lines, support and resistance lines, and patterns, like “head and
shoulders”, work fine with RSI. Because RSl leads the price chart, it often
gives early warnings of likely trend changes. RSI trend lines are penetrated
before it happens in the price chart and patterns can be completed a few
days before completion in the price chart. Of course the fifth wave of a RSI
mostly is a failure, except when the fifth wave is an extension.

RSI levels indicate that above 70 the market is overbought, which calls for
a correction, although the RSI can reach 80 and more in a bull market.
Under 30 the market is oversold, so a rise can be expected, but be careful
because in a bear market a RSI beneath 20 is quite common. So when the
RSI goes above 70 and certainly above 80, look for a selling opportunity.
Beneath 30 and certainly 20 you should look to buy.


                                   43
Moving Averages (MA)
A 10 day MA shows the average price for the past 10 days, a 30-day MA
shows the average price for the past 30 days. A moving average normally
will be displayed in the price chart as a line, by connecting each day’s MA
values.

Moving averages can be calculated as a simple moving average, which
gives each day an equal weight.

Also, an exponential moving average can be calculated, where the latter
days are heavier weighted. With a moving average you can see the main
trend more easily, because it filters out the small price movements. When it
rises, the moving average shows that investors become more optimistic.
When it falls, investors become more pessimistic.

An exponential moving average (EMA) is a better trend-following indicator
than a simple MA, because it responds faster to the latest price changes
than a simple MA and skips older data which are less relevant.
For the investor moving averages are most helpful in following the trend.
The direction of its slope in each time frame tells you what the trend of this
specific time frame is. Be sure to trade in the direction of the trend of the
time frame you use. When you are trading a trend, you can use a short
term MA as a stop. See 30 EMA below.

In the price chart you could also display a short term MA and a longer term
MA. When the shorter term MA crosses the longer MA in upward direction
this is a buy signal, which confirms the up trend. When it dips under the
longer term MA this is regarded as a sell signal. Be careful with this signal,
because a sideways market shows a lot of crossovers and thus a lot of
false signals. You can also use a moving average as a stop. The shorter
your investment horizon the shorter your moving average should be. As
soon as prices break the moving average line you can close your position.
This can be very useful if you want to invest in a third wave only.


                                     44
Moving Average Convergence Divergence (MACD)
Gerard Appel has constructed a more advanced indicator, called the
Moving Average Convergence-Divergence, or MACD, which is built of three
exponential moving averages. It is displayed as two lines, the MACD line
and a the Signal line. The MACD line is built out of two exponential moving
averages (EMAs). The signal line is built from the MACD line smoothed
with another EMA. The MACD line responds more quickly to changes in
prices.

Buy and sell signals occur when the fast MACD line crosses above or
below the slow Signal line.

You can use the crossovers of the MACD and signal lines to trade with the
trend of the market. The fast MACD line crossing above the slow Signal
line gives a buy signal. The fast MACD line crossing below the slow Signal
line gives a sell signal

Also you can look for divergences as explained with the RSI to determine
the momentum of the market. Again a wave 3 should have the lowest (bear
market) or highest (bull market) MACD. Divergences in the MACD don’t
work on longer term.


                                   45
Momentum
The Momentum indicator shows how strong the trend is by measuring its
acceleration. The faster Momentum gains or loses speed the more the
trend accelerates. This is a leading indicator, which usually reaches a peak
before prices reach their highs and reaches a bottom before prices reach
their lows.

The trend is up as long as Momentum gets higher and higher, you can
normally hold on to your bullish positions. As long as it keeps reaching new
lows, you can hold on to your short trades. Every time Momentum reaches
a new high, the up trend is still accelerating. Every time Momentum
reaches a new low, the downtrend is still accelerating.
When the direction of Momentum changes, without having set a divergence
already, be prepared for a reversal.

You can use Momentum to catch large trends, for this purpose use a longer
time frame. If you want to spot changes in the trend quickly, then use a
shorter period Momentum.

When the direction of Momentum changes, the pattern could be the third of
a C wave or the third of a five wave. A small correction will take place to
form the 4th wave. The fifth wave still has to develop in the same direction
of the trend. When this fifth wave is underway, you can cover your shorts or
sell your longs.

Again a divergence is one of the most powerful signals, which normally
occurs in every five wave structure. The bigger the divergence the sharper
the reversal can be. If Momentum fails to make a new high or low, this
could be a C wave or a five-wave structure, which depends on the wave
structure of larger degree.

If you can recognize five waves in a C wave in a larger trend, which points
to the opposite direction, and at the same time Momentum makes a lower
top or a higher low, it is better to close your (trend following) positions at
once. After a C wave the reversal could be quite sharp. On the other hand,
if the larger trend is still up, this only could be wave 3 with wave 4 and 5 to
follow. Here you could hold on to your positions depending on the wave
degree you have determined. In a larger degree a bigger reversal can be
expected, making it worthwhile to exit. Later on you could possibly reenter
at a better price.

You can also draw trend lines or channels to identify support and
resistance in indicators. Usually Momentum breaks through its resistance a
long time (relatively speaking) before prices do.


                                     46
Rate of Change
Rate of Change is quite similar to Momentum, since it also measures the
strength of a trend. The only difference is that Rate of Change is calculated
differently. It divides today’s price by a past price. The faster Rate of
Change gains or loses speed the more the trend accelerates. This is a
leading indicator, which usually reaches a peak before prices reach their
highs and reaches a bottom before prices reach their lows.

The trend is up as long as Rate of Change gets higher and higher, you can
normally hold on to your bullish positions. As long as it keeps reaching new
lows, you can hold on to your short trades positions. Every time Rate of
Change reaches a new high, the up trend is still accelerating. Every time
Rate of Change reaches a new low, the downtrend is still accelerating.

When the direction of Rate of Change changes, without having set a
divergence already, then be prepared for a reversal.
You can use Rate of Change to catch large trends, for this purpose use a
longer time frame. If you want to spot changes in the trend quickly, then
use a shorter period for Rate of Change.

When the direction of Rate of Change changes, the pattern could be the
third of a C wave or the third of a five wave. A small correction will take
place to form the 4th wave. The fifth wave still has to develop in the same
direction of the trend. When this fifth wave is underway, you can cover your
shorts or sell your longs. Again a divergence is one of the most powerful
signals, which normally occurs in every five-wave structure. The bigger the
divergence the sharper the reversal can be. If Rate of Change fails to make
a new high or low, this could be a C wave or a five-wave structure, which
depends on the wave structure of larger degree. If you can recognize five
waves in a C wave in a larger trend, which points to the opposite direction,
and at the same time Rate of Change makes a lower top or a higher low, it
is better to close your (trend following) positions at once. After a C wave
the reversal could be quite sharp. On the other hand, if the larger trend is
still up, this only could be wave 3 with wave 4 and 5 to follow. Here you
could hold on to your positions depending on the wave degree you have
determined. In a larger degree a bigger reversal can be expected, making it
worthwhile to exit. Later on you could possibly reenter at a better price.

You can also draw trend lines or channels to identify support and
resistance in indicators. Usually Rate of Change breaks through its
resistance a long time (relatively speaking) before prices do.


                                    47
Elliott Oscillator
This indicator is very useful in counting waves. It was discovered by Tom
Joseph in 1987 and named the Elliott Wave Oscillator.

The pattern this oscillator produces has a strong correlation with the pattern
of the Elliott Wave. For example the 3rd wave mostly is the strongest wave.
At this point generally the Elliott Oscillator shows the highest value, thus
confirming a 3rd wave. The Elliott oscillator works in all time frames,
provided you have enough periods or bars available in your price chart. In
order for the Elliott Oscillator to produce reliable values your price chart
should contain 100 bars minimally.

If you work with intra day data, you can zoom in on each wave to check the
pattern of the Elliott Oscillator, as long as enough detail is available.

Formula: 5-period MA - 35 period MA of the (High + Low) /2
A divergence between the Oscillator and prices indicates a trend reversal.
When the market has set new lows but the Oscillator does not, you have
probably found wave 1 in Elliott terminology.
When you spot this divergence you could do your first trade and buy the
market. At this juncture risk is high, so watch the market closely. Always
sell when the market reaches a new low, since this could be the beginning
of a renewed sell off.

Next a correction will take place, which is wave 2. Neither the market will
reach new lows in wave 2, nor will the Elliott Oscillator. If wave 2 is
complex, the oscillator will pull back to zero. A simple wave 2 on the
contrary will hardly affect the oscillator. When the oscillator reaches zero
you could buy again to profit from the coming 3rd wave, on the condition
that the pattern of supposedly wave 2 is corrective (when it shows a lot of
overlap and not a 5 wave)

Then the market will build wave 3, normally the strongest price movement.
Both the indicator and the market will reach new extremes. As soon as
wave 3 has gone beyond wave 1, the market will accelerate sharply. The
oscillator does not provide for an exit point in this time frame or wave
degree, so you have to look at the subwave of this wave degree. If you
detect a divergence between subwave 3 and wave 5 of the main 3rd wave,
you have found your exit.

After wave 3 again a correction will take place in wave 4. Notice that wave
4 will be complex if wave 2 was simple and vice versa. Normally (90% of all
4th waves) the oscillator will at least retrace to zero in wave 4.
As long as the oscillator does not retrace more than 138.2% of the wave
three peak, the correction is considered to be wave 4. If it retraces more
prepare yourself for a decline, since there is a strong probability that the
price rise was a corrective three wave in a contra trend price movement.
When the Oscillator reaches zero you could enter the market again to profit
from wave 5, on the condition that the pattern of wave 4 was corrective.


                                    48
Most of the time the market will make new highs in the 5th wave, but the
oscillator won’t come near its top in wave 3. This divergence is a strong sell
signal, on the condition that the pattern of the 5th wave is complete. If both
the oscillator and the market make new highs, you will have to relabel the
5th wave to wave 3!


                                    49
The ELWAVE Program - Introduction
Attention:
You will need the special “Automatic analysis” module to automatically
analyze price data according to the Elliott Wave Principle. In addition, you
will need the “Trading signals” module to generate trading indications
automatically.
In this chapter we will introduce you to our Elliott Wave software. We will
show you how to use ELWAVE without the requirement of being an Elliott
Wave expert.
Now Elliott Wave analysis and trading is just a few mouse clicks away.
For experts we explain the possibilities and advanced features in the
Chapters “AUTOMATIC ANALYSIS”, “TRADING SIGNALS” and “MANUAL
WAVE COUNT”.
The Automatic analysis chapter will briefly describe how our Elliott Wave
model works, a short description of analysis options, the difference
between the CLASSIC and MODERN rules and how to inspect the
alternatives ELWAVE has found.
The Trading signals chapter explains the outcome and interpretation of the
signal indications as well as further explanation of the SUMMARY
INSPECTOR, the ALERTS INSPECTOR and the SIGNALS INSPECTOR.
The Target clusters chapter explains how to interpret time projections using
the TIME CLUSTERS indicator or the Target zone, which can be shown in
the chart.
The chapter Manual Wave count explains how to make an Elliott Wave
count yourself instead of have ELWAVE do it for you. Of course you have
to be an expert to make a high quality count, but fortunately ELWAVE is
able to check the count, even if you have the Basic module only. In addition
you will find more information about the WAVE INSPECTOR and the
WAVE TREE.
If you are looking for explanation on specific topics, check out the chapter
“Technical Tools-Extra information”. Here you will find more information on
for example loading and saving data and scenario files, the price chart
window, trend lines, channels, time ratio ruler and real-time data feed. For
your convenience we have also added a chapter that describes the menu
options one by one, called “Using the menu”.
Naturally we have included an extended chapter on the basics of the Elliott
Wave Principle and a detailed description of the Elliott Wave patterns.
Reading is not required to use the software, but still highly recommended.
Our manual concludes with a short chapter on Indicators. Not all indicators
have been explained, because many books on interpretation and use of
these indicators are available. We recommend getting more information on
indicators from other sources as well.


                                    50
Our Automatic analysis uses a true Elliott Wave model to detect validated
patterns and to determine the direction of prices, thus enabling you to
forecast markets more accurately. In this section you will learn the
essentials in order to start using the program right away, assuming you
have purchased the full End of Day or Intra day version. If you have the
Basic version only, please go to chapter “Manual Wave count”.
After you have followed the steps listed below you will be able to use
ELWAVE. We have assumed that you are familiar with the Windows
environment, the way the menu works and so on. If not, you will have to
study your Windows manuals.


                                   51
Quick Start
1. On top of the screen the main menu is listed, click on the menu item to
access its options.


2.Load an existing scenario file by choosing Open from the Scenario menu
or choose New and From price data to import data. Select the directory that
contains your data and choose the correct FILE TYPE.


3.After the chart has been loaded, choose Analyze entire chart from the
Analyze menu.


                                   52
4.Press the TARGET ZONE button in the right lower corner of the chart
window.


5. This will then draw the TARGET ZONE and expected market PATH.


5.ELWAVE will present all information you need after completion of the
analysis, such as
• Preferred alternative
• Targets
• Trading signals
• Entries, exits, risk / rewards etc.


Now take a look at the SUMMARY INSPECTOR to spot opportunities
easily in the EASI indicator column. The more positive indications shown,
the stronger the uptrend and vice versa. It’s that simple.


                                   53
Analysis Results
We will now discuss how ELWAVE presents analysis results when you
have taken the steps as mentioned before. After completion of an
automatic Elliott Wave analysis, ELWAVE will come up with more or less
the following screen.


As you see, a lot of information is available, which we will explain step by
step in the following sections.
In all predefined layouts (see Analysis menu) ELWAVE will show the
SUMMARY INSPECTOR, which probably gives the most important and
concise information as depicted in the picture below.
Additionally the expected market PATH as well as the more specific
TARGET ZONES are pictured below.


                                    54
Price Chart window
In the default layout this window is presented at the left. of the screen. It
contains for example the price data, the wave labels that have been
inserted by ELWAVE and the automatic channels.
In this example an analysis of 100 years of Dow Jones data, 3 wave
degrees or time frames are displayed.
Every wave degree has a different color, all connected objects, such as
channels, target bars, have the same color. TARGET BARS are displayed
as vertical lines, representing the minimum and maximum expected target
of the selected pattern. The small diamonds represent the average targets,
which correspond with the information in the SUMMARY INSPECTOR (see
below). For easy recognition, these diamonds inherit the color of the wave
degree or time frame to which they belong. The same goes for the triangles
that represent the exits.


                                     55
Toolbars
On top of the screen, just underneath the main menu, two toolbars are
displayed (See the pictures on the previous pages). The OBJECT toolbar
or Chart objects contain buttons


for inserting channels, trend lines, time rulers, spirals and trigger lines.
Grab the button and drag it into the chart and release it at the required
spot.


The WAVE LABEL toolbar,
The wave label toolbar, which by default lists the “Supercycle” wave labels,
can only be used when determining your manual wave count. The setting
of this toolbar to a specific wave degree has nothing to do with the
automatic Elliott Wave analysis.


                                      56
Wave Tree
The WAVE TREE is a tree-structured representation of the first Elliott Wave
analysis that is displayed in the chart. It is displayed at the left of the
screen. On top of THE WAVE TREE, two buttons “PREVIOUS” and
“NEXT” can be found. Clicking these buttons will only affect the highest
wave degree and scroll to the next or previous Elliott Wave alternative. To
take a look at alternatives from lower degrees, click that particular WAVE
BUTTON and click the right mouse button and scroll the alternatives.
The WAVE TREE itself is composed of WAVE BUTTONS, each of them
represent a wave in the chart, which in fact is a small or large trend or
correction. Together, a group of WAVE BUTTONS build a higher wave
degree of a larger time frame.
Clicking a WAVE BUTTON, that displays a wave label, will show that
particular wave with the required wave detail, all of its channels and other
connected objects.
The small + or - buttons make the WAVE TREE expand or collapse. If you
press the + button, the underlying patterns that consist of several waves,
each represented by a separate WAVE BUTTON, will be displayed. By
expanding the WAVE TREE and selecting lower level waves, you can
navigate as deep down into the wave structure as you like. This will show
which patterns ELWAVE has found. The patterns found are listed at the
right of the WAVE BUTTON.
The most interesting Waves are the unfinished waves, which can be
recognized by the gray cross in THE WAVE BUTTON. Obviously a correct
forecast of the pattern in an unfinished wave is the key to forecasting
markets.
In case a red cross appears in the WAVE BUTTON, the patterns in this
wave or in the underlying waves are either not found or are not allowed.
If the Trading signals module is included, double clicking a WAVE BUTTON
will show the trading signals for the pattern under inspection.
At the left in the SIGNAL INSPECTOR the trading indications are listed
together with the critical price level. At the right the patterns that share this
signal, are listed. At the bottom the description of the rule, on which the
trading indication is based, is displayed.
Trading signals in ALL CAPS already have been triggered, while Trading
signals in lower case have not yet been activated, because their critical
price level is not reached. There are four signals:
Entry, to enter a position, which is a buy or sell indication depending on the
trend
Exit, to exit a position, which is a buy or sell indication depending on the
trend


                                      57
Confirm, this is an alert that the trend has been confirmed, depending on
your strategy this can either be used as an entry or an exit
Recalc, if this price level gets penetrated, ELWAVE will update the analysis
because a critical price level has been broken, its price level will coincide
with some other signals
Use the scroll bars at the right side of the WAVE TREE window or at the
bottom to scroll the tree.
As shown in the picture below, clicking on the WAVE BUTTON (or pattern)
in the WAVE TREE displays this wave in the price chart, the SWING
FILTER (light blue line), a text book example of an impulse pattern and
connected TARGET BARS.


                                    58
Wave Inspector
The WAVE INSPECTOR gives a lot of additional information on the pattern
under inspection. It is not necessary to inspect this information;
nevertheless it could be a valuable tool in your trading. Certainly it will
teach you which rules and guidelines determine the patterns.
The WAVE INSPECTOR will always display information on the pattern that
has been selected as in this case, where the pattern Impulse has been
highlighted in the left list box on top of the WAVE INSPECTOR.
At the left the still validated patterns are listed, at the right dismissed
patterns are listed. If you choose one of the dismissed patterns, you will
notice that at least one of the rules of the pattern has been violated and
checked by a red cross.
Use the scroll bar at the right side of the WAVE INSPECTOR window to
see more. In the following pictures we have shown the available
information.

The score on top in bold in the WAVE INSPECTOR is the total score,
which is used to rank the alternatives.
The better the Fibonacci ratios, the better the Elliott Wave analysis.
Clicking on the rules and guidelines in the WAVE INSPECTOR will display
the critical price levels, where the rules or guidelines get violated, in the
chart.


                                    59
Summary Inspector
Probably the SUMMARY INSPECTOR gives the most important and
concise information, eliminating the need of being an expert Elliott analyst.
Using this information will give clear indications on how to trade and when
to enter or exit positions.


Apart from the SUMMARY INSPECTOR it is recommended to take into
account other information and use other tools as well, in order to make the
best trading decision possible.
By default, the SUMMARY INSPECTOR is displayed at the bottom of the
screen. The column called EASI is the main thing to watch in combination
with the R/R (risk-reward) parameter. As long as the AVG R/R is above
zero the EASI column will give a positive or negative indication, depending
on the trend. If the AVG R/R turns negative, the EASI will become a
“neutral”.
If all time frames display the same signal, either a “Positive” or “Negative”
and the AVG R/R is above 1, then expect an acceleration in the direction of
the trend, provided a large price movement has not yet taken place. A risk-
reward of 2 or more is very favorable as long as this is not caused by an
extremely small risk in the RISK column.
After ELWAVE for example shows a “Positive” on every time frame, at
some point the EASI column of time frames (the smallest time frame first)
will turn into a “Neutral” as soon as the TARGET has been reached. As
said before TARGETS are displayed in the chart by a diamond, while
EXITS are displayed as little triangles. Both TARGET and RISK are
presented in points.
Normally a “Neutral” means you can still hold on to your positions. If he
smallest time frame turns to a “Negative” or the EXIT, as listed in the
SUMMARY INSPECTOR, is penetrated, you have a signal to exit your
positions, depending on your trading strategy.
If the EXIT level gets hit this does not automatically mean that the position
should be abandoned, especially if the EASI is still a positive (Negative in
down market) or a hold. Consider the EXIT to be the first warning signal of
a reversal, which has yet to be confirmed. In Elliott terminology the stop of
at least one alternative has been hit, invalidating this scenario, but other
alternatives could still be possible.


                                    60
In case all alternatives have been dismissed, because all their exits have
been triggered, the SUMMARY INSPECTOR will show a change in the
TREND column and /or the EASI column.
These time frames, as highlighted in the above picture, show the relative
order of the trends within trends or pattern within patterns that ELWAVE
has found automatically. Time frames of the same degree normally do not
exactly have the same duration; they are dynamic in nature.
The lower listed TIME FRAMES (or wave degrees) in the SUMMARY
INSPECTOR are smaller trends in a larger trend (or the higher listed TIME
FRAME).
Therefore an Intermediate time frame is a smaller trend in the Primary and
so on.
Please note that a wave degree as listed in the SUMMARY INSPECTOR is
not related to the duration of the wave degrees as normally defined by the
Elliott Wave Principle, which definitions are only tendencies, not fixed and
exact.
RISK shows the number of points you risk if you adhere to the exit in the
EXIT column.


                                   61
ELWAVE in a Nutshell
1. Only the very first time you have to import an existing (intra day) data file
for each security or market provided you save it as a scenario file, which
you load the next time. With respect to intra day files, you should use an
already existing intra day file and have this updated by the real-time feed
(make sure the date and other formats are the same). Alternatively you can
start a file from scratch using a real-time data feed!


2. Select New from Scenario menu and next From Price data to import
data: Import existing data files, choose the type of data to import by
selecting FILES OF TYPE in the dialog box as displayed above. Next
cruise to the directory where your data files are located. The formats
supported are Metastock3.1-6.5, ASCII, TC2000 3.0-4.0, FutureSource,
CSI, Keyword and Techtools. From real-time feed, to start collecting tick by
tick, building your own intra day files from scratch
3. Files of the type you have specified will be listed in the right pane. Click
on the file in the right pane once and click on OPEN
4. Once you have imported the data, immediately save the chart as a
scenario file for later use, giving it the name of the security or market. This
makes it easier to load the data file and will save real-time feed settings as
well. In addition, a print out of the chart will have included the scenario file.
In order to do so, choose Scenario and select Save .

5. The next time you would like to analyze this market, just load the
scenario file you have just saved, choose from the main menu Scenario
and select Open, the scenario file will remember where to find the data file
automatically.
6. ELWAVE will use a default analysis layout to present results, taking into
account your screen resolution. If you like, you can readjust all the windows
to make a tailor made layout. Save it by selecting Analyze from the main
menu and by choosing the option Save Custom layout.


                                      62
7. Start Automatic Analysis by choosing Analyze from the main menu and
select the option Analyze entire chart to generate an analysis from scratch.
Of course you must have loaded data first. You may analyze a market from
scratch or analyze an existing wave count in more detail (see examples in
the next chapter). ELWAVE will present still remaining alternatives together
with their targets and channels automatically.
8. The SUMMARY INSPECTOR will show concise information about
several time frames. The most important information to watch is the Trend
and EASI (Elliott Advanced Signals Indicator). For each time frame EASI
will show Positive, Negative or Neutral, if 2 or 3 consecutive time frames
show positive or negative, an interesting trading opportunity is emerging in
the direction of the trend.
9. Press the TARGET ZONE button, which is located in the lower right
corner of the chart window, to show the expected path of prices as well as
the target zones in the chart.
10. Save your analysis by choosing Save from the Scenario menu
11. More detailed analysis using results of Automatic analysis, the WAVE
TREE has appeared at the left after you have analyzed the entire chart as
described under point 7, click with your left mouse button on the wave
(button) in the WAVE TREE you want to analyze select Analyze from the
main menu choose the Analyze selected wave option.
12. Using a wave count defined by the user:
   •   first load your scenario file containing your own wave count
   •   select Analyze from main menu
   •   choose option Check wave count
   •   if this is your first time, accept the settings of the dialog box by
       clicking OK
   •   The WAVE TREE appears at the left, click with your left mouse
       button on the wave (button) to be analyzed
       select Analyze from the main menu
   •   choose Analyze selected wave option
13. ELWAVE will present the preferred wave count in the WAVE TREE,
displayed at the left, as well as in the chart. In addition it will display all
formation in the WAVE INSPECTOR
14. You may cruise the chart by clicking on the WAVE BUTTONS in the
WAVE TREE. This will bring you to the required section in the chart, it will
zoom in on this area and adjust detail accordingly. Alternatively, to zoom in,
position your mouse pointer on empty space of the chart and press the
RIGHT mouse button (not the left button) and a menu pops up which


                                      63
contains the option Zoom in, select this and drag your mouse on the
section of the chart
15. To expand wave degrees, click on the + Button in the WAVE TREE,
which are positioned in front of this wave degree.
16. The preferred pattern is listed behind the WAVE BUTTON
17. To make the WAVE TREE disappear select from View the option
WAVE TREE, use this as a toggle for display
18. By default the WAVE INSPECTOR will come up with complete
information about the preferred pattern of largest degree, which is the top
WAVE BUTTON of the WAVE TREE.
19. If you press another WAVE BUTTON in the WAVE TREE, immediately
the WAVE INSPECTOR will show information on the preferred pattern,
found in this wave degree.
20. It will show a standardized drawing of this pattern in the chart,
presenting targets for this pattern and the path the pattern is expected to
follow.
21. On top of the WAVE INSPECTOR you will find two list boxes. The left
box lists the patterns that have been approved, the right one that have
been rejected. Select one of these patterns to see why patterns have been
approved or rejected by inspecting the rules and guidelines that can be
found in the WAVE INSPECTOR.
22. Click on a rule or guideline in the WAVE INSPECTOR to visualize it in
the chart.
23. To make the WAVE INSPECTOR disappear select from View the
option WAVE INSPECTOR, use this as a toggle for display.
24. A summary of Trading Signal indications will appear automatically in
the SUMMARY INSPECTOR provided the Trading Signals module has
been ordered.
25. To display indicators for the active chart, choose from the main menu
Insert and select New Indicator pane. With your mouse select the indicator
in the dialog box that pops up, Press the ADD button and Press OK. Some
Indicators can only be inserted in the chart, choose New indicator in
chart…
26. The same way you can show the TIME CLUSTERS, provided the
Target Clusters module has been purchased.
27. If you like to use the other tools of ELWAVE as for example Channels,
Fibonacci Pane and Quick targets, you will have to convert one of the
alternatives of the automatic count to manual wave labels first. Select
Analyze from the main menu and choose Convert to wave count. Please
note that only the activated alternative will be saved in a separate window.


                                    64
Hereafter you may save the scenario by choosing from the Scenario menu
the option Save as…
28. Loading a scenario containing manual wave labels, will not
automatically display the WAVE TREE and WAVE INSPECTOR. In order
to accomplish this you have to choose Check Wave count from the Analyze
menu
29. To display Fibonacci ratios of the selected wave label, choose from the
main menu Insert and select Fibonacci pane. This will only work after you
have converted to a wave count! And again you have to click on the wave
label first to select it!
30. To visualize more targets, select the wave label in the chart, press the
right mouse button and choose Quick targets
31. To drop channels, trend lines, spirals and the TIME RULER, grab this
object in the CHART OBJECTS Toolbar on top of your screen and drop it
on the wave label of your choice or at another position in the chart.
32. In order to save all settings of the chart, including indicators, channels,
targets etc. , save the scenario frequently.
33. You are allowed to analyze multiple charts in several sessions of
ELWAVE.
34. If you have analyzed several charts, you can toggle display of the chart
together with full analysis information by using from the main menu
Windows and selecting one of the charts listed as menu items.
35. To use the simulation feature (only available on purchase of Trading
Signals), choose Options from the main menu and select Truncate price
data…
Before you choose this option, move the mouse pointer over the chart area
where you would like to truncate the chart and watch the right end of the
status bar for the index number, which has to be inserted in the Truncate
dialog box. Truncate price data will force the software to neglect future
data. Now instruct ELWAVE to analyze these truncated data and compare
the analysis outcome and signals with what really happened in the future.
For easy comparison future data has been grayed out in the chart window.
36. Press CTRL-1 (or a higher number of the numerical keypad, NUM
LOCK must be ON) to add future data to the price chart. If critical price
levels get penetrated when adding future data, the ALERT INSPECTOR
will show the trading indications automatically.


                                     65
Batch Processing
The ELWAVE BATCH PROCESSOR is a new and powerful addition to the
ELWAVE suite of financial analysis products. Frequently recurring
operations, such as analysis or printing of charts, can now be automated.
The following dialog box will come up when you double click the Batch
processing icon.
Now you can define which charts you would like to have analyzed without
the need to give the software every instruction by hand for every chart.
You can only use previously defined Scenario files (extension *.ELW)!!
Batch Processing Step by Step
1. Define scenario files for each data file. Load the data file in ELWAVE
and save it by choosing Scenario from the main menu and select the menu
item Save. Repeat this for every data file you would like to include in the
batch processing.
Save these scenario files in a separate directory, so you can track them
easily.
2. If you have already defined a set of scenario files, press the ADD button
to choose which scenario files to include. The above displayed dialog box
will appear, cruise to the directory where your scenario files are located and
select the files one by one or select multiple files by clicking the first
scenario file, keeping SHIFT key pressed and clicking on the last scenario
file with the left mouse button. After selecting scenario files click on the
OPEN button.
3.Alternatively you can drag scenario files from the Explorer into the
BATCH PROCESSING dialog box.
4. The BATCH PROCESSING dialog box will be filled with the selected
scenarios. Behind each scenario files you will find the status of the
analysis, which can be TODO, DONE, STOPPED.
5. Now set other options you would like to have automated such as:
Analyze chart
Analyzing multiple charts automatically is the main purpose of batch
processing so normally you would like to have this included.
Print chart
Check the Print chart option to print every chart automatically after it has
been analyzed
Save chart
Check the Save chart option to save every analysis automatically for later
inspection.
Print target clusters


                                     66
Check the Print target clusters to also print the target zones with every
chart automatically.
Maximum number of ELWAVE instances to be used simultaneously
You can start several sessions (increase the number) of ELWAVE, which is
useful for computers running under NT equipped for dual processing.
Otherwise it is advised to leave the setting at its default value.
6. Press the SAVE or SAVE LIST AS… button to save the list of scenarios
you have just defined to include with the batch processing. The next time
you can easily retrieve the same list. Choose LOAD LIST… to do so.
7. Press the START button to start the batch processing.
8. Press the STOP button to halt the batch processing
9. To remove a scenario from the list press the REMOVE button, to remove
them all at once press REMOVE ALL
10. If you press the RESET STATUS button the batch processing status
will be reset to TODO
Other information
While the batch is being processed, it’s still possible to add new files by
dragging them into the window or by using the ADD… button.
While the batch is being processed, it’s also possible to remove all or a
selection of files from the set. Scenarios that were being processed at that
time are stopped before they are removed from the list.
In addition, while the batch is being processed, it’s also possible to change
the maximum number of instances that ELWAVE can use. For example: if
you have a dual-processor system, you may want to run the batch
processor with a maximum of one instance while you are still working on
the system yourself, and switch the batch processor to ‘2’ when you are
going home for the day, leaving the batch processor running.
The ELWAVE Batch Processor can make use of up to 8 processors in a
single system, provided enough memory is available.


                                     67
Scanning
The scanning modules come in two different versions, which are called
SCANNING END-OF-DAY and SCANNING PROFESSONAL.
This way the user can choose how much to add to ELWAVE. Of course
THE SCANNING PROFESSIONAL is the most powerful module that works
not only on end of day data, but on intra day data as well.
Scanning, First Steps
1. Start ELWAVE
2. Choose View from the main menu and select Scan Inspector. The dialog
box of the SCAN INSPECTOR will appear immediately as shown below


3. If you are using the SCAN INSPECTOR for the first time, use the
predefined list to define the items to include in the scan lists. Please note
that you can make as many scan lists as you like. Select the EDIT button
next to SCAN LIST in the upper left corner to add items to your list


                                     68
4. The following SCAN LIST dialog box will appear:


5. Select the NEW button, which will make appear another dialog box to
input the name of the list you would like to make;
6. Press OK and next the ADD button from the SCAN LIST dialog box to
add items to your scan list and repeat this process if you would like to add
more lists.
7. Cruise to the directory that contains the data files of the items you would
like to include
8. Select the items to include, please note that you can add multiple items
by using the special Windows SHIFT and CTRL key combinations. Select
the first item on top of the screen in the Open dialog box, scroll down to the
last item and select it while keeping pressed the SHIFT-key to select all
items at once.
9. Press the OPEN button to return to the SCAN LIST dialog box
10. Press the CLOSE button to return to the SCAN INSPECTOR dialog box
11. Select the EDIT button at the RIGHT upper corner that belongs to
Conditions


                                    69
.

12. Now the EDIT SCAN CONDITIONS dialog box comes up, where you
can define the criteria to scan for. Below you will find an example from the
SCANNING END OF DAY


                                    70
13. Press the NEW button to name your conditions set and start entering
criteria by moving the mouse to the field you would like to specify.
14. Select CLOSE once you have finished entering criteria, which will
return you to the SCAN INSPECTOR dialog box
Press the SCAN NOW button to start scanning your list for the criteria
selected.


                                   71
Automatic Analysis
NOTE: In case the Trading Signals module has been included in the
software package, ELWAVE will make a full automatic interpretation of the
remaining Elliott alternatives and display the results in the SUMMARY
INSPECTOR.

ELWAVE will list the most probable outcome as the very first alternative.
Alternatives that contain very little detail should be dismissed, if they
appear at all.
You will notice that alternatives are ranked according to their probability,
taking into account the probability of the occurrence of a pattern, the
Fibonacci ratios, the scores of the sub patterns and so on. A more detailed
description can be found under the experts’ section.
If most alternatives, that remain with respect to the same time frame (every
wave degree is a time frame!), indicate the same price direction, we
encounter a strong probability that prices will move in the direction of the
forecasted trend. In case - with respect to the same time frame- half of the
alternatives indicate rising prices and half of these predict lower prices,
obviously there is no interesting trading opportunity at hand.
Still you have to inspect thoroughly the different alternatives that are
available. You can inspect alternatives on every wave degree level by
clicking with the right mouse button on the WAVE BUTTON. A dialog box
will appear where you can select the previous and next alternatives. The
alternative that has been numbered 0, has the highest score. Especially
unfinished, mostly extended waves could not (yet) have the highest score,
because relatively fewer data is available compared to finished waves.
Obviously finished waves for example could contain more Fibonacci ratios
and therefore have a higher score, which the unfinished wave could get as
soon as it is more complete.
Still the unfinished waves could be a very probable outcome. For experts it
is advised to sub label every LAST unfinished wave of all unfinished waves
as deep as possible to see if the alternative still holds and how it scores.
Do the same with other alternatives and compare the outcome.
In order to accomplish this you could start with a FAST automatic analysis,
see Analysis options dialog box, select the last unfinished wave in the
WAVE TREE and choose Analyze Selected Wave from the Analyze menu.
Just take a look at the picture in the Targets section following, to get the
general idea.
Alternatively you could insert the main wave labels yourself and start from
there generating an unfinished wave every time, see the Experts
information section.


                                     72
Besides, you could try the different Analysis options to compare their
results. The more detailed the results the fewer counts will be available.
Please pay attention to the following. In general the most detailed chart,
which has labeled more wave degrees, without generating an internal wave
structure violation, is the most probable outcome. If there are other less
detailed alternatives, try to analyze these further down (more wave
degrees) step by step.
If the analysis comes up with a finished wave as the most probable
outcome, always inspect if there is an unfinished alternative and compare
wave detail, scores as well as the sub scores that these scores are
composed of.
Furthermore the software will present the following:
   •   a list of alternatives, the main alternatives of the highest wave
       degree will be displayed as buttons right above the WAVE TREE,
       click on the button and the wave analysis will appear in the chart
       window
   •   a summary of results of a pattern in the WAVE INSPECTOR
   •   the most probable targets based on Fibonacci ratios, taking into
       account that targets differ for each pattern and each wave within a
       pattern, see below
   •   a path of expected price action for the pattern under investigation.
       By selecting the pattern in the WAVE INSPECTOR, ELWAVE will
       show the pattern (using the color of the wave degree), the TARGET
       BARS (using the color of the wave degree) and the SWING FILTER
       in the chart (the light blue line). The pattern also presents one most
       common target for each wave to be reached, based on the ratios of
       already completed waves within the pattern.


                                    73
Targets
As mentioned before targets will be automatically displayed when the chart
has been analyzed by either choosing Analyze entire chart, Analyze
selected wave or Check wave count, provided you have switched on the
display of targets in the WAVE INSPECTOR options. Only targets of
unfinished or incomplete waves are projected!
These unfinished waves display a gray cross in the WAVE BUTTONS of
the WAVE TREE.
These targets are represented in the TARGET BAR , which display the
expected range of the pattern under investigation as a vertical line.


On the vertical line you will notice small horizontal lines, which are the most
probable targets based on Fibonacci price relationships. The positioning of
the target bar at a specific point of the Time (or X-) axis is not relevant.
If 5 wave degrees are unfinished as in the example depicted above, 5
target bars will appear, each in the color of their respective wave degree.
The more these target bars converge to the same range and cluster of
targets, the more likely the targets are.
Of course targets can still be inserted as before by selecting a wave label-
provided you have converted the analysis to manual wave labels-, clicking
the right mouse button and choosing Quick targets.
ELWAVE will insert channels automatically in a smart way, depending on
the progress of the pattern.


Elliott Wave Model
Below we will give some information on the Elliott Wave model used to
generate an analysis automatically.
First of all we would like to emphasize that our software uses a true Elliott
Wave model that incorporates every aspect as required by the Elliott Wave.
The secret of the Elliott Wave is the patterns in patterns concept, which is
fully supported in the software. We mention the following:
Fractals
As described in a later chapter of this manual, Elliott has discovered that
price fluctuations and market action are of a fractal nature. Fractals are
mathematical structures, which on an ever smaller scale infinitely repeat
themselves. The patterns that Elliott discovered are built in the same way.
An impulsive wave, which goes with the main trend, always is composed of
five waves. On a smaller scale, within each of the impulsive waves of the


                                     74
before mentioned impulse, again five waves will be found. In this smaller
pattern, the same pattern repeats itself again and so forth.
Of course this fractal nature enabled us to program the Elliott Wave. The
ever and ever repeating structures or patterns in prices, which are limited in
number, makes it possible to detect which pattern most probably applies
and in which direction the market is headed.
We have defined all standard patterns plus patterns we have discovered in
our extensive research and years of experience (see chapter , the Elliott
Wave Principle.), which have been implemented in our “Modern” rules.
Basic patterns
The Elliott Wave allows for predefined patterns only. This means that only a
limited number of patterns can occur in price charts, each pattern having its
own unique characteristics.
Meticulously, we have defined all these patterns in our rules. Once an
analysis has been generated or checked, you can inspect all the rules and
guidelines that belong to a specific pattern.

Internal structure
Internal structure refers to the internal wave structure or patterns of a
pattern. (Sub)Waves of a pattern may consist of permitted patterns only!.
For instance an impulsive wave 3 can never contain a zigzag pattern, if this
occurs the internal structure of wave 3 is incorrect and therefore the pattern
to which wave 3 belongs is incorrect, and its higher pattern is incorrect and
so on…
In our rules we have defined which patterns are allowed for each wave.
For example, the second or B wave of a flat is allowed to contain a Zigzag,
but not a Triangle, while the 3rd or C wave of a Flat can have an
Extension3 but not a Zigzag pattern.
Proportions
In order to group waves that belong to the same degree, together building a
larger degree pattern, proportions of waves are essential.
Obviously waves of the same degree must approximately have the same
objective measurements in time and / or price. For this purpose we have
developed our proprietary “Fibonacci proportions”, that closely work
together with our home made SWING FILTER, which identifies the major
turning points for every wave degree.


                                    75
Below we first will give an example of wrong proportions and therefore an
incorrect wave count:


Wave 2 is far too small to be of the same degree as wave 4. Using such a
method of counting waves will make it possible to come up with every wave
count imaginable. Unfortunately this aspect seems to be very difficult to
assess objectively. No longer using ELWAVE, which will do an objective
and consistent analysis, recognizing patterns correctly as in the example
below, where wave 2 and wave 4 do belong to each other:


Other selection criteria
Furthermore we mention some of the other criteria that have been used to
determine the wave count:
   •   waves must have enough data points of at least 8 to make it
       possible to define a pattern at all
   •   of the different types of patterns possible in a wave, only the best
       pattern will be maintained. If for example in a wave several impulses
       and Extension3 are validated, only the best impulse and the best
       Extension3 will be listed
   •   in an extended wave where a wave 1 and wave 2 again is followed
       by a wave 1 and 2 of lower degree, at maximum sub wave 1 can be
       a little longer than its parent wave 1


                                   76
• apart from the checks visible in the WAVE INSPECTOR, several
   proprietary checks have been implemented to determine the validity
   of a wave count


                              77
Ranking Alternative Wave Counts
In order to rank alternatives ELWAVE determines the probability of
alternatives that have been validated. Patterns that remain, have a correct
internal structure and satisfy every rule as defined in all sub patterns and
waves.
The scores or probability of every pattern have a relative significance. If
scores of patterns are more or less the same (difference of less than 5
points), they should be regarded to have a more or less equal probability.
A score above 40 should be regarded as relatively high, while a score
under 20 makes a pattern less likely. Of course these scores can still
increase as the pattern progresses.
Every validated wave count gets a score that, among other factors, takes
into account the following:
   •   general probability of the occurrence of patterns, for example one of
       the most frequent encountered patterns is an Extension3 (Extension
       in the 3rd wave)
   •   probability of the occurrence of patterns in a particular wave, f.e. a
       Zigzag in a wave 2 is very common, but less likely in wave 4 of an
       impulsive pattern
   •   Fibonacci Proportions, the more waves have the same
       measurements, the better their scores
   •   Fibonacci Time ratios, the more and better Fibonacci time
       relationships can be found, the higher the score
   •   Fibonacci Price ratios, the more and better Fibonacci price
       relationships can be found, the higher the score
   •   guidelines, the more guidelines are satisfied, the higher the score of
       a pattern
   • scores of sub waves and sub patterns, the better sub waves of a
       wave score on all of the above mentioned aspects, the higher the
       total score.


                                     78
Inspecting Alternative Wave Counts
On every wave degree alternative wave counts can be inspected. The main
alternatives of the highest wave degree or time frame are listed in the
WAVE TREE. In order to investigate alternatives of sub waves, click on the
WAVE BUTTON in the WAVE TREE and expand the WAVE TREE if
necessary. Next click with the right (not the left!) mouse button on that
WAVE BUTTON and a list of alternatives for this wave will appear.
Selecting one of these alternatives will display the alternative in the chart.
This can be repeated for every wave that has been listed in the WAVE
TREE. Remember that always the best alternative on every wave degree
will be listed on top.
Nevertheless it could be possible that a less probable alternative wave
count or pattern ends up to be the one markets are following.


                                    79
Multiple Time Frames
As known to experienced traders, each time frame has its own
characteristics such as trend, volatility and momentum as well as support
and resistance areas. The shorter the time frame you are able to assess
correctly, the earlier you will get signals for the larger trend of which the
shorter trend takes part.
Obviously you need to inspect multiple time frames using a consistent and
objective methodology. That is exactly one of the strengths of the Elliott
Wave provided it is applied correctly.

The Elliott Wave is nothing but clearly picturing multiple time frames, since
it is composed of patterns in patterns, where the shorter-term patterns give
precious information on the larger pattern in progress and every pattern
from small to large covers a specific time frame.
What’s more, using its SWING FILTER ELWAVE will automatically group
waves together that belong to the same time frame, which in Elliott Wave
terms are referred to as wave degrees.

ELWAVE includes an Automatic compression option, which is very
convenient to use in conjunction with the WAVE TREE. If you disable
automatic compression the WAVE TREE will no longer clearly present the
attached time frames.

Thereby ELWAVE automatically finds the time frames or wave degrees that
are of value in a particular price movement. Normally a trader has to try
multiple time compression settings from monthly to weekly, daily, hourly, 15
minutes etc., in order to find the time frames that apply, being aware of the
fact that time frames vary from time to time.
The wave degrees ELWAVE will come up with, will show the multiple time
frames that are in existence for this market or stock. Activating the highest
wave degree, by clicking on the WAVE BUTTON of the pattern of largest
degree in the WAVE TREE, will show the largest trend or time frame
immediately. Clicking on one of the buttons of the sub waves of this pattern
will present the lower time frame and so on, down to the smallest time
frame in existence.


                                     80
Converting Automatic Wave Counts to Manual Counts
You can convert the selected alternative from the automatically generated
wave counts by choosing Convert to Wave Count from the Analyze menu.
The manual wave count will appear in a separate chart document. You can
convert to a manual wave count as many times as you like. In order to save
an alternative as a scenario, choose from the main menu File and select
Save as to save the wave count as a scenario.


                                  81
Analysis Options
You can adjust important variables that determine the outcome of an
Automatic analysis, by changing the default setup. Select one of the
presettings presented.
The following settings are available (version 6.0):
Pattern definitions
You can choose either the CLASSIC or the MODERN RULES version. The
Classic version adheres to a very strict interpretation of the Elliott Wave
Analysis Type
By choosing one of the presettings you will set the detail of the SWING
FILTER as well as the analysis depth or number of wave degrees to
inspect. The SWING FILTER will search for major turning points for every
wave degree, grouping waves of the same degree together.
If you instruct ELWAVE to use a more detailed analysis, the SWING
FILTER will find more turning points automatically, revealing more
variations of possible wave counts. By default the SWING FILTER (pale
blue line) will be shown in the chart by clicking on a button of the WAVE
TREE, select pattern in chart in the WAVE INSPECTOR for switching it on
or off.
FAST
this will produce a wave count of three wave degrees very fast using a
SWING FILTER that identifies the major turning points only.
DETAILED
again a three wave degrees deep analysis is produced, but this time the
SWING FILTER will search for a lot more turning points (around 8) at the
highest wave degree level. This option produces many alternatives and we
advise this to be used by experts only, who can eliminate alternatives
themselves.
PRECISE
using this setting a detailed SWING FILTER will inspect patterns four wave
degrees deep and use a lot more turning points to inspect many more
alternatives.

Below an example of an analysis depth of 3 wave degrees in wave 3 is
shown. The pattern is called an Extension3 since the 3rd wave is extended.
This pattern must consist of 5 waves, which is correct.


                                    82
Extra wave degrees
Adjusting this option allows for automatically adding extra time frames or
wave degrees during the analysis. It will analyze the most recent price data
in more detail giving more information on the smallest patterns in patterns.
The more extra time frames you require, the more time it will take to
complete the analysis.
Minimum Bars
Enough bars or data points must be available in order to recognize reliable
Elliott Patterns. If Minimum bars has been set to 20, the software will return
an undefined pattern if it encounters less then 20 bars in a pattern. We
recommend setting this option to 8 bars for End of Day charts. Of course
ELWAVE will allow you to adjust settings in order to get results faster,
detect more complicated patterns or to get a more detailed result.


                                    83
Analysis Example
In this section we will give another example of generating an Automatic
analysis.
Once an analysis has been generated the WAVE TREE, the WAVE
INSPECTOR and the chart with its current wave count will be displayed.
Now it is possible to further inspect and analyze the wave count that has
been generated. Click on a WAVE BUTTON in the WAVE TREE to inspect
and display that section of the chart. The chart will zoom in and display
correct detail automatically. The WAVE INSPECTOR will give a lot of
information on the wave or pattern selected. On top at the left, the WAVE
INSPECTOR will show validated patterns at the right dismissed patterns.
Both can be inspected, as you like.
Click on the pattern to display all information in the WAVE INSPECTOR,
which feature makes the Elliott Wave completely transparent. The pattern
has been described, the internal structure of the pattern has been checked,
all Fibonacci ratios are presented and rules as well as guidelines can be
inspected. Clicking one of these rules or guidelines will visualize it in the
chart.


For more information, see the next chapter, where WAVE TREE and
WAVE INSPECTOR have been explained in more detail.


                                    84
Traders worldmagazine elliott_wave_unveiled_www.dl4all.com

Mais conteúdo relacionado

Mais procurados

Elliott Waves Strategies
Elliott Waves StrategiesElliott Waves Strategies
Elliott Waves StrategiesBoris Fesenko
 
Section 3 - Chapter 17 - Elliot Wave Trading Strategies
Section 3 - Chapter 17 - Elliot Wave Trading StrategiesSection 3 - Chapter 17 - Elliot Wave Trading Strategies
Section 3 - Chapter 17 - Elliot Wave Trading StrategiesProfessional Training Academy
 
Trade like pro supply & demand
Trade like pro supply & demandTrade like pro supply & demand
Trade like pro supply & demandalkaserr
 
Visual guide to elliott wave trading ( pdf drive )
Visual guide to elliott wave trading ( pdf drive )Visual guide to elliott wave trading ( pdf drive )
Visual guide to elliott wave trading ( pdf drive )wijitha gayan
 
Fibonacci retracement level
Fibonacci retracement levelFibonacci retracement level
Fibonacci retracement levelpipsumo traderfx
 
Scalping in Day Trading
Scalping in Day TradingScalping in Day Trading
Scalping in Day TradingInvestingTips
 
LC's Forex Trading System
LC's Forex Trading SystemLC's Forex Trading System
LC's Forex Trading Systemlcchong76
 
Elliott wave dna by nicola delic
Elliott wave dna by nicola delicElliott wave dna by nicola delic
Elliott wave dna by nicola delicNicola Delic
 
Price action trading1
Price action trading1Price action trading1
Price action trading1labyo
 
Simple scalping secret strategy
Simple scalping secret strategySimple scalping secret strategy
Simple scalping secret strategyHeri Valiant
 
The Ultimate Technicals Analysis
The Ultimate Technicals AnalysisThe Ultimate Technicals Analysis
The Ultimate Technicals AnalysisIwan Suryadi
 
Trade Forex From Home - 10 Biggest Mistakes New Forex Traders Make (And How T...
Trade Forex From Home - 10 Biggest Mistakes New Forex Traders Make (And How T...Trade Forex From Home - 10 Biggest Mistakes New Forex Traders Make (And How T...
Trade Forex From Home - 10 Biggest Mistakes New Forex Traders Make (And How T...ForexTraining
 
How To Swing Trade Stocks For Consistent Profits
How To Swing Trade Stocks For Consistent ProfitsHow To Swing Trade Stocks For Consistent Profits
How To Swing Trade Stocks For Consistent ProfitsMorpheus Trading Group
 
Magic Breakout Forex Trading Strategy PDF eBook
Magic Breakout Forex Trading Strategy PDF eBookMagic Breakout Forex Trading Strategy PDF eBook
Magic Breakout Forex Trading Strategy PDF eBookeforexcourse web
 
High Probability Trading Setups
High Probability Trading SetupsHigh Probability Trading Setups
High Probability Trading Setupsbtrader
 
Elliott waves principle key to market behavior a. j. frost , robert prechter...
Elliott waves principle  key to market behavior a. j. frost , robert prechter...Elliott waves principle  key to market behavior a. j. frost , robert prechter...
Elliott waves principle key to market behavior a. j. frost , robert prechter...wijitha gayan
 

Mais procurados (20)

Elliott Waves Strategies
Elliott Waves StrategiesElliott Waves Strategies
Elliott Waves Strategies
 
Section 3 - Chapter 17 - Elliot Wave Trading Strategies
Section 3 - Chapter 17 - Elliot Wave Trading StrategiesSection 3 - Chapter 17 - Elliot Wave Trading Strategies
Section 3 - Chapter 17 - Elliot Wave Trading Strategies
 
Trade like pro supply & demand
Trade like pro supply & demandTrade like pro supply & demand
Trade like pro supply & demand
 
Visual guide to elliott wave trading ( pdf drive )
Visual guide to elliott wave trading ( pdf drive )Visual guide to elliott wave trading ( pdf drive )
Visual guide to elliott wave trading ( pdf drive )
 
Fibonacci retracement level
Fibonacci retracement levelFibonacci retracement level
Fibonacci retracement level
 
Scalping in Day Trading
Scalping in Day TradingScalping in Day Trading
Scalping in Day Trading
 
LC's Forex Trading System
LC's Forex Trading SystemLC's Forex Trading System
LC's Forex Trading System
 
Elliott-wave
Elliott-waveElliott-wave
Elliott-wave
 
Elliott wave dna by nicola delic
Elliott wave dna by nicola delicElliott wave dna by nicola delic
Elliott wave dna by nicola delic
 
Price action trading1
Price action trading1Price action trading1
Price action trading1
 
Simple scalping secret strategy
Simple scalping secret strategySimple scalping secret strategy
Simple scalping secret strategy
 
Forex trading strategies
Forex trading strategiesForex trading strategies
Forex trading strategies
 
The Ultimate Technicals Analysis
The Ultimate Technicals AnalysisThe Ultimate Technicals Analysis
The Ultimate Technicals Analysis
 
Trade Forex From Home - 10 Biggest Mistakes New Forex Traders Make (And How T...
Trade Forex From Home - 10 Biggest Mistakes New Forex Traders Make (And How T...Trade Forex From Home - 10 Biggest Mistakes New Forex Traders Make (And How T...
Trade Forex From Home - 10 Biggest Mistakes New Forex Traders Make (And How T...
 
my fox
my fox my fox
my fox
 
How To Swing Trade Stocks For Consistent Profits
How To Swing Trade Stocks For Consistent ProfitsHow To Swing Trade Stocks For Consistent Profits
How To Swing Trade Stocks For Consistent Profits
 
Magic Breakout Forex Trading Strategy PDF eBook
Magic Breakout Forex Trading Strategy PDF eBookMagic Breakout Forex Trading Strategy PDF eBook
Magic Breakout Forex Trading Strategy PDF eBook
 
High Probability Trading Setups
High Probability Trading SetupsHigh Probability Trading Setups
High Probability Trading Setups
 
Trading plan
Trading planTrading plan
Trading plan
 
Elliott waves principle key to market behavior a. j. frost , robert prechter...
Elliott waves principle  key to market behavior a. j. frost , robert prechter...Elliott waves principle  key to market behavior a. j. frost , robert prechter...
Elliott waves principle key to market behavior a. j. frost , robert prechter...
 

Semelhante a Traders worldmagazine elliott_wave_unveiled_www.dl4all.com

84074990 4590219-elliot-wave
84074990 4590219-elliot-wave84074990 4590219-elliot-wave
84074990 4590219-elliot-waveRoberto Vignozzi
 
Introduction to the elliott wave theory
Introduction to the elliott wave theoryIntroduction to the elliott wave theory
Introduction to the elliott wave theoryAshMoyo1
 
Elliot wave (SSFX Knowledge CEnter)
Elliot wave (SSFX Knowledge CEnter)Elliot wave (SSFX Knowledge CEnter)
Elliot wave (SSFX Knowledge CEnter)dhruvwilliams
 
Elliott wave-principle
Elliott wave-principleElliott wave-principle
Elliott wave-principlewijitha gayan
 
The Basics Of Elliot Wave Principle - Robert R Prechter.pdf
The Basics Of Elliot Wave Principle - Robert R Prechter.pdfThe Basics Of Elliot Wave Principle - Robert R Prechter.pdf
The Basics Of Elliot Wave Principle - Robert R Prechter.pdfshabeehula
 
Elliott wave analysis
Elliott wave analysisElliott wave analysis
Elliott wave analysisypendharkar
 
Fibonacci turning points part 1
Fibonacci turning points part 1Fibonacci turning points part 1
Fibonacci turning points part 1Elliott Wave
 
Technical analysis
Technical analysisTechnical analysis
Technical analysisapunrohit
 
How to use Elliott Wave Effectively
How to use Elliott Wave EffectivelyHow to use Elliott Wave Effectively
How to use Elliott Wave EffectivelyRafaelVeiga34
 
X3 pattern framework for the day trader in the financial market
X3 pattern framework for the day trader in the financial marketX3 pattern framework for the day trader in the financial market
X3 pattern framework for the day trader in the financial marketLeadingTrader21
 
Identifying order and disorder in chaotic market with elliott wave trend
Identifying order and disorder in chaotic market with elliott wave trendIdentifying order and disorder in chaotic market with elliott wave trend
Identifying order and disorder in chaotic market with elliott wave trendLeadingTrader21
 
AnalysisTechnical Analysis PPT @ MBABECDOMS
AnalysisTechnical Analysis PPT @ MBABECDOMSAnalysisTechnical Analysis PPT @ MBABECDOMS
AnalysisTechnical Analysis PPT @ MBABECDOMSBabasab Patil
 

Semelhante a Traders worldmagazine elliott_wave_unveiled_www.dl4all.com (20)

84074990 4590219-elliot-wave
84074990 4590219-elliot-wave84074990 4590219-elliot-wave
84074990 4590219-elliot-wave
 
Introduction to the elliott wave theory
Introduction to the elliott wave theoryIntroduction to the elliott wave theory
Introduction to the elliott wave theory
 
Elliot wave
Elliot waveElliot wave
Elliot wave
 
Elliot wave (SSFX Knowledge CEnter)
Elliot wave (SSFX Knowledge CEnter)Elliot wave (SSFX Knowledge CEnter)
Elliot wave (SSFX Knowledge CEnter)
 
Elliott wave-principle
Elliott wave-principleElliott wave-principle
Elliott wave-principle
 
The Basics Of Elliot Wave Principle - Robert R Prechter.pdf
The Basics Of Elliot Wave Principle - Robert R Prechter.pdfThe Basics Of Elliot Wave Principle - Robert R Prechter.pdf
The Basics Of Elliot Wave Principle - Robert R Prechter.pdf
 
Section 3 - Chapter 16 Part I - Elliot Wave Basics
Section 3 - Chapter 16 Part I - Elliot Wave BasicsSection 3 - Chapter 16 Part I - Elliot Wave Basics
Section 3 - Chapter 16 Part I - Elliot Wave Basics
 
Elliott wave analysis
Elliott wave analysisElliott wave analysis
Elliott wave analysis
 
Fibonacci turning points part 1
Fibonacci turning points part 1Fibonacci turning points part 1
Fibonacci turning points part 1
 
Technical analysis
Technical analysisTechnical analysis
Technical analysis
 
Bitcoin Elliott Wave Count
Bitcoin Elliott Wave CountBitcoin Elliott Wave Count
Bitcoin Elliott Wave Count
 
Elliot waves
Elliot waves Elliot waves
Elliot waves
 
How to use Elliott Wave Effectively
How to use Elliott Wave EffectivelyHow to use Elliott Wave Effectively
How to use Elliott Wave Effectively
 
Forex Autopilot
Forex AutopilotForex Autopilot
Forex Autopilot
 
Bitcoin Wave Ratios
Bitcoin Wave RatiosBitcoin Wave Ratios
Bitcoin Wave Ratios
 
X3 pattern framework for the day trader in the financial market
X3 pattern framework for the day trader in the financial marketX3 pattern framework for the day trader in the financial market
X3 pattern framework for the day trader in the financial market
 
Fm1 unit2 conti..
Fm1 unit2 conti..Fm1 unit2 conti..
Fm1 unit2 conti..
 
Complex correction
Complex correctionComplex correction
Complex correction
 
Identifying order and disorder in chaotic market with elliott wave trend
Identifying order and disorder in chaotic market with elliott wave trendIdentifying order and disorder in chaotic market with elliott wave trend
Identifying order and disorder in chaotic market with elliott wave trend
 
AnalysisTechnical Analysis PPT @ MBABECDOMS
AnalysisTechnical Analysis PPT @ MBABECDOMSAnalysisTechnical Analysis PPT @ MBABECDOMS
AnalysisTechnical Analysis PPT @ MBABECDOMS
 

Traders worldmagazine elliott_wave_unveiled_www.dl4all.com

  • 1. Traders World Magazine In cooperation with Prognosis Software Development Some parts of this book are copyrighted to Prognosis Software Development
  • 2. Copyright 2001 by Halliker’s, Inc., dba Traders World No part of this publication may be reproduced, stored in a retrieval system or transmitted in any form or by any means, electronic, mechanical, photocopying, recording, scanning or otherwise, except as permitted under Sections 107 or 108 of the 1976 United Stated Copyright Act, without either the prior written permission of the Publisher, or authorization through payment of the appropriate per-copy fee to the Copyright Clearance Center, 222 Rosewood Drive, Danvers, MA 01923, (978) 750-8400, fax (978) 750-4744. Requests to the Publisher for permission should be addressed to the Permissions Department, Halliker’s, Inc. 2508 W. Grayrock St, Springfield, MO 65810. (417) 882-9697, Fax (417)886-5180. E-Mail: publisher@tradersworld.com Parts of this book came from the ELWAVE software manual produced by Prognosis Software Development. This publication is written to provide accurate information in regard to the subject matter covered. It is sold with the understanding that the publisher is not engaged in rendering professional services. If professional advice or other expert assistance is required, the services of a competent professional person should be sought. To receive a password for the Internet Support Site for the Book via E-Mail: publisher@tradersworld.com CAVEAT: It should be noted that all commodity trades, patterns, charts, systems, etc., discussed in this book are for illustrative purposes only and are not to be considered as specific advisory recommendations. Further note that no method of trading or investing is foolproof or without difficulty, and past performance is no guarantee of future performance. All ideas and material presented are entirely those of the author and do not reflect those of the publisher or bookseller. Library of Congress Cataloging-in-Publication Data: Printed in the United States of America 2
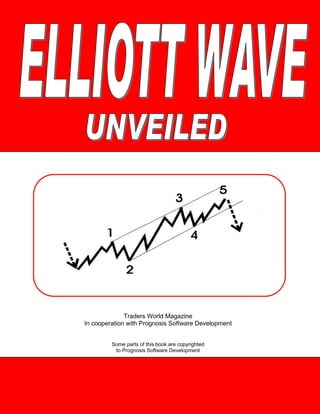
  • 3. Introduction R.N. Elliott developed Elliott Wave Theory in the 1920’s. Mr. Elliott discovered there is no chaos in the markets, but on the contrary this is a natural order in the markets that manifests it self in wave patterns, which continually repeat themselves. These wave patterns continually repeat themselves over and over again in the markets. The wave patterns are also fractal in nature, which means that you can subdivide these waves into smaller and smaller waves and they was have the same pattern, just a different degree. In the 1970’s the Elliott Wave Principal was extremely popular because of books published by Prechter and Frost. The most famous book they published was “The Elliott Wave Principle…key to stock market profits” in 1978. Robert Prechter was extremely popular and was frequently interviewed by the news media during the time. He predicted the bull market of the time and even the crash of 1987. The secret of the Elliott Wave Theory is to learn how to correctly detect these wave patterns that tend to occur over and over again in the markets. These wave patterns can be divided into basically two kinds, the trending wave and the non-trending wave. Some people call them impulse waves and corrective waves. The markets tend to trend only 20% of the time and they go into corrections 80% of the time. The impulse wave has five price movements. Three of them are in the direction of the market and two of them are in the opposite direction of the market. See Fig. 1. Fig. 1 3
  • 4. These five waves can also be broken down into smaller waves. Each impulse wave has five waves and each correction has 3 waves. See Fig. 2. Fig. 2 The corrective waves can also be broken down into a smaller degree. Waves A and C are in the direction of the reaction. This would illustrate the reaction in a bullish trend. See Fig. 3. Fig. 3 4
  • 5. It should be very easy now to distinguish between the trends of the market and the corrections. See Fig 4. Also it’s important to understand the concept that the wave structure of the large degree is composed of the same wave structure in the smaller degree. Fig. 4 5
  • 6. The following are the wave degrees the most Elliott Wave Technicians follow: You must remember that the possible number of wave degrees is infinite. You can only trade so many waves down. The smallest detectable wave pattern would be using a 1 minute bar chart. The advantage of having different degrees of waves is that you can trade the degree that you are most comfortable with. Day-traders might trade the Sub Minuette Wave Degree and intermediate investors might use the Primary Wave Degree to trade. 6
  • 7. Patterns Recognizing the patterns of the waves as they are developing is the most important thing you can do. Many Elliott Wave technicians can correctly analyze a completed chart with the correct patterns, but what good does that do. You need to do it as it is happening. You can correctly determine the where you are in the Elliott Wave pattern, as it is unfolding, it will tell you the levels the market will rise or fall to. That’s the importance of the Elliott Wave theory. The unique software ELWAVE gives you the Elliott Wave patterns automatically so you can better trade the markets. Classic Patterns vs. Modern Elliott Wave Patterns There are two versions of the Elliott Wave Theory. One is the classic version brought out by Elliott and the modern version that Prognosis Software Development found after 10 years of research and experience. You will have to experiment which each of the markets to determine which set of patterns to use. The ELWAVE software program makes it easy to do. You can select which to use with just a click of the mouse button. Now let’s look at the various Elliott Wave Patterns in a very strict manner according to the rules followed by Elliott Wave technicians: 7
  • 8. Trends a. Impulse Pattern Fig. 5 Description Impulse waves are composed of five waves labeled 1,2,3,4,5. Waves 1, 3, 5 are themselves impulse waves. Waves 1, 3, 5 are usually equal in length. Waves 2 and 4 are corrective waves. Rules and Guidelines Wave 2 cannot be longer in price than wave 1. It can’t go beyond the origin of wave 1. Wave 3 is never the shortest when compared to waves 1 and 5. Wave 4 cannot overlap wave 1. Exception, diagonal triangles. The third wave usually shows the highest momentum. Exception, when the fifth wave is the extended wave. In Which Wave Impulse patterns occur in wave 1, 3, 5 and waves A and C Internal Structure Composed of five waves 5-3-5-3-5 8
  • 9. Trends b. Extension Pattern Fig. 6 Description An extension occurs in a impulse wave. It can be wave 1, 3, or 5 Usually one of these waves is extended. Normally the third wave is the extended wave. The other two waves are normally equal in length. Rules Extended waves are composed of 5, 9, 13 or 17 waves. Wave 2 can’t be long in price distance than wave 1. Wave 3 is never the shortest when compared to wave 1 and 5. Wave 4 can’t overlap wave 1. Wave 5 exceeds the end of wave 3. The extended wave normally shows the highest acceleration. In Which Wave Extensions occur in wave 1, 3, 5 and in A and C waves. Internal Structure Minimum number of waves of an extended wave is 9, 13 or 17. Minimum internal structure of 9 waves is 5-3-5-3-5-3-5-3-5. 9
  • 10. Trends c. Diagonal Triangle Type 1 Pattern Fig. 7 Description Diagonals are impulse patterns. They occur in terminal waves like fifth or a C wave. Diagonals are relatively rare. They occur a lot in lower wave degree charts. Usually they are followed by a violent change. Rules and Guidelines It is composed of 5 waves. Waves 4 and 1 do overlap. Wave 4 can’t go beyond the origin of wave 3. Wave 3 can’t be the shortest wave. Internally all waves of the diagonal have a corrective structure. Wave 1 is the longest wave and wave 5 the shortest. The Channel lines of Diagonals must converge The internal wave structure should show alternation. 10
  • 11. In Which Wave Diagonal triangles type 2 occur in waves 1 and A. Internal Structure The five waves of the diagonal type 2 show an internal structure of 5-3-5-3- 5. Trends th d. Failure or Truncated 5 Pattern Fig. 8 Description Impulse wave in which the fifth doesn’t extend beyond the third. Fifth wave goes only slightly beyond the third wave. Classified as a failure wave. Trend is week and will accelerate in opposite direction. Rules and Guidelines Wave 2 can’t be longer in price than wave 1. Wave 2 can’t go beyond the origin of wave1. Wave 4 can’t overlap wave 1 or A. Wave 5 fails to go beyond the end of wave 3. Wave 3 shows the highest momentum. Internal wave structure should show alternation. Internal Structure It must be composed of five waves. 11
  • 12. Corrections a. Zigzag Pattern Fig. 9 Description The most common corrective wave structure. Begins with a sharp reversal. It looks like an impulsive wave Can extend into a double or triple zigzag. (not common) Rules and Guidelines Composed of 3 waves Wave A and C are impulses, Wave B is corrective. The B wave retraces no more than 61.8% of A The C wave must go beyond the end of A The C wave normally is at least equal to A In Which Wave Most of time it happens in A, X or 2. Also common in B waves or part of a Flat or Triangles or in 4. Internal Structure Internal structure of the 3 waves is 5-3-5 in a single Zigzag, 5-3-5-3-5-3-5 in a double. 12
  • 13. Corrections Example of a Double Zigzag Fig. 10 The above is a modern representation of the Double Zigzag using the labels WXY instead of ABCXABC. This is more consistent because this way 2 zigzags of lower degree get corrected to each other by waves of higher degree. 13
  • 14. Corrections b. Flat Pattern Fig. 11 Description Flats are very common form of correction patterns. Shows sideways direction. Waves A and B of the Flat are both corrective patterns. Wave C is an impulse pattern. Normally eave C will not go far beyond the end of wave A. Rules and Guidelines It is composed of 3 waves. Wave C is an impulse, Wave A and B are corrective. Wave B retraces more than 61.8% of A Wave B shows a common retracement to the end of previous wave. Wave C shouldn’t go far beyond the end of A Normally wave C is at least equal to A. In Which Wave It occurs mostly in B waves, also common in 4 and 2. Internal Structure The internal structure of these waves is 3-3-5. Both waves A and B are normally Zigzags. 14
  • 15. Corrections c. Expanded Flat or Irregular Flat Fig. 12 Description This is a common special type of a Flat. B wave is extended and goes beyond the end of the previous wave. The B wave has a lot of strength and shows the direction of B. Strong acceleration is present which starts the 3rd or 5th wave. If C wave is much longer than A, the strength will be less. Rules and Guidelines It is composed of 3 waves. Wave C is an impulse, wave A and B are corrective. Wave B retraces beyond the end of the previous impulse wave A. The C wave normally is much longer than A. In Which Wave Can happen in 2, 4, B and X. It can happen in 2 and C is relatively short, normally an acceleration in the third will take place. Internal Structure Composed of five waves, which has a structure of 3-3-5-5. 15
  • 16. Corrections d. Triangles (Contracting) Pattern Fig. 13 Description A triangle is a corrective pattern, which can contract or expand. It can ascend or descent. It is composed of five waves; each of them has a corrective nature. Rules and Guidelines It is composed of 5 waves. Wave 4 and 1 do not overlap. Wave 4 can’t go beyond the origin of wave 3 Internally all waves have a corrective wave structure. Wave 1 is the longest wave and wave 5 is the shortest. In Which Wave Triangles occur in wave B, X and 4, never in wave 2 or A. Internal Structure It is composed of fives waves, internal structure 3-3-3-3-3. 16
  • 17. Corrections Expanding Triangle Pattern Fig. 14 Ascending Triangle This triangle slopes upwards. This pattern has been implements in Modern Rules. Descending Triangle This is a triangle, which slopes downwards. This pattern has been implemented in modern rules. Running Triangle This is a triangle where the B wave exceeds the origin of wave A. 17
  • 18. Corrections e. WXY or Combination Pattern Fig. 15 Description Combines several types of corrections. Labeled WXY and WXYXZ. Rules and Guidelines Forms small patterns to make a larger one. The triangle should normally appear at the end. In Which Way Generally a combination occurs mostly in B, X and 4. Less common in A and rare in 2. Internal Structure A Zigzag followed by a flat, followed by a Triangle has the following internal structure. 5-3-5 (Zigzag)-5-3-3-5 18
  • 19. Corrections f. Running Flat Pattern Fig. 16 Description Rare form of a failure. Kind of a Flat with elongated B wave and very small C wave. ELWAVE doesn’t accept a C wave that fails to reach wave A. This could be an extension in an impulse wave. If B is a clear three wave, then it is a running correction. The market will explode in the direction of the B wave. Rules and Guidelines The B wave must be composed of three waves. The C wave must be composed of five waves. Wave C must be very short and not reach wave A. Wave C must retrace less than 100% of wave B. Wave C must retrace more than 60% of wave A. In Which Wave Most of the time it should occur in wave 2 or B. Internal Structure It is a three-wave structure 3-3-5. 19
  • 20. Modern Elliott Wave Patterns In the Modern Rules ELWAVE engine the program has defined extra pattern that are mostly hybrid patterns derived from the known patterns that have existed from the beginning. In addition the program allows for occurrence of more patterns in some wave. For example, wave 1 may also contain a diagonal 1, diagonal 2 and impulse 2 pattern, next to the other trend patterns, that a classic interpretation accepts. 20
  • 21. Trends a. Impulse 2 Fig. 17 Description An impulse 2 is an uncommon pattern. ELWAVE allows for a maximum retrace of 51.5% for wave 4. Sometimes the retrace of wave 4 could be 51.6%. Rules and Guidelines The same rules and guidelines apply as with a normal impulse except for the following: Wave 4 is allowed to retrace in between 51.5% and 62%. Must not penetrate the region of wave 1. As a guideline, wave 4 very often is a Zigzag. In Which Wave Impulse 2 patterns occur in wave 1, A or C, never in wave 3. Internal Structure It is composed of five waves 5-3-5-3-5. The mentioned 3’s are corrective waves. 21
  • 22. Corrections Impulse 2 Fig. 18 Description Apart from contracting triangles, a failure in a corrective pattern happens when the C wave is shorter than wave A and fails to go beyond the end of A. Happens in running flats or in zigzags. Indicated strength in the direction of the main trend. Rules and Guidelines The rules as mentioned with other corrective patterns apply. Wave C fails to go beyond the end of wave A. In Which Wave Failures can occur in a C wave 2, in a C or E wave of 4 in a C wave of B or X. 22
  • 23. Corrections b. Failed Flat Pattern Fig. 19 Description This pattern is exactly the same as a Flat, except for the fact the wave C does not reach the end of wave A and therefore is shorter than wave B. 23
  • 24. Corrections c. Running Flat (modern) Pattern Fig. 20 Description This pattern is exactly the same as a Running Flat, except for the fact that it must retrace more than 60%, of not ELWAVE considers it to be a normal Running Flat. This distinction is necessary, because normally a Running Flat is rare. But if it retraces more than 60% and still fails to race the end of wave A, it suddenly becomes a much more probable pattern to occur. In that case it will get a much higher score. 24
  • 25. Channeling This is an important tool to determine which subwaves belong together and to project targets for the next wave up. Channels are parallel lines, which contain complete price moves. Trendlines of triangles are also considered a channel. The following is an example of a channel in impulse wave and a channel in corrective waves. Fig. 21 Waves of the same degree can be recognized by drawing channels. Especially this is the case for Impulse (5) wave structures, Zigzags and Triangles. If these waves do not fit properly, you have a strong indication to search for an alternative count. 25
  • 26. Targets for Wave 3 or C To begin with you can draw a channel as soon as wave 1 and 2 are finished. Connect the origin of wave 1, which has been labeled as zero, and the end of wave 2. then draw a parallel line from the top of wave 1. Generally this channel is regarded as not being very useful, but it is, First of all the parallel line services as a absolute minimum target for the 3rd wave under development. If the 3rd wave can’t break through the upper line or fails to reach it, you are probably dealing with a C wave instead of wave 3. Furthermore the base line from 0 to wave 2 serves as a stop. When this base line gets broken, there is a strong probability that wave 2 (or B) gets more complex, thus wave 3 or C has not begun yet. Keep in mind that wave 3 is normally the strongest wave and often will go far beyond the upper trend line. Fig. 22 26
  • 27. Targets for Wave 4 As soon as wave 3 has finished you can draw a channel connecting the end of wave 1 and wave 3 with a trend line and drawing a parallel line from the end of wave 2. by Doing this you can project a target for wave 4. Keep in mind that normally the base line from wave 3 will be broken slightly by the price action of wave 4. If wave 4 doesn’t come near the base line at all this is a sign of a very strong trend. You are probably still in wave 3 or your should get ready to a blow off in wave 5. Fig. 23 27
  • 28. Targets for Wave 5 Method 1 As soon as wave 4 has finished you can draw a channel connecting the end of wave 2 and wave 4 with a trend line and draw a parallel line from the end of wave 3 and project upward to wave 5. This is your target for wave 5. This would be for a normal wave 5. An extended wave 5 would push higher. It the price fails to hit the projected trend line to wave 5 then the market is weak and you should look for a sell off. Fig. 24 28
  • 29. Targets for Wave 5 Method 2 Mostly wave 3 is the strongest wave showing a very fast acceleration relative to wave 1 and 5. If wave 3 indeed shows a nearly vertical rise or decline, then draw a trend line-connecting wave 2 and 4 and draw a parallel line from wave 1. This parallel line will cut through wave 3 and will target wave 5. Experience shows this is a very valuable channel. Fig. 25 29
  • 30. Targets for Wave D and E As soon as wave B has finished you can draw a trend line connecting the origin of wave A and the end of wave B to get a target for wave D, provided a triangle indeed is developing, which is more certain after completion of wave C. As soon as wave C has finished you can craw a trend line connecting wave A and the end of wave C to get a target for wave E almost never stops at the trend line precisely, it either never reaches the trend line or it overshoots the trend line fast and temporarily. Fig. 26 30
  • 31. Targets in a Double Zigzag Drawing a channel is very useful to separate Double Zigzags from impulsive waves, which is difficult since both have impulsive characteristics. Double Zigzags tend to fit a channel almost perfect, while in an impulsive wave the third wave clearly breaks out of the channel. Fig. 27 31
  • 32. Fibonacci Ratios The Fibonacci series are a mathematical sequence in which any number is the sum of the two preceding numbers. The sequence goes as follows: 1, 2, 3, 5, 8, 13, 21, 34, 55, 89, 144 and so on. The properties of this sequence appear throughout nature and in the arts and science. Most notable is the ratio of 1.618 which is called the “Golden Mean”. It was discovered even in ancient times. The number can be approached by dividing a Fibonacci number by its preceding number as the sequence extends into infinity. The ratio of .618 is also very prominent when analyzing Fibonacci relationships. The wave counts of the impulse and corrective patterns 5 + 3 = 8 are Fibonacci numbers. Analyzing Fibonacci relationships between price movements is important for several reasons: 1) You can control your wave analysis. 2) The better the Fibonacci ratios of your wave count, the more accurate your count is, because in some way or the other all waves are related to each other. 3) You can project realistic targets once you have distinguished different scenarios, which point in the same direction. 4) Since Fibonacci manifests itself in the proportions of one wave to another, waves are often related to each other by the ratios of 2.618, 1.618, 1, 0.618, 0.382 and 0.236. This fact can help you in estimating price targets for expected waves. If , for example a wave 1 or A of any degree has been completed, you can project retracements of 0.382, 0.50 and .618 for wave 2 or B, which will give you your targets. 5) Most of the time the third wave is the strongest, so often you will find that wave 3 is approximately 1.618 times wave 1. 6) Wave 4 normally shows a retracement, which is less than wave 2, like 0.236 or 0.382. If wave three is the longest wave, the relationship between wave 5 and three often is 0.618. 7) Also wave 5 equals wave 1 most of the time. 8) The same relationship can be found between A and C waves. Normally C equals A or is 1.618 times the length of A. 9) You can even combine waves to find support and resistance zones. For example the next price movement of wave 1 and 3 times 0.618 creates another interesting target for wave 5. 10) It is worthwhile to experiment a lot with your wave count, Fibonacci will help you to solve the rhythm of the markets. 32
  • 33. Targets Wave 1 The first wave of a new impulsive price movement tends to stop at the base of the previous correction, which is the B wave. The often coincides with a 38.2% or a 61.8% retracement of the previous correction. Wave 2 Wave 2 minimally retraces 38.2% and mostly 61.8% or more of wave 1. It often stops at subwave 4 and more often at subwave 2 of previous wave 1. A retrace of more than 76% is highly suspicious, although it doesn’t break any rules yet. Wave 3 Wave 3 minimally is equal to wave 1, except for a Triangle. If wave 3 is the longest wave it will tend to be 161% of wave 1 or even 26l%. Wave 4 Wave 4 minimally retraces 23% of wave 3 and more often reaches a 38.2% retracement. It normally reaches the territory of subwave 4 of the previous 3rd wave. In very strong markets wave 4 could only retrace 14% of wave 3. Wave 5 Wave 5 normally is equal to wave 1 or travels a distance of 61.8% of the length of wave 1. It could also have the same relationships to wave 3 or it could travel 61.8% of the net length of wave 1 and 3 together. If wave 5 is the extended wave it mostly will be 161.8% of wave 3 or 161.8% of the net length of wave 1 and 3 together. Wave A After a Triangle in a fifth wave, wave A retraces to wave 2 of the Triangle of previous wave 5. When wave A is part of a Triangle, B or 4 it often retraces 38.2% of the complete previous 5 wave (so not only the fifth of the fifth) into the territory of the previous 4th wave. In a Zigzag it often retraces 61.8% of the fifth wave. Wave B In a Zigzag wave B mostly retraces 38.2% or 61.8% of wave A. In a Flat, it is approximately equal to wave A. In an Expanded Flat, it usually will travel a distance of 138.2% of wave A. 33
  • 34. Wave C Wave C minimally has a length of 61.8% of wave A. It could be shorter in which case it normally is a failure, which foretells an acceleration in the opposite direction. Generally wave C is equal to wave A or travels a distance of 161.8% of wave A. Wave C often reaches 161.8% of the length of wave A in an Expanded Flat. In a contracting Triangle wave C often is 61.8% of wave A. Wave D In a contracting Triangle wave D often travels 61.8% of wave B. Wave E In a contracting Triangle wave E often travels 61.8% of wave C. It cannot be longer than wave C! Wave X Wave X minimally retraces 38.2% of the previous A-B-C correction; a retracement of 61.8% is also common. 34
  • 35. Trading the Elliott Wave The Elliott Wave provides you with the most objective and disciplined method available for trading. Only a handful of patterns exist, sometimes easy to recognize especially in strong impulsive waves. The available patterns tell you where the market is heading; in what way (or structure) this will happen and under what circumstances the pattern gets a stronger probability. Also the pattern will tell you when it is no longer valid because of the occurrence of an intolerable price action. This makes it possible to exactly determine your entry and exit points, which is an outstanding characteristic of the Elliott Wave. The key to forecasting markets with the Elliott Wave lies in determining the probabilities of alternative scenarios. If you find several alternative counts pointing in the same direction, you have found an excellent trading opportunity. Some people, mainly those who could not successfully apply the Elliott Wave themselves, will tell you either it is too complex and subjective or that the waves don’t exists at all, suggesting the market follows a random pattern. Obviously the Elliott Wave can get very complex-especially in corrective waves- since you will have to look for patterns, which contain patterns, which contain patterns etc. etc. But it never loses its objectivity if you apply the rules and guidelines. The only problem is that sometimes it is not totally clear if the internal structure of a wave is a 3 wave or a 5 wave. In that case you will have to determine alternatives for both internal wave structures and look for other confirmations, such as channels, indicators and Fibonacci ratios. Below we will mention the key steps for Elliott Wave analysis and supply basic trading patterns to search for. 35
  • 36. General Directives for Trading Now you can use the Automatic Analysis to trade profitably, the more probable an outcome the better opportunities. The more alternatives point in the same direction the more certain the market will move accordingly. The Automatic analysis will generate an ever objective and consistent wave count and will always present the most probable outcome first, set by objective rules and guidelines implementing a true Elliott Wave model. Those who really would like to learn the Elliott Wave have to really study the ins and outs. In the following we offer some directives. These directives come from our own experience as well as many publications on this subject. Of course every trader or analyst should find his own path to success. Study the Patterns • know the rules and guidelines • learn the internal structure of patterns, which enables you to recognize a pattern within a pattern • remember that only waves 1,3,5, A and C can be impulsive waves • all other waves are corrective, against the trend, and show overlap in their internal structure Design Alternative Scenarios by Labeling the Chart. • Start labeling the chart by taking into account the following rules and guidelines: • Separate impulses from corrections, an impulse normally shows acceleration and no overlap, a correction a sideways pattern • Waves of the same degree should have the same proportions, which is especially important for wave 2 and 4. A minuscule 4th wave cannot belong to a big wave 2 and so on. • Wave 2 can never retrace more than 100% and go beyond the origin of wave 1. • Wave 3 normally is the longest wave and shows the most powerful acceleration • In wave 3 there is never an overlap between wave 4 and 1, as it occurs in fifth waves (and first or A waves • Label the big picture, is it a three or a five? • Label more in detail, by labeling the smaller wave degrees, then go back to the large wave degrees, changing your labels if necessary 36
  • 37. • Check if the required internal structure of your waves comply with the rules and guidelines. For example a B wave never can consist of five waves and so on • Check if the internal structure of the internal structure is correct. For example an (expanded) Flat consists of a 3 wave, again a 3 wave and a 5 wave structure. If this is not true, change your labeling • Check your wave count for alternation, especially with wave 2 and 4. If wave 2 showed a simple Zigzag, wave 4 should show a complex pattern • A corrective pattern mostly minimally carries into the territory of the 4th wave of the previous impulse wave • Use momentum indicators and volume to support your wave labeling. Wave 3 should have the highest momentum and volume (if it is the longest wave). • Calculate Fibonacci relationships. If your wave count reveals a lot of reasonable Fibonacci ratios, you have found an interesting count. • Throw in channels and determine if your wave count more or less fits these channels • Design as many scenarios as the Wave Principle allows for, with regard to the wave degree or time frame you are analyzing • Do the same for shorter and longer time frames (or lower and higher wave degrees) and try to narrow down alternatives by fitting them to a multiple of wave degrees • Assess the probabilities of these scenarios by studying their compliance with the permitted internal wave structure, the outcome of Fibonacci ratios and the fit of channels • Draw the expected price action/pattern of each scenario you have designed, mark price levels where you get signals to enter/exit market. Design a Trading System • Determine what time frame (or wave degree) you would like to trade • Determine which patterns and alternative wave counts give the best trading opportunities, such as when several alternatives all produce a price movement in the same direction • Determine objective entry points based on patterns • Determine objective exit points, also based on patterns. You should 37
  • 38. for example exit a trade when a price movement makes your preferred wave count invalid. Control Your Emotions • Don’t be afraid to take a loss if your stop gets hit. This means you will have to admit you were wrong on this trade. Don’t be afraid of loosing the (little) profit you have made, only exit if your system or wave analysis tells you to • Follow the rules of the Elliott Wave and don’t second-guess the market. Believe what the Elliott Wave tells you, your stop will protect you • Of course there will be loosing trades; a 100% score is impossible. But if you limit your losses (by executing your stop) and let your profits run, you could be very successful. So maintain your discipline and learn from all trades 38
  • 39. Trading Example In this section you will be shown how to recognize an impulsive wave from a corrective wave. In the same way as these basic patterns are compared and analyzed here, you can do it yourself with all other patterns. Suppose the market has experienced a big sell off. From the bottom it starts to rise. Wave 1 (or A) and wave 2 (or B) have been completed and the market starts to rise again. The first picture shows two scenarios possible, either an impulse (1,2,3) or an A,B,C correction. The pictures there under demonstrate which price action to expect in an impulse or in a correction: The pattern can be an impulse only if the 4th wave does not overlap the first, a level indicated by the horizontal “stop” line. As soon as the price drops under this line-before wave 5 has been completed- you have your first signal of a pending correction (picture above at the right). This correction will be confirmed when the price drops under the origin of wave C, which is the end of wave B. As long as it doesn’t drop under the “confirmation” line, it could still be an extended 3rd wave that subdivides. In that case the C or 3 wave is only wave 1 of the third wave! You will find the pattern called extension under the chapter “Patterns”. Fig. 28 39
  • 40. See the successful impulse wave 1 on the AOL chart. See the failure of a wave to go up and the result of and an A B C correction wave in the gold chart. 40
  • 41. Indicators A selective set of indicators can help you determine the wave structure. Remember that an Elliott Wave trader makes his trading decision mostly on the wave count and not solely on indicator values, On the other hand some indicators can be very helpful, because they show specific characteristics in different waves. Indicators can be added to the price chart or in a separate window. Normally, indicators like moving averages and others, which have the same scaling as a price chart, are added to the price chart itself. Other indicators, like RSI for example, are clearer if displayed in a separate window. The most useful indicators are the following, not all of them have been explained, since all books on technical analysis already clarify their use: • RSI • MACD • DM1 • Momentum • Exponential Moving Average • Simple Moving Average • Displaced Moving average • Rate of Change • Elliott Oscillator • Stochastic • Volume • Bollinger Bands Indicators always have the same compression as the price chart. For example if the RSI has been set to a time period of 14 and a daily bar is displayed in the price chart, then the RSI will calculate a 14-day RSI. If you change the price chart to weekly, the RSI will calculate a 14-week RSI. The same accounts for intra day (intra day version only), for example an hourly chart creates an 14-hourly RSI and so on. 41
  • 42. Relative Strength Index Relative Strength Index (RSI) is an oscillator developed by J. Welles Wilder, JR. It is a very popular indicator and useful when applying the Elliott Wave. RSI measures the strength of any price action by monitoring changes in its closing prices. It is a leading or a coincident indicator, it never lags the price action. The RSI indicator fluctuates between 0 and 100. Horizontal reference lines in the RSI are often drawn at 30 and 70. RSI gives several buy or sell signals, which are divergences, patterns, trend lines and the absolute level of RSI, the RSI levels as already mentioned. Divergences are the most important signals. Divergences between RSI and prices give the strongest buy and sell signals. Normally this happens at tops and bottoms in an impulsive wave, which consists of five waves. If the C wave is equal in length to wave A, the RSI should also show a divergence. Generally a divergence indicates that the trend is weak and ready to reverse. A bullish divergence gives a buy signal, when prices fall to a new low but RSI fails to make a new low. You can buy as soon as the first RSI bottom has been below its lower reference line (for example at 30) and the second bottom of the RSI happens above the reference line. See chart below. 42
  • 43. A bearish divergence works exactly the same, but the other way round. It gives sell signals. You can sell as soon as the first RSI high has been above its higher reference line (for example at 70) and the second top of the RSI happens underneath the reference line. See Chart below. Trend lines, support and resistance lines, and patterns, like “head and shoulders”, work fine with RSI. Because RSl leads the price chart, it often gives early warnings of likely trend changes. RSI trend lines are penetrated before it happens in the price chart and patterns can be completed a few days before completion in the price chart. Of course the fifth wave of a RSI mostly is a failure, except when the fifth wave is an extension. RSI levels indicate that above 70 the market is overbought, which calls for a correction, although the RSI can reach 80 and more in a bull market. Under 30 the market is oversold, so a rise can be expected, but be careful because in a bear market a RSI beneath 20 is quite common. So when the RSI goes above 70 and certainly above 80, look for a selling opportunity. Beneath 30 and certainly 20 you should look to buy. 43
  • 44. Moving Averages (MA) A 10 day MA shows the average price for the past 10 days, a 30-day MA shows the average price for the past 30 days. A moving average normally will be displayed in the price chart as a line, by connecting each day’s MA values. Moving averages can be calculated as a simple moving average, which gives each day an equal weight. Also, an exponential moving average can be calculated, where the latter days are heavier weighted. With a moving average you can see the main trend more easily, because it filters out the small price movements. When it rises, the moving average shows that investors become more optimistic. When it falls, investors become more pessimistic. An exponential moving average (EMA) is a better trend-following indicator than a simple MA, because it responds faster to the latest price changes than a simple MA and skips older data which are less relevant. For the investor moving averages are most helpful in following the trend. The direction of its slope in each time frame tells you what the trend of this specific time frame is. Be sure to trade in the direction of the trend of the time frame you use. When you are trading a trend, you can use a short term MA as a stop. See 30 EMA below. In the price chart you could also display a short term MA and a longer term MA. When the shorter term MA crosses the longer MA in upward direction this is a buy signal, which confirms the up trend. When it dips under the longer term MA this is regarded as a sell signal. Be careful with this signal, because a sideways market shows a lot of crossovers and thus a lot of false signals. You can also use a moving average as a stop. The shorter your investment horizon the shorter your moving average should be. As soon as prices break the moving average line you can close your position. This can be very useful if you want to invest in a third wave only. 44
  • 45. Moving Average Convergence Divergence (MACD) Gerard Appel has constructed a more advanced indicator, called the Moving Average Convergence-Divergence, or MACD, which is built of three exponential moving averages. It is displayed as two lines, the MACD line and a the Signal line. The MACD line is built out of two exponential moving averages (EMAs). The signal line is built from the MACD line smoothed with another EMA. The MACD line responds more quickly to changes in prices. Buy and sell signals occur when the fast MACD line crosses above or below the slow Signal line. You can use the crossovers of the MACD and signal lines to trade with the trend of the market. The fast MACD line crossing above the slow Signal line gives a buy signal. The fast MACD line crossing below the slow Signal line gives a sell signal Also you can look for divergences as explained with the RSI to determine the momentum of the market. Again a wave 3 should have the lowest (bear market) or highest (bull market) MACD. Divergences in the MACD don’t work on longer term. 45
  • 46. Momentum The Momentum indicator shows how strong the trend is by measuring its acceleration. The faster Momentum gains or loses speed the more the trend accelerates. This is a leading indicator, which usually reaches a peak before prices reach their highs and reaches a bottom before prices reach their lows. The trend is up as long as Momentum gets higher and higher, you can normally hold on to your bullish positions. As long as it keeps reaching new lows, you can hold on to your short trades. Every time Momentum reaches a new high, the up trend is still accelerating. Every time Momentum reaches a new low, the downtrend is still accelerating. When the direction of Momentum changes, without having set a divergence already, be prepared for a reversal. You can use Momentum to catch large trends, for this purpose use a longer time frame. If you want to spot changes in the trend quickly, then use a shorter period Momentum. When the direction of Momentum changes, the pattern could be the third of a C wave or the third of a five wave. A small correction will take place to form the 4th wave. The fifth wave still has to develop in the same direction of the trend. When this fifth wave is underway, you can cover your shorts or sell your longs. Again a divergence is one of the most powerful signals, which normally occurs in every five wave structure. The bigger the divergence the sharper the reversal can be. If Momentum fails to make a new high or low, this could be a C wave or a five-wave structure, which depends on the wave structure of larger degree. If you can recognize five waves in a C wave in a larger trend, which points to the opposite direction, and at the same time Momentum makes a lower top or a higher low, it is better to close your (trend following) positions at once. After a C wave the reversal could be quite sharp. On the other hand, if the larger trend is still up, this only could be wave 3 with wave 4 and 5 to follow. Here you could hold on to your positions depending on the wave degree you have determined. In a larger degree a bigger reversal can be expected, making it worthwhile to exit. Later on you could possibly reenter at a better price. You can also draw trend lines or channels to identify support and resistance in indicators. Usually Momentum breaks through its resistance a long time (relatively speaking) before prices do. 46
  • 47. Rate of Change Rate of Change is quite similar to Momentum, since it also measures the strength of a trend. The only difference is that Rate of Change is calculated differently. It divides today’s price by a past price. The faster Rate of Change gains or loses speed the more the trend accelerates. This is a leading indicator, which usually reaches a peak before prices reach their highs and reaches a bottom before prices reach their lows. The trend is up as long as Rate of Change gets higher and higher, you can normally hold on to your bullish positions. As long as it keeps reaching new lows, you can hold on to your short trades positions. Every time Rate of Change reaches a new high, the up trend is still accelerating. Every time Rate of Change reaches a new low, the downtrend is still accelerating. When the direction of Rate of Change changes, without having set a divergence already, then be prepared for a reversal. You can use Rate of Change to catch large trends, for this purpose use a longer time frame. If you want to spot changes in the trend quickly, then use a shorter period for Rate of Change. When the direction of Rate of Change changes, the pattern could be the third of a C wave or the third of a five wave. A small correction will take place to form the 4th wave. The fifth wave still has to develop in the same direction of the trend. When this fifth wave is underway, you can cover your shorts or sell your longs. Again a divergence is one of the most powerful signals, which normally occurs in every five-wave structure. The bigger the divergence the sharper the reversal can be. If Rate of Change fails to make a new high or low, this could be a C wave or a five-wave structure, which depends on the wave structure of larger degree. If you can recognize five waves in a C wave in a larger trend, which points to the opposite direction, and at the same time Rate of Change makes a lower top or a higher low, it is better to close your (trend following) positions at once. After a C wave the reversal could be quite sharp. On the other hand, if the larger trend is still up, this only could be wave 3 with wave 4 and 5 to follow. Here you could hold on to your positions depending on the wave degree you have determined. In a larger degree a bigger reversal can be expected, making it worthwhile to exit. Later on you could possibly reenter at a better price. You can also draw trend lines or channels to identify support and resistance in indicators. Usually Rate of Change breaks through its resistance a long time (relatively speaking) before prices do. 47
  • 48. Elliott Oscillator This indicator is very useful in counting waves. It was discovered by Tom Joseph in 1987 and named the Elliott Wave Oscillator. The pattern this oscillator produces has a strong correlation with the pattern of the Elliott Wave. For example the 3rd wave mostly is the strongest wave. At this point generally the Elliott Oscillator shows the highest value, thus confirming a 3rd wave. The Elliott oscillator works in all time frames, provided you have enough periods or bars available in your price chart. In order for the Elliott Oscillator to produce reliable values your price chart should contain 100 bars minimally. If you work with intra day data, you can zoom in on each wave to check the pattern of the Elliott Oscillator, as long as enough detail is available. Formula: 5-period MA - 35 period MA of the (High + Low) /2 A divergence between the Oscillator and prices indicates a trend reversal. When the market has set new lows but the Oscillator does not, you have probably found wave 1 in Elliott terminology. When you spot this divergence you could do your first trade and buy the market. At this juncture risk is high, so watch the market closely. Always sell when the market reaches a new low, since this could be the beginning of a renewed sell off. Next a correction will take place, which is wave 2. Neither the market will reach new lows in wave 2, nor will the Elliott Oscillator. If wave 2 is complex, the oscillator will pull back to zero. A simple wave 2 on the contrary will hardly affect the oscillator. When the oscillator reaches zero you could buy again to profit from the coming 3rd wave, on the condition that the pattern of supposedly wave 2 is corrective (when it shows a lot of overlap and not a 5 wave) Then the market will build wave 3, normally the strongest price movement. Both the indicator and the market will reach new extremes. As soon as wave 3 has gone beyond wave 1, the market will accelerate sharply. The oscillator does not provide for an exit point in this time frame or wave degree, so you have to look at the subwave of this wave degree. If you detect a divergence between subwave 3 and wave 5 of the main 3rd wave, you have found your exit. After wave 3 again a correction will take place in wave 4. Notice that wave 4 will be complex if wave 2 was simple and vice versa. Normally (90% of all 4th waves) the oscillator will at least retrace to zero in wave 4. As long as the oscillator does not retrace more than 138.2% of the wave three peak, the correction is considered to be wave 4. If it retraces more prepare yourself for a decline, since there is a strong probability that the price rise was a corrective three wave in a contra trend price movement. When the Oscillator reaches zero you could enter the market again to profit from wave 5, on the condition that the pattern of wave 4 was corrective. 48
  • 49. Most of the time the market will make new highs in the 5th wave, but the oscillator won’t come near its top in wave 3. This divergence is a strong sell signal, on the condition that the pattern of the 5th wave is complete. If both the oscillator and the market make new highs, you will have to relabel the 5th wave to wave 3! 49
  • 50. The ELWAVE Program - Introduction Attention: You will need the special “Automatic analysis” module to automatically analyze price data according to the Elliott Wave Principle. In addition, you will need the “Trading signals” module to generate trading indications automatically. In this chapter we will introduce you to our Elliott Wave software. We will show you how to use ELWAVE without the requirement of being an Elliott Wave expert. Now Elliott Wave analysis and trading is just a few mouse clicks away. For experts we explain the possibilities and advanced features in the Chapters “AUTOMATIC ANALYSIS”, “TRADING SIGNALS” and “MANUAL WAVE COUNT”. The Automatic analysis chapter will briefly describe how our Elliott Wave model works, a short description of analysis options, the difference between the CLASSIC and MODERN rules and how to inspect the alternatives ELWAVE has found. The Trading signals chapter explains the outcome and interpretation of the signal indications as well as further explanation of the SUMMARY INSPECTOR, the ALERTS INSPECTOR and the SIGNALS INSPECTOR. The Target clusters chapter explains how to interpret time projections using the TIME CLUSTERS indicator or the Target zone, which can be shown in the chart. The chapter Manual Wave count explains how to make an Elliott Wave count yourself instead of have ELWAVE do it for you. Of course you have to be an expert to make a high quality count, but fortunately ELWAVE is able to check the count, even if you have the Basic module only. In addition you will find more information about the WAVE INSPECTOR and the WAVE TREE. If you are looking for explanation on specific topics, check out the chapter “Technical Tools-Extra information”. Here you will find more information on for example loading and saving data and scenario files, the price chart window, trend lines, channels, time ratio ruler and real-time data feed. For your convenience we have also added a chapter that describes the menu options one by one, called “Using the menu”. Naturally we have included an extended chapter on the basics of the Elliott Wave Principle and a detailed description of the Elliott Wave patterns. Reading is not required to use the software, but still highly recommended. Our manual concludes with a short chapter on Indicators. Not all indicators have been explained, because many books on interpretation and use of these indicators are available. We recommend getting more information on indicators from other sources as well. 50
  • 51. Our Automatic analysis uses a true Elliott Wave model to detect validated patterns and to determine the direction of prices, thus enabling you to forecast markets more accurately. In this section you will learn the essentials in order to start using the program right away, assuming you have purchased the full End of Day or Intra day version. If you have the Basic version only, please go to chapter “Manual Wave count”. After you have followed the steps listed below you will be able to use ELWAVE. We have assumed that you are familiar with the Windows environment, the way the menu works and so on. If not, you will have to study your Windows manuals. 51
  • 52. Quick Start 1. On top of the screen the main menu is listed, click on the menu item to access its options. 2.Load an existing scenario file by choosing Open from the Scenario menu or choose New and From price data to import data. Select the directory that contains your data and choose the correct FILE TYPE. 3.After the chart has been loaded, choose Analyze entire chart from the Analyze menu. 52
  • 53. 4.Press the TARGET ZONE button in the right lower corner of the chart window. 5. This will then draw the TARGET ZONE and expected market PATH. 5.ELWAVE will present all information you need after completion of the analysis, such as • Preferred alternative • Targets • Trading signals • Entries, exits, risk / rewards etc. Now take a look at the SUMMARY INSPECTOR to spot opportunities easily in the EASI indicator column. The more positive indications shown, the stronger the uptrend and vice versa. It’s that simple. 53
  • 54. Analysis Results We will now discuss how ELWAVE presents analysis results when you have taken the steps as mentioned before. After completion of an automatic Elliott Wave analysis, ELWAVE will come up with more or less the following screen. As you see, a lot of information is available, which we will explain step by step in the following sections. In all predefined layouts (see Analysis menu) ELWAVE will show the SUMMARY INSPECTOR, which probably gives the most important and concise information as depicted in the picture below. Additionally the expected market PATH as well as the more specific TARGET ZONES are pictured below. 54
  • 55. Price Chart window In the default layout this window is presented at the left. of the screen. It contains for example the price data, the wave labels that have been inserted by ELWAVE and the automatic channels. In this example an analysis of 100 years of Dow Jones data, 3 wave degrees or time frames are displayed. Every wave degree has a different color, all connected objects, such as channels, target bars, have the same color. TARGET BARS are displayed as vertical lines, representing the minimum and maximum expected target of the selected pattern. The small diamonds represent the average targets, which correspond with the information in the SUMMARY INSPECTOR (see below). For easy recognition, these diamonds inherit the color of the wave degree or time frame to which they belong. The same goes for the triangles that represent the exits. 55
  • 56. Toolbars On top of the screen, just underneath the main menu, two toolbars are displayed (See the pictures on the previous pages). The OBJECT toolbar or Chart objects contain buttons for inserting channels, trend lines, time rulers, spirals and trigger lines. Grab the button and drag it into the chart and release it at the required spot. The WAVE LABEL toolbar, The wave label toolbar, which by default lists the “Supercycle” wave labels, can only be used when determining your manual wave count. The setting of this toolbar to a specific wave degree has nothing to do with the automatic Elliott Wave analysis. 56
  • 57. Wave Tree The WAVE TREE is a tree-structured representation of the first Elliott Wave analysis that is displayed in the chart. It is displayed at the left of the screen. On top of THE WAVE TREE, two buttons “PREVIOUS” and “NEXT” can be found. Clicking these buttons will only affect the highest wave degree and scroll to the next or previous Elliott Wave alternative. To take a look at alternatives from lower degrees, click that particular WAVE BUTTON and click the right mouse button and scroll the alternatives. The WAVE TREE itself is composed of WAVE BUTTONS, each of them represent a wave in the chart, which in fact is a small or large trend or correction. Together, a group of WAVE BUTTONS build a higher wave degree of a larger time frame. Clicking a WAVE BUTTON, that displays a wave label, will show that particular wave with the required wave detail, all of its channels and other connected objects. The small + or - buttons make the WAVE TREE expand or collapse. If you press the + button, the underlying patterns that consist of several waves, each represented by a separate WAVE BUTTON, will be displayed. By expanding the WAVE TREE and selecting lower level waves, you can navigate as deep down into the wave structure as you like. This will show which patterns ELWAVE has found. The patterns found are listed at the right of the WAVE BUTTON. The most interesting Waves are the unfinished waves, which can be recognized by the gray cross in THE WAVE BUTTON. Obviously a correct forecast of the pattern in an unfinished wave is the key to forecasting markets. In case a red cross appears in the WAVE BUTTON, the patterns in this wave or in the underlying waves are either not found or are not allowed. If the Trading signals module is included, double clicking a WAVE BUTTON will show the trading signals for the pattern under inspection. At the left in the SIGNAL INSPECTOR the trading indications are listed together with the critical price level. At the right the patterns that share this signal, are listed. At the bottom the description of the rule, on which the trading indication is based, is displayed. Trading signals in ALL CAPS already have been triggered, while Trading signals in lower case have not yet been activated, because their critical price level is not reached. There are four signals: Entry, to enter a position, which is a buy or sell indication depending on the trend Exit, to exit a position, which is a buy or sell indication depending on the trend 57
  • 58. Confirm, this is an alert that the trend has been confirmed, depending on your strategy this can either be used as an entry or an exit Recalc, if this price level gets penetrated, ELWAVE will update the analysis because a critical price level has been broken, its price level will coincide with some other signals Use the scroll bars at the right side of the WAVE TREE window or at the bottom to scroll the tree. As shown in the picture below, clicking on the WAVE BUTTON (or pattern) in the WAVE TREE displays this wave in the price chart, the SWING FILTER (light blue line), a text book example of an impulse pattern and connected TARGET BARS. 58
  • 59. Wave Inspector The WAVE INSPECTOR gives a lot of additional information on the pattern under inspection. It is not necessary to inspect this information; nevertheless it could be a valuable tool in your trading. Certainly it will teach you which rules and guidelines determine the patterns. The WAVE INSPECTOR will always display information on the pattern that has been selected as in this case, where the pattern Impulse has been highlighted in the left list box on top of the WAVE INSPECTOR. At the left the still validated patterns are listed, at the right dismissed patterns are listed. If you choose one of the dismissed patterns, you will notice that at least one of the rules of the pattern has been violated and checked by a red cross. Use the scroll bar at the right side of the WAVE INSPECTOR window to see more. In the following pictures we have shown the available information. The score on top in bold in the WAVE INSPECTOR is the total score, which is used to rank the alternatives. The better the Fibonacci ratios, the better the Elliott Wave analysis. Clicking on the rules and guidelines in the WAVE INSPECTOR will display the critical price levels, where the rules or guidelines get violated, in the chart. 59
  • 60. Summary Inspector Probably the SUMMARY INSPECTOR gives the most important and concise information, eliminating the need of being an expert Elliott analyst. Using this information will give clear indications on how to trade and when to enter or exit positions. Apart from the SUMMARY INSPECTOR it is recommended to take into account other information and use other tools as well, in order to make the best trading decision possible. By default, the SUMMARY INSPECTOR is displayed at the bottom of the screen. The column called EASI is the main thing to watch in combination with the R/R (risk-reward) parameter. As long as the AVG R/R is above zero the EASI column will give a positive or negative indication, depending on the trend. If the AVG R/R turns negative, the EASI will become a “neutral”. If all time frames display the same signal, either a “Positive” or “Negative” and the AVG R/R is above 1, then expect an acceleration in the direction of the trend, provided a large price movement has not yet taken place. A risk- reward of 2 or more is very favorable as long as this is not caused by an extremely small risk in the RISK column. After ELWAVE for example shows a “Positive” on every time frame, at some point the EASI column of time frames (the smallest time frame first) will turn into a “Neutral” as soon as the TARGET has been reached. As said before TARGETS are displayed in the chart by a diamond, while EXITS are displayed as little triangles. Both TARGET and RISK are presented in points. Normally a “Neutral” means you can still hold on to your positions. If he smallest time frame turns to a “Negative” or the EXIT, as listed in the SUMMARY INSPECTOR, is penetrated, you have a signal to exit your positions, depending on your trading strategy. If the EXIT level gets hit this does not automatically mean that the position should be abandoned, especially if the EASI is still a positive (Negative in down market) or a hold. Consider the EXIT to be the first warning signal of a reversal, which has yet to be confirmed. In Elliott terminology the stop of at least one alternative has been hit, invalidating this scenario, but other alternatives could still be possible. 60
  • 61. In case all alternatives have been dismissed, because all their exits have been triggered, the SUMMARY INSPECTOR will show a change in the TREND column and /or the EASI column. These time frames, as highlighted in the above picture, show the relative order of the trends within trends or pattern within patterns that ELWAVE has found automatically. Time frames of the same degree normally do not exactly have the same duration; they are dynamic in nature. The lower listed TIME FRAMES (or wave degrees) in the SUMMARY INSPECTOR are smaller trends in a larger trend (or the higher listed TIME FRAME). Therefore an Intermediate time frame is a smaller trend in the Primary and so on. Please note that a wave degree as listed in the SUMMARY INSPECTOR is not related to the duration of the wave degrees as normally defined by the Elliott Wave Principle, which definitions are only tendencies, not fixed and exact. RISK shows the number of points you risk if you adhere to the exit in the EXIT column. 61
  • 62. ELWAVE in a Nutshell 1. Only the very first time you have to import an existing (intra day) data file for each security or market provided you save it as a scenario file, which you load the next time. With respect to intra day files, you should use an already existing intra day file and have this updated by the real-time feed (make sure the date and other formats are the same). Alternatively you can start a file from scratch using a real-time data feed! 2. Select New from Scenario menu and next From Price data to import data: Import existing data files, choose the type of data to import by selecting FILES OF TYPE in the dialog box as displayed above. Next cruise to the directory where your data files are located. The formats supported are Metastock3.1-6.5, ASCII, TC2000 3.0-4.0, FutureSource, CSI, Keyword and Techtools. From real-time feed, to start collecting tick by tick, building your own intra day files from scratch 3. Files of the type you have specified will be listed in the right pane. Click on the file in the right pane once and click on OPEN 4. Once you have imported the data, immediately save the chart as a scenario file for later use, giving it the name of the security or market. This makes it easier to load the data file and will save real-time feed settings as well. In addition, a print out of the chart will have included the scenario file. In order to do so, choose Scenario and select Save . 5. The next time you would like to analyze this market, just load the scenario file you have just saved, choose from the main menu Scenario and select Open, the scenario file will remember where to find the data file automatically. 6. ELWAVE will use a default analysis layout to present results, taking into account your screen resolution. If you like, you can readjust all the windows to make a tailor made layout. Save it by selecting Analyze from the main menu and by choosing the option Save Custom layout. 62
  • 63. 7. Start Automatic Analysis by choosing Analyze from the main menu and select the option Analyze entire chart to generate an analysis from scratch. Of course you must have loaded data first. You may analyze a market from scratch or analyze an existing wave count in more detail (see examples in the next chapter). ELWAVE will present still remaining alternatives together with their targets and channels automatically. 8. The SUMMARY INSPECTOR will show concise information about several time frames. The most important information to watch is the Trend and EASI (Elliott Advanced Signals Indicator). For each time frame EASI will show Positive, Negative or Neutral, if 2 or 3 consecutive time frames show positive or negative, an interesting trading opportunity is emerging in the direction of the trend. 9. Press the TARGET ZONE button, which is located in the lower right corner of the chart window, to show the expected path of prices as well as the target zones in the chart. 10. Save your analysis by choosing Save from the Scenario menu 11. More detailed analysis using results of Automatic analysis, the WAVE TREE has appeared at the left after you have analyzed the entire chart as described under point 7, click with your left mouse button on the wave (button) in the WAVE TREE you want to analyze select Analyze from the main menu choose the Analyze selected wave option. 12. Using a wave count defined by the user: • first load your scenario file containing your own wave count • select Analyze from main menu • choose option Check wave count • if this is your first time, accept the settings of the dialog box by clicking OK • The WAVE TREE appears at the left, click with your left mouse button on the wave (button) to be analyzed select Analyze from the main menu • choose Analyze selected wave option 13. ELWAVE will present the preferred wave count in the WAVE TREE, displayed at the left, as well as in the chart. In addition it will display all formation in the WAVE INSPECTOR 14. You may cruise the chart by clicking on the WAVE BUTTONS in the WAVE TREE. This will bring you to the required section in the chart, it will zoom in on this area and adjust detail accordingly. Alternatively, to zoom in, position your mouse pointer on empty space of the chart and press the RIGHT mouse button (not the left button) and a menu pops up which 63
  • 64. contains the option Zoom in, select this and drag your mouse on the section of the chart 15. To expand wave degrees, click on the + Button in the WAVE TREE, which are positioned in front of this wave degree. 16. The preferred pattern is listed behind the WAVE BUTTON 17. To make the WAVE TREE disappear select from View the option WAVE TREE, use this as a toggle for display 18. By default the WAVE INSPECTOR will come up with complete information about the preferred pattern of largest degree, which is the top WAVE BUTTON of the WAVE TREE. 19. If you press another WAVE BUTTON in the WAVE TREE, immediately the WAVE INSPECTOR will show information on the preferred pattern, found in this wave degree. 20. It will show a standardized drawing of this pattern in the chart, presenting targets for this pattern and the path the pattern is expected to follow. 21. On top of the WAVE INSPECTOR you will find two list boxes. The left box lists the patterns that have been approved, the right one that have been rejected. Select one of these patterns to see why patterns have been approved or rejected by inspecting the rules and guidelines that can be found in the WAVE INSPECTOR. 22. Click on a rule or guideline in the WAVE INSPECTOR to visualize it in the chart. 23. To make the WAVE INSPECTOR disappear select from View the option WAVE INSPECTOR, use this as a toggle for display. 24. A summary of Trading Signal indications will appear automatically in the SUMMARY INSPECTOR provided the Trading Signals module has been ordered. 25. To display indicators for the active chart, choose from the main menu Insert and select New Indicator pane. With your mouse select the indicator in the dialog box that pops up, Press the ADD button and Press OK. Some Indicators can only be inserted in the chart, choose New indicator in chart… 26. The same way you can show the TIME CLUSTERS, provided the Target Clusters module has been purchased. 27. If you like to use the other tools of ELWAVE as for example Channels, Fibonacci Pane and Quick targets, you will have to convert one of the alternatives of the automatic count to manual wave labels first. Select Analyze from the main menu and choose Convert to wave count. Please note that only the activated alternative will be saved in a separate window. 64
  • 65. Hereafter you may save the scenario by choosing from the Scenario menu the option Save as… 28. Loading a scenario containing manual wave labels, will not automatically display the WAVE TREE and WAVE INSPECTOR. In order to accomplish this you have to choose Check Wave count from the Analyze menu 29. To display Fibonacci ratios of the selected wave label, choose from the main menu Insert and select Fibonacci pane. This will only work after you have converted to a wave count! And again you have to click on the wave label first to select it! 30. To visualize more targets, select the wave label in the chart, press the right mouse button and choose Quick targets 31. To drop channels, trend lines, spirals and the TIME RULER, grab this object in the CHART OBJECTS Toolbar on top of your screen and drop it on the wave label of your choice or at another position in the chart. 32. In order to save all settings of the chart, including indicators, channels, targets etc. , save the scenario frequently. 33. You are allowed to analyze multiple charts in several sessions of ELWAVE. 34. If you have analyzed several charts, you can toggle display of the chart together with full analysis information by using from the main menu Windows and selecting one of the charts listed as menu items. 35. To use the simulation feature (only available on purchase of Trading Signals), choose Options from the main menu and select Truncate price data… Before you choose this option, move the mouse pointer over the chart area where you would like to truncate the chart and watch the right end of the status bar for the index number, which has to be inserted in the Truncate dialog box. Truncate price data will force the software to neglect future data. Now instruct ELWAVE to analyze these truncated data and compare the analysis outcome and signals with what really happened in the future. For easy comparison future data has been grayed out in the chart window. 36. Press CTRL-1 (or a higher number of the numerical keypad, NUM LOCK must be ON) to add future data to the price chart. If critical price levels get penetrated when adding future data, the ALERT INSPECTOR will show the trading indications automatically. 65
  • 66. Batch Processing The ELWAVE BATCH PROCESSOR is a new and powerful addition to the ELWAVE suite of financial analysis products. Frequently recurring operations, such as analysis or printing of charts, can now be automated. The following dialog box will come up when you double click the Batch processing icon. Now you can define which charts you would like to have analyzed without the need to give the software every instruction by hand for every chart. You can only use previously defined Scenario files (extension *.ELW)!! Batch Processing Step by Step 1. Define scenario files for each data file. Load the data file in ELWAVE and save it by choosing Scenario from the main menu and select the menu item Save. Repeat this for every data file you would like to include in the batch processing. Save these scenario files in a separate directory, so you can track them easily. 2. If you have already defined a set of scenario files, press the ADD button to choose which scenario files to include. The above displayed dialog box will appear, cruise to the directory where your scenario files are located and select the files one by one or select multiple files by clicking the first scenario file, keeping SHIFT key pressed and clicking on the last scenario file with the left mouse button. After selecting scenario files click on the OPEN button. 3.Alternatively you can drag scenario files from the Explorer into the BATCH PROCESSING dialog box. 4. The BATCH PROCESSING dialog box will be filled with the selected scenarios. Behind each scenario files you will find the status of the analysis, which can be TODO, DONE, STOPPED. 5. Now set other options you would like to have automated such as: Analyze chart Analyzing multiple charts automatically is the main purpose of batch processing so normally you would like to have this included. Print chart Check the Print chart option to print every chart automatically after it has been analyzed Save chart Check the Save chart option to save every analysis automatically for later inspection. Print target clusters 66
  • 67. Check the Print target clusters to also print the target zones with every chart automatically. Maximum number of ELWAVE instances to be used simultaneously You can start several sessions (increase the number) of ELWAVE, which is useful for computers running under NT equipped for dual processing. Otherwise it is advised to leave the setting at its default value. 6. Press the SAVE or SAVE LIST AS… button to save the list of scenarios you have just defined to include with the batch processing. The next time you can easily retrieve the same list. Choose LOAD LIST… to do so. 7. Press the START button to start the batch processing. 8. Press the STOP button to halt the batch processing 9. To remove a scenario from the list press the REMOVE button, to remove them all at once press REMOVE ALL 10. If you press the RESET STATUS button the batch processing status will be reset to TODO Other information While the batch is being processed, it’s still possible to add new files by dragging them into the window or by using the ADD… button. While the batch is being processed, it’s also possible to remove all or a selection of files from the set. Scenarios that were being processed at that time are stopped before they are removed from the list. In addition, while the batch is being processed, it’s also possible to change the maximum number of instances that ELWAVE can use. For example: if you have a dual-processor system, you may want to run the batch processor with a maximum of one instance while you are still working on the system yourself, and switch the batch processor to ‘2’ when you are going home for the day, leaving the batch processor running. The ELWAVE Batch Processor can make use of up to 8 processors in a single system, provided enough memory is available. 67
  • 68. Scanning The scanning modules come in two different versions, which are called SCANNING END-OF-DAY and SCANNING PROFESSONAL. This way the user can choose how much to add to ELWAVE. Of course THE SCANNING PROFESSIONAL is the most powerful module that works not only on end of day data, but on intra day data as well. Scanning, First Steps 1. Start ELWAVE 2. Choose View from the main menu and select Scan Inspector. The dialog box of the SCAN INSPECTOR will appear immediately as shown below 3. If you are using the SCAN INSPECTOR for the first time, use the predefined list to define the items to include in the scan lists. Please note that you can make as many scan lists as you like. Select the EDIT button next to SCAN LIST in the upper left corner to add items to your list 68
  • 69. 4. The following SCAN LIST dialog box will appear: 5. Select the NEW button, which will make appear another dialog box to input the name of the list you would like to make; 6. Press OK and next the ADD button from the SCAN LIST dialog box to add items to your scan list and repeat this process if you would like to add more lists. 7. Cruise to the directory that contains the data files of the items you would like to include 8. Select the items to include, please note that you can add multiple items by using the special Windows SHIFT and CTRL key combinations. Select the first item on top of the screen in the Open dialog box, scroll down to the last item and select it while keeping pressed the SHIFT-key to select all items at once. 9. Press the OPEN button to return to the SCAN LIST dialog box 10. Press the CLOSE button to return to the SCAN INSPECTOR dialog box 11. Select the EDIT button at the RIGHT upper corner that belongs to Conditions 69
  • 70. . 12. Now the EDIT SCAN CONDITIONS dialog box comes up, where you can define the criteria to scan for. Below you will find an example from the SCANNING END OF DAY 70
  • 71. 13. Press the NEW button to name your conditions set and start entering criteria by moving the mouse to the field you would like to specify. 14. Select CLOSE once you have finished entering criteria, which will return you to the SCAN INSPECTOR dialog box Press the SCAN NOW button to start scanning your list for the criteria selected. 71
  • 72. Automatic Analysis NOTE: In case the Trading Signals module has been included in the software package, ELWAVE will make a full automatic interpretation of the remaining Elliott alternatives and display the results in the SUMMARY INSPECTOR. ELWAVE will list the most probable outcome as the very first alternative. Alternatives that contain very little detail should be dismissed, if they appear at all. You will notice that alternatives are ranked according to their probability, taking into account the probability of the occurrence of a pattern, the Fibonacci ratios, the scores of the sub patterns and so on. A more detailed description can be found under the experts’ section. If most alternatives, that remain with respect to the same time frame (every wave degree is a time frame!), indicate the same price direction, we encounter a strong probability that prices will move in the direction of the forecasted trend. In case - with respect to the same time frame- half of the alternatives indicate rising prices and half of these predict lower prices, obviously there is no interesting trading opportunity at hand. Still you have to inspect thoroughly the different alternatives that are available. You can inspect alternatives on every wave degree level by clicking with the right mouse button on the WAVE BUTTON. A dialog box will appear where you can select the previous and next alternatives. The alternative that has been numbered 0, has the highest score. Especially unfinished, mostly extended waves could not (yet) have the highest score, because relatively fewer data is available compared to finished waves. Obviously finished waves for example could contain more Fibonacci ratios and therefore have a higher score, which the unfinished wave could get as soon as it is more complete. Still the unfinished waves could be a very probable outcome. For experts it is advised to sub label every LAST unfinished wave of all unfinished waves as deep as possible to see if the alternative still holds and how it scores. Do the same with other alternatives and compare the outcome. In order to accomplish this you could start with a FAST automatic analysis, see Analysis options dialog box, select the last unfinished wave in the WAVE TREE and choose Analyze Selected Wave from the Analyze menu. Just take a look at the picture in the Targets section following, to get the general idea. Alternatively you could insert the main wave labels yourself and start from there generating an unfinished wave every time, see the Experts information section. 72
  • 73. Besides, you could try the different Analysis options to compare their results. The more detailed the results the fewer counts will be available. Please pay attention to the following. In general the most detailed chart, which has labeled more wave degrees, without generating an internal wave structure violation, is the most probable outcome. If there are other less detailed alternatives, try to analyze these further down (more wave degrees) step by step. If the analysis comes up with a finished wave as the most probable outcome, always inspect if there is an unfinished alternative and compare wave detail, scores as well as the sub scores that these scores are composed of. Furthermore the software will present the following: • a list of alternatives, the main alternatives of the highest wave degree will be displayed as buttons right above the WAVE TREE, click on the button and the wave analysis will appear in the chart window • a summary of results of a pattern in the WAVE INSPECTOR • the most probable targets based on Fibonacci ratios, taking into account that targets differ for each pattern and each wave within a pattern, see below • a path of expected price action for the pattern under investigation. By selecting the pattern in the WAVE INSPECTOR, ELWAVE will show the pattern (using the color of the wave degree), the TARGET BARS (using the color of the wave degree) and the SWING FILTER in the chart (the light blue line). The pattern also presents one most common target for each wave to be reached, based on the ratios of already completed waves within the pattern. 73
  • 74. Targets As mentioned before targets will be automatically displayed when the chart has been analyzed by either choosing Analyze entire chart, Analyze selected wave or Check wave count, provided you have switched on the display of targets in the WAVE INSPECTOR options. Only targets of unfinished or incomplete waves are projected! These unfinished waves display a gray cross in the WAVE BUTTONS of the WAVE TREE. These targets are represented in the TARGET BAR , which display the expected range of the pattern under investigation as a vertical line. On the vertical line you will notice small horizontal lines, which are the most probable targets based on Fibonacci price relationships. The positioning of the target bar at a specific point of the Time (or X-) axis is not relevant. If 5 wave degrees are unfinished as in the example depicted above, 5 target bars will appear, each in the color of their respective wave degree. The more these target bars converge to the same range and cluster of targets, the more likely the targets are. Of course targets can still be inserted as before by selecting a wave label- provided you have converted the analysis to manual wave labels-, clicking the right mouse button and choosing Quick targets. ELWAVE will insert channels automatically in a smart way, depending on the progress of the pattern. Elliott Wave Model Below we will give some information on the Elliott Wave model used to generate an analysis automatically. First of all we would like to emphasize that our software uses a true Elliott Wave model that incorporates every aspect as required by the Elliott Wave. The secret of the Elliott Wave is the patterns in patterns concept, which is fully supported in the software. We mention the following: Fractals As described in a later chapter of this manual, Elliott has discovered that price fluctuations and market action are of a fractal nature. Fractals are mathematical structures, which on an ever smaller scale infinitely repeat themselves. The patterns that Elliott discovered are built in the same way. An impulsive wave, which goes with the main trend, always is composed of five waves. On a smaller scale, within each of the impulsive waves of the 74
  • 75. before mentioned impulse, again five waves will be found. In this smaller pattern, the same pattern repeats itself again and so forth. Of course this fractal nature enabled us to program the Elliott Wave. The ever and ever repeating structures or patterns in prices, which are limited in number, makes it possible to detect which pattern most probably applies and in which direction the market is headed. We have defined all standard patterns plus patterns we have discovered in our extensive research and years of experience (see chapter , the Elliott Wave Principle.), which have been implemented in our “Modern” rules. Basic patterns The Elliott Wave allows for predefined patterns only. This means that only a limited number of patterns can occur in price charts, each pattern having its own unique characteristics. Meticulously, we have defined all these patterns in our rules. Once an analysis has been generated or checked, you can inspect all the rules and guidelines that belong to a specific pattern. Internal structure Internal structure refers to the internal wave structure or patterns of a pattern. (Sub)Waves of a pattern may consist of permitted patterns only!. For instance an impulsive wave 3 can never contain a zigzag pattern, if this occurs the internal structure of wave 3 is incorrect and therefore the pattern to which wave 3 belongs is incorrect, and its higher pattern is incorrect and so on… In our rules we have defined which patterns are allowed for each wave. For example, the second or B wave of a flat is allowed to contain a Zigzag, but not a Triangle, while the 3rd or C wave of a Flat can have an Extension3 but not a Zigzag pattern. Proportions In order to group waves that belong to the same degree, together building a larger degree pattern, proportions of waves are essential. Obviously waves of the same degree must approximately have the same objective measurements in time and / or price. For this purpose we have developed our proprietary “Fibonacci proportions”, that closely work together with our home made SWING FILTER, which identifies the major turning points for every wave degree. 75
  • 76. Below we first will give an example of wrong proportions and therefore an incorrect wave count: Wave 2 is far too small to be of the same degree as wave 4. Using such a method of counting waves will make it possible to come up with every wave count imaginable. Unfortunately this aspect seems to be very difficult to assess objectively. No longer using ELWAVE, which will do an objective and consistent analysis, recognizing patterns correctly as in the example below, where wave 2 and wave 4 do belong to each other: Other selection criteria Furthermore we mention some of the other criteria that have been used to determine the wave count: • waves must have enough data points of at least 8 to make it possible to define a pattern at all • of the different types of patterns possible in a wave, only the best pattern will be maintained. If for example in a wave several impulses and Extension3 are validated, only the best impulse and the best Extension3 will be listed • in an extended wave where a wave 1 and wave 2 again is followed by a wave 1 and 2 of lower degree, at maximum sub wave 1 can be a little longer than its parent wave 1 76
  • 77. • apart from the checks visible in the WAVE INSPECTOR, several proprietary checks have been implemented to determine the validity of a wave count 77
  • 78. Ranking Alternative Wave Counts In order to rank alternatives ELWAVE determines the probability of alternatives that have been validated. Patterns that remain, have a correct internal structure and satisfy every rule as defined in all sub patterns and waves. The scores or probability of every pattern have a relative significance. If scores of patterns are more or less the same (difference of less than 5 points), they should be regarded to have a more or less equal probability. A score above 40 should be regarded as relatively high, while a score under 20 makes a pattern less likely. Of course these scores can still increase as the pattern progresses. Every validated wave count gets a score that, among other factors, takes into account the following: • general probability of the occurrence of patterns, for example one of the most frequent encountered patterns is an Extension3 (Extension in the 3rd wave) • probability of the occurrence of patterns in a particular wave, f.e. a Zigzag in a wave 2 is very common, but less likely in wave 4 of an impulsive pattern • Fibonacci Proportions, the more waves have the same measurements, the better their scores • Fibonacci Time ratios, the more and better Fibonacci time relationships can be found, the higher the score • Fibonacci Price ratios, the more and better Fibonacci price relationships can be found, the higher the score • guidelines, the more guidelines are satisfied, the higher the score of a pattern • scores of sub waves and sub patterns, the better sub waves of a wave score on all of the above mentioned aspects, the higher the total score. 78
  • 79. Inspecting Alternative Wave Counts On every wave degree alternative wave counts can be inspected. The main alternatives of the highest wave degree or time frame are listed in the WAVE TREE. In order to investigate alternatives of sub waves, click on the WAVE BUTTON in the WAVE TREE and expand the WAVE TREE if necessary. Next click with the right (not the left!) mouse button on that WAVE BUTTON and a list of alternatives for this wave will appear. Selecting one of these alternatives will display the alternative in the chart. This can be repeated for every wave that has been listed in the WAVE TREE. Remember that always the best alternative on every wave degree will be listed on top. Nevertheless it could be possible that a less probable alternative wave count or pattern ends up to be the one markets are following. 79
  • 80. Multiple Time Frames As known to experienced traders, each time frame has its own characteristics such as trend, volatility and momentum as well as support and resistance areas. The shorter the time frame you are able to assess correctly, the earlier you will get signals for the larger trend of which the shorter trend takes part. Obviously you need to inspect multiple time frames using a consistent and objective methodology. That is exactly one of the strengths of the Elliott Wave provided it is applied correctly. The Elliott Wave is nothing but clearly picturing multiple time frames, since it is composed of patterns in patterns, where the shorter-term patterns give precious information on the larger pattern in progress and every pattern from small to large covers a specific time frame. What’s more, using its SWING FILTER ELWAVE will automatically group waves together that belong to the same time frame, which in Elliott Wave terms are referred to as wave degrees. ELWAVE includes an Automatic compression option, which is very convenient to use in conjunction with the WAVE TREE. If you disable automatic compression the WAVE TREE will no longer clearly present the attached time frames. Thereby ELWAVE automatically finds the time frames or wave degrees that are of value in a particular price movement. Normally a trader has to try multiple time compression settings from monthly to weekly, daily, hourly, 15 minutes etc., in order to find the time frames that apply, being aware of the fact that time frames vary from time to time. The wave degrees ELWAVE will come up with, will show the multiple time frames that are in existence for this market or stock. Activating the highest wave degree, by clicking on the WAVE BUTTON of the pattern of largest degree in the WAVE TREE, will show the largest trend or time frame immediately. Clicking on one of the buttons of the sub waves of this pattern will present the lower time frame and so on, down to the smallest time frame in existence. 80
  • 81. Converting Automatic Wave Counts to Manual Counts You can convert the selected alternative from the automatically generated wave counts by choosing Convert to Wave Count from the Analyze menu. The manual wave count will appear in a separate chart document. You can convert to a manual wave count as many times as you like. In order to save an alternative as a scenario, choose from the main menu File and select Save as to save the wave count as a scenario. 81
  • 82. Analysis Options You can adjust important variables that determine the outcome of an Automatic analysis, by changing the default setup. Select one of the presettings presented. The following settings are available (version 6.0): Pattern definitions You can choose either the CLASSIC or the MODERN RULES version. The Classic version adheres to a very strict interpretation of the Elliott Wave Analysis Type By choosing one of the presettings you will set the detail of the SWING FILTER as well as the analysis depth or number of wave degrees to inspect. The SWING FILTER will search for major turning points for every wave degree, grouping waves of the same degree together. If you instruct ELWAVE to use a more detailed analysis, the SWING FILTER will find more turning points automatically, revealing more variations of possible wave counts. By default the SWING FILTER (pale blue line) will be shown in the chart by clicking on a button of the WAVE TREE, select pattern in chart in the WAVE INSPECTOR for switching it on or off. FAST this will produce a wave count of three wave degrees very fast using a SWING FILTER that identifies the major turning points only. DETAILED again a three wave degrees deep analysis is produced, but this time the SWING FILTER will search for a lot more turning points (around 8) at the highest wave degree level. This option produces many alternatives and we advise this to be used by experts only, who can eliminate alternatives themselves. PRECISE using this setting a detailed SWING FILTER will inspect patterns four wave degrees deep and use a lot more turning points to inspect many more alternatives. Below an example of an analysis depth of 3 wave degrees in wave 3 is shown. The pattern is called an Extension3 since the 3rd wave is extended. This pattern must consist of 5 waves, which is correct. 82
  • 83. Extra wave degrees Adjusting this option allows for automatically adding extra time frames or wave degrees during the analysis. It will analyze the most recent price data in more detail giving more information on the smallest patterns in patterns. The more extra time frames you require, the more time it will take to complete the analysis. Minimum Bars Enough bars or data points must be available in order to recognize reliable Elliott Patterns. If Minimum bars has been set to 20, the software will return an undefined pattern if it encounters less then 20 bars in a pattern. We recommend setting this option to 8 bars for End of Day charts. Of course ELWAVE will allow you to adjust settings in order to get results faster, detect more complicated patterns or to get a more detailed result. 83
  • 84. Analysis Example In this section we will give another example of generating an Automatic analysis. Once an analysis has been generated the WAVE TREE, the WAVE INSPECTOR and the chart with its current wave count will be displayed. Now it is possible to further inspect and analyze the wave count that has been generated. Click on a WAVE BUTTON in the WAVE TREE to inspect and display that section of the chart. The chart will zoom in and display correct detail automatically. The WAVE INSPECTOR will give a lot of information on the wave or pattern selected. On top at the left, the WAVE INSPECTOR will show validated patterns at the right dismissed patterns. Both can be inspected, as you like. Click on the pattern to display all information in the WAVE INSPECTOR, which feature makes the Elliott Wave completely transparent. The pattern has been described, the internal structure of the pattern has been checked, all Fibonacci ratios are presented and rules as well as guidelines can be inspected. Clicking one of these rules or guidelines will visualize it in the chart. For more information, see the next chapter, where WAVE TREE and WAVE INSPECTOR have been explained in more detail. 84