

Recommended
More Related Content
What's hot
What's hot (20)
Viewers also liked
Similar to Map Making with QGIS
Similar to Map Making with QGIS (20)
More from Sagar Arlekar
More from Sagar Arlekar (6)
Recently uploaded
Recently uploaded (20)
Map Making with QGIS
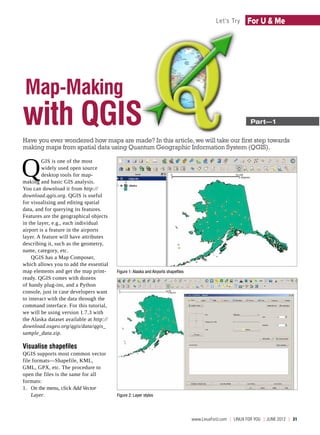
- 1. Let's Try For U & Me Map-Making with QGIS Part—1 Have you ever wondered how maps are made? In this article, we will take our first step towards making maps from spatial data using Quantum Geographic Information System (QGIS). Q GIS is one of the most widely used open source desktop tools for map- making and basic GIS analysis. You can download it from http:// download.qgis.org. QGIS is useful for visualising and editing spatial data, and for querying its features. Features are the geographical objects in the layer, e.g., each individual airport is a feature in the airports layer. A feature will have attributes describing it, such as the geometry, name, category, etc. QGIS has a Map Composer, which allows you to add the essential map elements and get the map print- Figure 1: Alaska and Airports shapefiles ready. QGIS comes with dozens of handy plug-ins, and a Python console, just in case developers want to interact with the data through the command interface. For this tutorial, we will be using version 1.7.3 with the Alaska dataset available at http:// download.osgeo.org/qgis/data/qgis_ sample_data.zip. Visualise shapefiles QGIS supports most common vector file formats—Shapefile, KML, GML, GPX, etc. The procedure to open the files is the same for all formats: 1. On the menu, click Add Vector Layer. Figure 2: Layer styles www.LinuxForU.com | LINUX For You | JUNE 2012 | 31
- 2. For U & Me Let's Try 2. Browse to the source (for our example, the qgis_sample_data/ shapefiles directory). 3. Select the files (in our case, alaska. shp and airports.shp). Figure 1 shows the Map Canvas with the Alaska and Airports layers. Layer styles Styling allows us to set fill colours, patterns, borders, icons, etc, for the features in the layer: 1. Right click the Airport layer in the Layers panel and select Properties. 2. Under the Style tab you can change the symbol and colour, the size of the symbol, set transparency, and categorise the features (see Figure 2). Layer labels Figure 3: Feature labels Labels are text identifiers for features in the layer. QGIS allows you to choose the attribute you want to show as the label, and set its style too (see Figure 3): 1. Right click the Airport layer and select Properties. 2. Under the Labels tab, check mark Display Labels. 3. Select the Field Containing Label; this is the text to be shown on the layer. 4. Set the font size, colour, type, and the text position with respect to the feature location. Attributes table Attributes describe the features in a layer. The attribute values can be edited and queried. To view attribute names and data, right click the Airport layer and choose Open Attribute Table. To query features of your interest, add the text to filter the data in the Look Figure 4: Feature selection For text box, and select the desired field. For instance: look for ‘Military’ in the format as ESRI Shapefile and save. publish a map, plot custom data and field ‘Cat’. Then hit Search. You will In Part II, we will learn how to perform geoprocessing. find that all military airports are selected and highlighted in the Attribute Table, By: Sagar Arlekar & Niket Narang as in Figure 4, and on the map. For The authors are researchers at the Center for Study of Science, Technology complex queries, try Advanced Search. and Policy (CSTEP), Bengalore. They work in the fields of GIS and Agent-Based Selected features can be saved as Simulation. At CSTEP they have built a web-based GIS framework to simulate and visualize disaster impact. They love working with open source tools and are active a new shapefile: click Layer > Save contributors to Openstreetmaps. Selection as vector file. Select the 32 | JUNE 2012 | LINUX For You | www.LinuxForU.com