1. A&A 525, A92 (2011) Astronomy
DOI: 10.1051/0004-6361/201015425 &
c ESO 2010 Astrophysics
A deep wide-field sub-mm survey of the Carina Nebula complex
T. Preibisch1 , F. Schuller2 , H. Ohlendorf1 , S. Pekruhl1 , K. M. Menten2 , and H. Zinnecker3
1
Universitäts-Sternwarte München, Ludwig-Maximilians-Universität, Scheinerstr. 1, 81679 München, Germany
e-mail: preibisch@usm.uni-muenchen.de
2
Max-Planck-Institut für Radioastronomie, Auf dem Hügel 69, 53121 Bonn, Germany
3
Astrophysikalisches Institut Potsdam, An der Sternwarte 16, 14482 Potsdam, Germany
Received 19 July 2010 / Accepted 30 September 2010
ABSTRACT
Context. The Great Nebula in Carina is one of the most massive (M∗,total > 25 000 M ) star-forming complexes in our Galaxy and
∼
contains several stars with (initial) masses exceeding ≈100 M ; it is therefore a superb location in which to study the physics of violent
massive star-formation and the resulting feedback effects, including cloud dispersal and triggered star-formation.
Aims. We aim to reveal the cold dusty clouds in the Carina Nebula complex, to determine their morphology and masses, and to study
the interaction of the luminous massive stars with these clouds.
Methods. We used the Large APEX Bolometer Camera LABOCA at the APEX telescope to map a 1.25◦ × 1.25◦ (=50 × 50 pc2 )
region at 870 μm with 18 angular resolution (=0.2 pc at the distance of the Carina Nebula) and an rms noise level of ≈20 mJy/beam.
Results. From a comparison to Hα images we infer that about 6% of the 870 μm flux in the observed area is likely free-free emission
from the HII region, while about 94% of the flux is very likely thermal dust emission. The total (dust + gas) mass of all clouds for
which our map is sensitive is ∼60 000 M , in good agreement with the mass of the compact clouds in this region derived from 13 CO line
observations. There is a wide range of different cloud morphologies and sizes, from large, massive clouds with several 1000 M , to
small diffuse clouds containing just a few M . We generally find good agreement in the cloud morphology seen at 870 μm and the
Spitzer 8 μm emission maps, but also identify a prominent infrared dark cloud. Finally, we construct a radiative transfer model for the
Carina Nebula complex that reproduces the observed integrated spectral energy distribution reasonably well.
Conclusions. Our analysis suggests a total gas + dust mass of about 200 000 M in the investigated area; most of this material is in
the form of molecular clouds, but a widely distributed component of (partly) atomic gas, containing up to ∼50% of the total mass,
may also be present. Currently, only some 10% of the gas is in sufficiently dense clouds to be immediately available for future
star formation, but this fraction may increase with time owing to the ongoing compression of the strongly irradiated clouds and the
expected shockwaves of the imminent supernova explosions.
Key words. stars: formation – ISM: clouds – ISM: structure – ISM: individual objects: NGC 3372 – submillimeter: ISM
1. Introduction (65 O-type stars; see Smith 2006), including several of the most
massive and luminous stars known in our Galaxy. The Carina
Most stars in the Galaxy are born in massive star-forming re- Nebula complex (CNC hereafter) has a total infrared luminos-
gions (e.g., Briceno et al. 2007). The massive stars profoundly ity of ∼107 L and a size of about 50 pc, corresponding to an
influence their environments by creating H ii regions, generating extent of 1.25◦ on the sky. Most of the massive stars reside
wind-blown bubbles, and exploding as supernovae. This feed- in one of several clusters (Tr 16, Tr 14, Tr 15; see Trumpler
back disperses the natal molecular clouds (e.g., Freyer et al. 1930) with ages ranging from ∼1 to several Myr. In the cen-
2003), thus in principle halting further star formation, but ion- tral region around η Car and the Tr 16 cluster, the molecular
ization fronts and expanding superbubbles can also compress clouds have already been largely dispersed by stellar feedback.
nearby clouds and may thereby trigger the formation of new gen- In the South Pillars (southeast of η Car) the clouds are eroded
erations of stars (e.g., Dale et al. 2005; Dale & Bonnell 2008; and shaped by the radiation and winds from η Car and Tr 16,
Gritschneder et al. 2009). These processes determine the key giving rise to numerous giant dust pillars, which feature very
outputs from star-formation, such as the stellar mass function, prominently in the mid-infrared images made with the Spitzer
the total star formation efficiency, and the frequency of planetary Space Observatory (Smith et al. 2010b). The detection of young
formation. Detailed observational diagnostics of these processes stellar objects (Megeath et al. 1996) and a very young cluster
have been hard to come by, mainly because regions with large (the “Treasure Chest Cluster”; see Smith et al. 2005) embedded
populations of massive stars and strong feedback are usually too within the heads of some of the dust pillars suggests that the for-
far away for detailed studies. mation of a new generation of stars is currently triggered in this
At a distance of 2.3 kpc, the Carina Nebula (NGC 3372; area.
see, e.g., Smith & Brooks 2008, for an overview) is the
nearest southern region with a large massive stellar population Because of its prominence on the sky, the CNC has been
the target of numerous observations in almost all wavelength
Based on data acquired with the Atacama Pathfinder Experiment bands from γ-rays to the radio regime (see Smith & Brooks
(APEX). APEX is a collaboration between the Max-Planck-Institut für 2008, for a summary). Recent deep large-scale surveys of the
Radioastronomie, the European Southern Observatory, and the Onsala CNC have been obtained with the the Hubble Space Telescope
Space Observatory. (HST) (Smith et al. 2010a), the Spitzer infrared observatory
Article published by EDP Sciences A92, page 1 of 14
2. A&A 525, A92 (2011)
(Smith et al. 2010b), the near-infrared camera HAWK-I at the hexagonal layout consisting of a center channel and nine concen-
ESO Very Large Telescope (Preibisch et al. 2011a, in prep.), and tric hexagons. The angular resolution is 18.6 , and the total field
the Chandra X-ray observatory (Townsley et al. 2011; Preibisch of view for LABOCA is 11.4 , making it an ideal instrument for
et al. 2011b). All these together will allow us for the first time mapping large regions with high sensitivity. At the 2.3 kpc dis-
to identify the young low-mass star population in the complex tance of the Carina Nebula, its angular resolution corresponds
without the strong confusion problems that plague studies based to a linear dimension of 0.2 pc. This is sufficient to resolve the
only on optical and infrared data sets. structure of molecular clumps (i.e. relatively large dense clouds
However, any really comprehensive investigation of this re- linked to the formation of small stellar clusters), but not the in-
gion clearly also requires information on the cool dust and dividual cloud cores (i.e. very compact clouds out of which indi-
gas in the (molecular) clouds, and the deeply embedded pro- vidual stellar systems form), which have typical sizes of ∼0.1 pc
tostars within these clouds. During the very earliest stages of or less.
star formation, these dense gas clumps and cores remain very The LABOCA observations of the CNC discussed here were
cold (10−30 K), and therefore escape detection at near- and obtained on 22, 24 and 26 December 2007. For the mapping
mid-infrared wavelengths, even with instruments as sensitive we employed the “raster map in spiral mode”. The total area
as Spitzer. Only the (sub-) millimeter and radio emission from to be mapped was covered with a raster of pointings similar to,
molecular spectral lines and from cool dust allows for an al- but larger than the one shown in Fig. 9 of Siringo et al. (2009).
most un-hindered, unique view onto the processes in the dense At each pointing, fully sampled maps of the total field-of-view
clouds. In order to meaningfully complement the extraordinary of LABOCA were obtained by moving the telescope along a
quality of the recent HST, Spitzer, Chandra, and HAWK-I data, spiral pattern. The total on-source integration time used for our
(sub-)mm observations with high spatial resolution, high sensi- mapping of the CNC was ≈10 h. The observing conditions were
tivity, and large spatial coverage (at least 1 square-degree) are good, with a precipitable water vapor column of <2 mm.
therefore clearly required. The data were reduced with the BOlometer array Analysis
Until recently, the best existing mm-band data set was the software (BOA) package, following the procedures described
SEST/SIMBA survey of the central region of the Carina Nebula in detail in Schuller et al. (2009). As the final product of the
by Brooks et al. (2005). Their map of the 1.2 mm continuum data analysis, a map with a pixel size of 6.07 (i.e. ∼3 pixels
emission covers an area of 10 × 10 with a half-power beam per beam) was compiled. With a LABOCA beamsize of
width of 24 ; with a sensitivity limit of 75 mJy per beam, clumps 392 square-arcseconds, the pixel-to-beam-size ratio for the
with masses down to ∼5 M were detected in this survey. Gomez transformation from surface brightness to integrated fluxes
et al. (2010) recently studied the central 30 × 30 area of the is 0.0941 beams/pixel.
CNC, covering η Car and the Keyhole Nebula, at 870 μm with The data were calibrated by applying an opacity correction,
LABOCA at the APEX telescope. At radio wavelengths, the as determined from skydips observed typically every two hours
most comprehensive existing data set is a NANTEN survey in (see Siringo et al. 2009). In addition, the flux calibration was reg-
several CO lines, covering a 4◦ × 2◦ area with a half-power beam ularly checked against primary calibrators (planets) or secondary
width of 2.7 (Yonekura et al. 2005). The Mopra 12 CO (1–0) calibrators (bright Galactic sources). The total calibration error
data with a 43 beam presented by Brooks et al. (1998) (see also should be lower than 15%.
Schneider & Brooks 2004) provide better spatial resolution, but A fundamental limitation comes from the removal of corre-
cover only a small area in the central part of the CNC. There was lated noise in the data reduction; because of this, our map is not
therefore an obvious need for (sub-)mm-data with high spatial sensitive to any structures with angular sizes larger than the ar-
resolution as well as high sensitivity, that cover a considerably ray (≥10 ) and can only partly recover emission on scales larger
larger part of the CNC. than ≈2.5 . As a consequence, possible uniform emission on an-
In this paper we present the results of our large-scale sub-mm gular scales >2.5 is filtered out and thus absent in our map.
∼
mapping of the CNC with LABOCA at the APEX telescope. Our Therefore, the fluxes we measure in our map are always lower
map covers a ∼6 times larger area and is about twice as sensitive limits to the true sub-mm sky fluxes. The amount of this un-
as the sub-mm data from Gomez et al. (2010). After the descrip- seen flux depends on the (unknown) spatial distribution of the
tion of the observations and data analysis (Sect. 2), we discuss total emission in the map. If most of the emission comes from
general aspects (Sect. 3), describe the structure and properties well localized, dense clouds, the missing flux will be very low
of the clouds in different regions within the complex (Sect. 4) or even negligible; the fluxes from individual compact (<2.5 )
and compare them to recent Spitzer maps (Sect. 5). In Sect. 6 we clouds can be reliably determined. If, on the other hand, there is
take a look at the sub-mm properties of dense molecular clumps bright large-scale emission, the measured flux can be consider-
found in CO line observations, and in Sect. 7 we consider global ably lower than the true total flux. These issues will be discussed
properties of the complex, such as the total cloud mass, and per- in more detail in Sect. 7.1.
form radiative transfer modeling of the integrated spectral en-
ergy distribution to derive a global model for the CNC.
3. General results
2. Observations and data analysis The result of our LABOCA observations is a map of the 870 μm
emission, covering a total area of 1.25◦ × 1.25◦; it is shown in
The sub-mm observations of the CNC presented here were per- Fig. 1. The rms noise level in the map is ≈20 mJy/beam. For
formed with the “Atacama Pathfinder EXperiment” (APEX), isolated compact clumps with assumed uniform temperatures of
a 12-m radio telescope in Chile’s Atacama desert, the best T ≈ 20−30 K, this corresponds to a nominal sensitivity limit for
accessible site for submillimeter observations. The APEX the clump masses of ∼2 M . This map provides the first spatially
telescope is described in detail in Güsten et al. (2006). complete survey of the sub-mm emission in the CNC.
We used the Large Apex BOlometer CAmera LABOCA The maximum intensity in our map, 31.5 Jy/beam, is found
(see Siringo et al. 2009), which operates in the atmospheric win- at the position of η Car. Emission from clouds is seen with inten-
dow at 870 μm (345 GHz). It has 295 pixels arranged in a sities up to ≈4 Jy/beam. From these maximum cloud fluxes we
A92, page 2 of 14
3. T. Preibisch et al.: Deep wide-field sub-mm survey of the Carina Nebula
-59:20
-59:40
Declination
-60:00
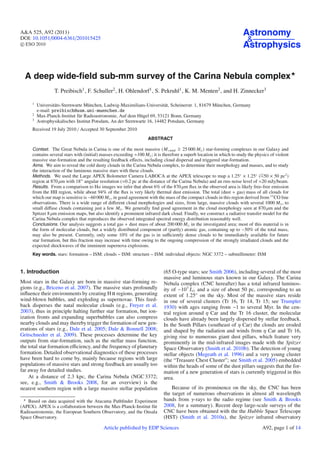
Fig. 1. False-color representation of the wide-
field LABOCA map of the Carina Nebula com-
plex. The cyan crosses mark the positions of the
massive (O- and early B-type) stellar members
of the Carina Nebula from Smith (2006), the
-60:20 green circles mark the locations and radii of the
dense C18 O clumps detected by Yonekura et al.
(2005) in this area. The field-of-view is ≈1.3◦ ×
10:50 10:48 10:46 10:44 10:42 10:40 1.3◦ , corresponding to a size of ≈52 × 52 pc at
Right ascension the distance of the complex; the grid shows the
J2000 coordinates. The units of the scale bar at
0 0.5 1 1.5 2 2.5 3 the bottom are Jy/beam.
can immediately infer (see, e.g., Eq. (3) in Schuller et al. 2009) visible in the optical red DSS image (see Fig. 2) closely follows
that the optical depth of the emitting clouds in our map is small, the Hα emission.
τ870 μm < 0.01, i.e. all observed cloud emission is clearly in the While these optical images trace the ionized gas, the distri-
optically thin limit. bution of the cold molecular gas can be inferred from molecular
In order to determine the total sub-mm flux in our LABOCA line maps. A comparison of the optical images with the CO maps
map, we excluded 25 pixel-wide edges of the mosaic, where presented in Yonekura et al. (2005) shows a fairly clear spatial
the pixel values are often dominated by noise, and integrated all anti-correlation between the ionized and the molecular gas in the
pixel values exceeding the 3σ noise level of 60 mJy/beam. We CNC (see also Fig. 3 in Smith & Brooks 2007, SB07 hereafter).
found a total 870 μm flux of 1147 Jy for our map. Strong Hα emission is predominantly concentrated in the very
center of the CNC, close to η Car and the hot stars in Tr 16, as
well as near the massive cluster Tr 14. The CO emission, on the
3.1. Nature of the observed sub-mm emission other hand, is concentrated in two large cloud structures, approx-
Two fundamentally different emission mechanisms can con- imately to the north and south of η Car.
tribute to the observed 870 μm continuum emission: thermal Our comparison of the LABOCA map to the red optical im-
emission from dust, and free-free emission from ionized gas. age in Fig. 2 confirms this anti-correlation. Most of the sub-mm
The second mechanism is relevant in some parts of the CNC, emitting clouds are located in regions more than a few arcmin-
where the numerous massive stars produce an extremely strong utes away from η Car, where no (or at most very weak) Hα
ionizing radiation field and create extended stellar wind bubbles. emission can be seen, and often correlate well with the molec-
The Hα line is a good and easily detectable tracer of ionized ular emission. In these regions, the sub-mm emission is dom-
gas. To localize Hα emission in the region we retrieved from the inated by thermal emission from cool dust. However, we also
ESO archive images obtained with the Wide Field Imager at the find some sub-mm emission in the central parts, very close to
MPI-2.2 m Telescope through an Hα filter (λcenter = 658.827 nm, η Car or Tr 14. In these regions, the sub-mm emission is likely
FWHM = 7.431 nm) for inspection. We also used the pub- to be strongly contaminated and probably dominated by free-free
licly available High Level Science Products of the HST ACS emission, instead of thermal dust emission.
Hα Survey of the Carina Nebula1 , Version 21 December 2009, A quantitative estimate of the contributions of these differ-
created by Mutchler & Bowers (2009). The diffuse emission ent emission processes to the observed total sub-mm flux can
be made in the following way: The total flux in the central
1
The data set and the processing are described at http://archive. 6 × 7 area, which contains η Car and the Keyhole Nebula and
stsci.edu/pub/hlsp/carina/hlsp_carina_hst_v2_readme. where most of the flux is likely free-free emission, is 70 Jy. The
txt. total flux in the whole map excluding this central area is 1077 Jy.
A92, page 3 of 14
4. A&A 525, A92 (2011)
Tr 15
10’
Tr 14
-59:30:00
η Car
-60:00:00
10:50:00 10:48:00
10:46:00 10:44:00 10:42:00
Fig. 2. False-color representation of the red optical Digitized Sky Survey image with contours of the LABOCA map overplotted. Here and (unless
noted otherwise) in the following images, the first three contour levels are 0.06, 0.12, and 0.18 Jy/beam, while the further levels increase by a
√
factor of 2. The grid shows the J2000 coordinates.
Thus we conclude that about 94% of the observed sub-mm emis- grains; the value we use here is representative for relatively
sion in our map comes from dusty clouds, whereas some 6% of dense molecular clouds (Ossenkopf & Henning 1994; Henning
the total flux is probably free-free emission. et al. 1995), but deviations by about a factor of 2 cannot be ex-
cluded.
3.2. Fluxes and cloud masses The most important factor of uncertainty is the choice of the
temperature. Firstly, the individual clouds in the CNC will have
The standard way to determine cloud masses from observed different temperatures, depending on (a) their location with re-
(sub-)mm fluxes for optically thin thermal dust emission is via a spect to the luminous massive stars and on the cloud density,
temperature-dependent scaling factor (see Hildebrand 1983), by and (b) whether or not a cloud contains embedded protostars
using the formula that heat it from inside. For some of the clouds in the CNC, tem-
perature measurements are available: Brooks et al. (2003) found
D2 F ν R
M= , (1) CO excitation temperatures of 20−30 K for the dense clouds near
Bν (T d ) κν Tr 14, and Yonekura et al. (2005) derived mean 12 CO excitation
where D is the distance to the source (2300 pc in our case), temperatures of 20−23 K for the large scale clouds and C18 O ex-
Fν is the observed spectral flux density, R is the gas-to-dust citation temperatures between 9 K and 28 K for dense clumps in
mass ratio, Bν(T d ) is the blackbody spectral flux density for a the CNC. Owing to the quite strong and non-linear dependence
dust temperature T d , and κν is the dust emissivity. Following of the mass estimates on the assumed cloud temperature2, we
Schuller et al. (2009), we assume a gas-to-dust mass ratio of
R = 100 and a dust emissivity of κ870 μm = 1.85 cm2 g−1 . The 2
For example, a flux of 0.25 Jy corresponds to a cloud mass of 23 M
dust emissivity depends on the detailed properties of the dust for T = 10 K, 7.3 M for T = 20 K, and 4.2 M for T = 30 K.
A92, page 4 of 14
5. T. Preibisch et al.: Deep wide-field sub-mm survey of the Carina Nebula
have to consider the individual conditions in each cloud in order
to derive meaningful mass estimates. Secondly, even for an in- -59:35:00
dividual compact cloud, the often used assumption of a spatially 1’
uniform “characteristic” temperature is probably not correct. A
constant temperature may appear to be a reasonable approxima-
tion for dense clumps in nearby low-mass star-forming regions
A1
(where the external heating of the clouds is weak), but detailed
modeling has shown that even in these relatively simple cases,
slight deviations from isothermality by just a few degrees can 5
easily lead to errors in the estimated clump masses by factors
of ∼2 (Stamatellos et al. 2007). In the harsh environment of the 1
CNC, where the level of cloud irradiation and heating by nearby
hot and luminous stars is orders of magnitude higher than in qui- B 4
2
escent regions, the assumption of a constant cloud temperature
in the fairly large observed clumps can thus hardly be correct.
C -59:40:00
To summarize, the uncertainties about the dust opacities and
the cloud temperatures will cause uncertainties of (at least) about
a factor of ∼2−3 for the mass estimates.
3
3.3. Cloud column densities
As discussed in detail in Sect. 3.1, the sub-mm flux we observe 10:45:00 10:44:30
in most (but not all) parts of our map is most likely thermal dust
emission. For a given cloud temperature, the observed 870 μm Fig. 3. False-color representation of the HST Hα image of η Car and
intensities are then directly proportional to the column densities the Keyhole Nebula with superposed contours of the LABOCA map.
of the interstellar matter and thus the line-of-sight extinctions. The numbers 1–5, A1, B, and C refer to the CO clumps in the Keyhole
Nebula defined in Cox & Bronfman (1995). The contour levels in this
These intensities can be converted to the beam-averaged hydro- image start at 0.06 Jy/beam and increase on a logarithmic scale by fac-
gen molecule column density via the formula tors of 1.364 (i.e. 0.135 dex).
Fν R
NH2 = , (2)
Bν (T d ) Ω κν μ mH
Gomez et al. (2010) (42 Jy in a 26 radius aperture) from another
where Ω is the beam solid angle and μ the mean molecular LABOCA observation obtained on 23 July 2007. This observed
weight. Using again the parameters from Schuller et al. (2009), constancy may be interesting in the context of the known strong
we find the following peak line-of-sight column densities for the temporal variability of the (sub-)mm fluxes by at least a factor
two locations of maximum cloud emission: NH2 ∼ 6 × 1022 cm−2 of 2 (see, e.g., discussion in Brooks et al. 2005) and also with
(corresponding to a visual extinction of AV ∼ 65 mag) for the respect to the detection of a recent significant decrease of the
cloud near Tr 14, and NH2 ∼ 4 × 1022 cm−2 (AV ∼ 50 mag) for strength of major stellar-wind emission lines in the spectrum of
the cloud at the Treasure Chest Cluster, when assuming cloud η Car, which seem to suggest a recent and very rapid decrease in
temperatures3 of 30 K in both cases. the wind density (Mehner et al. 2010).
A very prominent feature in optical images of the CNC is
the V-shaped dark cloud with its tip a few arcminutes south of
η Car. The LABOCA map shows that this feature consists of 4.2. Clouds near Tr 16 and the Keyhole Nebula region
a number of different clouds. Typical intensities in the diffuse
The loose cluster Tr 16 is located in the center of the Carina
parts of these clouds are in the range 0.2−0.5 Jy/beam, which
Nebula and includes the optically dominant star η Car as well as
(assuming again a typical dust temperature of 30 K) correspond
the majority of the O-type stars in the complex.
to column densities of NH2 ∼ 3−7 ×1021 cm−2 and extinctions of
AV ∼ 3−7 mag. These fairly moderate values agree well with the The Keyhole Nebula Region, immediately to the north of
fact that the V-shaped dark cloud is transparent and thus invisible η Car, is the best-observed part of the CNC and the only region
in near-infrared images of the CNC. that has already been studied in detail at sub-mm and mm wave-
lengths. The comparison of our LABOCA map to the optical Hα
mosaic obtained with the HST is shown in Fig. 3. Comparison of
4. Results for individual parts of the complex our LABOCA map to the SIMBA 1.2 mm map of Brooks et al.
(2005) generally shows a good agreement in observed cloud
4.1. η Car morphologies. This central region was recently studied with in-
The famous object η Car is a close binary with strong wind-wind dependent LABOCA observations by Gomez et al. (2010). With
interaction (see, e.g., Groh et al. 2010). The (sub-)mm emission a noise level of ≈40 mJy/beam, their data are about half as sen-
is known to be free-free emission from ionized gas in its stellar sitive as ours. A comparison of our map to their results shows
wind. good agreement in the general morphology and levels of the sub-
In our LABOCA map, we measure a source flux of ≈43 Jy in mm emission, although our map reveals (as expected) weaker
a circular aperture of radius 26 for η Car. This flux value seen emission structures. Gomez et al. (2010) discuss in detail the
on 26 December 2007 is nearly identical to the flux derived by relation between the sub-mm emission and the emission from
ionized gas, as seen in Hα in the central few arcminutes around
3
The choice of T = 30 K was made because these clouds are irradiated η Car. For most of the cloud structures they found a close cor-
(=heated) by stars either near or within these clouds. relation between ionized gas, emission at both mm and radio
A92, page 5 of 14
6. A&A 525, A92 (2011)
Table 1. LABOCA fluxes of the CO clumps in the Keyhole Nebula
listed in Cox & Bronfman (1995). 2’
Clump M(CO) F(870 μm) M870 (20 K) M870 (30 K)
# [M ] [Jy] [M ] [M ]
CB-A1 14 0.54 ± 0.08 15.8 9.1
CB-B 3 0.20 ± 0.03 5.8 3.4 -59:30:00
CB-C 6 0.25 ± 0.04 7.3 4.2
CB-1 17
CB-2 11
CB-3 4 <0.06 <1.8 <1.0
CB-4 6 0.29 ± 0.04 8.5 4.9
CB-5 1 0.13 ± 0.02 3.8 2.2
wavelengths, and the sub-mm emission. Together with the clear
lack of strong molecular line emission in this region (Yonekura
et al. 2005) this suggests that the 870 μm emission here origi-
nates predominantly from ionized material, and not from dust.
However, some weak molecular line emission is neverthe-
less present in this region: Cox & Bronfman (1995) discov- 10:44:00 10:43:00
-59:40:00
ered CO emission at eight different positions near the Keyhole
Nebula, including three peaks aligned with the centers of the op- Fig. 4. False-color representation of the red DSS image for the region
tically darkest parts of the Keyhole Nebula (their positions 1, near Tr 14 with superposed contours of the LABOCA map.
2, and 3). In the following discussion of the sub-mm emission
seen in our LABOCA map at the location of these clumps, we
use their clump numbers with the prefix “CB”. We clearly see
Cox & Bronfman (1995), the temperature of this clump must be
compact 870 μm emission at the locations of all their clumps
≤12 K to explain the non-detection in our sub-mm map.
with the exception of CB-1, CB-2, and CB-3. In order to esti-
mate the fluxes of the sub-mm detected CO clumps, which ap- This cold temperature suggests that this, and the other two
pear as compact sources superposed on top of fairly strong and non-detected dark clouds are only seen this close to the massive
inhomogeneous diffuse emission, we performed aperture pho- stars in projection, but are actually located at least a few parsec in
tometry at these positions, using circular apertures with radii front of Tr 16; otherwise, one would expect considerably higher
of 2.4 pixels and annular sky regions between 1.5 times and cloud temperatures because of the strong radiative heating.
twice the aperture radius. Note that the inhomogeneous diffuse To conclude the discussion of this central region, we note
background emission in this area is a serious complication for that all clouds in this area are only of rather low mass. The orig-
flux determinations, and thus the expected uncertainties of our inal mass out of which the numerous massive stars formed has
background-subtracted aperture fluxes listed in Table 1 are prob- been already nearly completely dispersed, leaving only a few
ably not less than ∼30%. We also list clump masses derived via small globules behind.
Eq. (1), assuming two different values for the temperature, 20 K
and 30 K. The mass estimates based on T = 20 K are always 4.3. Clouds near Tr 14
higher than the masses derived from the CO lines by Cox &
Bronfman (1995), but the estimates based on T = 30 K agree The cluster Tr 14 is the second most massive cluster in the Carina
within a factor of ∼2 to the CO masses. This suggests that the Nebula; with 10 O-type stars it is about a factor of four less mas-
material in these clumps is fairly warm, probably because of the sive than Tr 16, but its spatial configuration is considerably more
close proximity to the very luminous stars in this area, which compact. The brightest sub-mm emitting cloud complex in our
strongly heat them. map is found a few arcmin to the west of Tr 14. Together with
For the three CO clumps coinciding with the optically dark a number of more diffuse clouds to the southeast, this complex
Keyhole nebula features, CB-1, CB-2, and CB-3, no clear detec- constitutes the western part of the optically prominent V-shaped
tion of sub-mm emission can be established from our data. In dark nebula in the CNC.
deed, we find local minima of the extended sub-mm emission Although the massive cluster Tr 14 contains a substantial
in the Keyhole area at these three positions. The strong 870 μm number of hot O-stars that produce large amounts of ionizing
emission slightly to the north of CB-1 is related to the clump flux, the situation here seems to be quite different from that in
CB-A2. More quantitative statements are hard to make for CB-1 the Keyhole Nebula region. The comparison of the LABOCA
and CB-2, because these regions are strongly affected by blend- maps and the optical image (Fig. 4) clearly shows a strong anti-
ing with the emission from the long linear structure, Car II, to the correlation of Hα and sub-mm emission. This may be at least
north of η Car. CB-3, on the other hand, is located at a less con- partly explained by the fact that the cloud to the west of Tr 14 is
fused region of our map and can be characterized in more detail. much denser and more massive than the clouds in the Keyhole
We find no significant sub-mm emission at this position; with area, and the ionizing radiation therefore can affect only the
a maximum intensity of 0.04 Jy/beam, all pixel values in this cloud surface, but not penetrate the cloud. The edge where this
region remain well below the 3σ noise limit of 0.06 Jy/beam. cloud faces the stellar clusters is the site of a prominent Photon
Assuming an upper limit for the sub-mm flux of CB-3 of Dominated Region (PDR), which has been studied in some
0.06 Jy, we can confirm that given a mass of 4 M as derived by detail by Brooks et al. (2003) and Kramer et al. (2008). From
A92, page 6 of 14
7. T. Preibisch et al.: Deep wide-field sub-mm survey of the Carina Nebula
molecular line observations of the dense cloud to the west
of Tr 14, Brooks et al. (2003) estimated a total cloud mass
of ∼20 000 M and determined CO excitation temperatures of
20−30 K.
Integrating in our LABOCA map over all pixel values above
the 3σ noise level with a radius of 4 from the peak of emission,
we find a 870 μm flux of 157 Jy. Most of the flux (98 Jy) comes
from the brightest central parts of the emission at levels above
0.5 Jy/beam. Assuming a cloud temperature of 20 K, the total
cloud flux of 157 Jy corresponds to a cloud mass of ∼4600 M ,
i.e. a value substantially lower than the estimate based on the
molecular line observations. Considering our above estimate for
the column density through the densest parts of this cloud, NH2 ∼
6 × 1022 cm−2 , it may well be that the temperature in the inner,
dense parts of the cloud, where most of the mass resides, is lower
than 20 K. Assuming a characteristic dust temperature of 10 K
yields a mass of ∼14 400 M . Considering the uncertainties in
the mass determinations described above, this value would agree
reasonably well with the mass estimate from CO.
Finally, we consider the relation between the stellar cluster
Tr 14 and the surrounding clouds. The area within <2 of the
∼
cluster center is largely devoid of sub-mm emission, suggesting
that the original cloud has been largely dispersed by the feed- Fig. 5. False-color representation of the 2MASS K-band image of the
area around the Treasure Chest Cluster (located at RA (J2000) =
back from the massive stars. In a recent study of the Tr 14 stellar
10h 45m 54s , Dec = −59◦ 56 50 ) with superposed contours of the
population, Sana et al. (2010) claimed an age of no more than LABOCA map.
0.3−0.5 Myr for the cluster. If this very young age is true, one
would expect to see the expelled remnants of the original cloud
out of which the cluster formed to be still relatively close to the 4.4. Clouds near the cluster Tr 15
cluster. Might the elongated cloud complexes to the south-west
and north-east of Tr 14 be this expelled material? We can inves- The northern cluster Tr 15 is considerably smaller and less
tigate this question by comparing the masses of these clouds to prominent than Tr 14 and Tr 16. Containing 6 O-type stars, its
the expected mass of expelled gas in the formation of a dense total ionizing radiation output is about one order of magnitude
cluster. The total stellar mass of Tr 14 is Mstars ∼ 4000 M (Sana weaker than for Tr 14 and Tr 16. The cluster is thought to be
et al. 2010). Assuming that <30% of the original cloud mass
∼ somewhat older than Tr 14 and Tr 16, probably around 6−8 Myr
have been transformed into stars (i.e. a star formation efficiency (see, e.g. Tapia et al. 2003).
<
of ∼30%, see Lada & Lada 2003), and the other ∼70% have been Only moderately bright sub-mm emission is seen in this area
expelled, the mass of the expelled clouds should be >9300 M .
∼ (see Fig. 2). None of the clouds near Tr 15 shows morphologi-
This estimate is actually consistent with the total mass of the cal indications of feedback from stars in Tr 15. The cloud to the
two largest cloud complexes seen near Tr 14 in Fig. 4: the total south-east of the cluster shows a prominent pillar-like structure,
870 μm flux of the elongated cloud northeast of Tr 14 is ≈35 Jy, but it points toward the south, clearly suggesting that it is irra-
corresponding to a cloud mass of ∼1000 M (for an assumed diated by massive stars in the south (presumably in Tr 16), not
temperature of 20 K). The total mass of the cloud complex to from Tr 15.
the southwest of Tr 14 is, as estimated above, ∼14 000 M . We One elongated dusty cloud, pointing toward the southwest-
thus conclude that the total mass of surrounding clouds within ern direction, covers the western half of the cluster area. It is
a few parsecs from Tr 14 is about as large as expected, if we interesting to note that many of the OB stars in Tr 15 are ap-
assume these clouds to be the remnant of the cloud out of which parently aligned along the northeastern rim of this cloud. This
Tr 14 formed and have been recently expelled by the action of may be an extinction effect, suggesting perhaps that the cloud is
the massive stars in Tr 14. only seen in projection in front of Tr 15 and is not physically
The spatial distribution of these clouds, however, does not associated.
follow the morphology expected for a (more or less) homoge-
neous bubble around the cluster, as seen in many other massive 4.5. Clouds in the South Pillars
star forming regions (e.g., Deharveng et al. 2009). Inspection
of Fig. 4 shows no circular alignment of clouds around Tr 14, The so-called South Pillars are a complex of strongly irradiated
but rather a morphology suggesting a “broken ring”, which is clouds south of η Car, featuring very prominently in Spitzer im-
open in the northwestern and southeastern direction. A possi- ages. Our LABOCA map reveals several large and dense, as well
ble explanation of this morphology is that the clouds form a as numerous small and more diffuse clouds in this area. A num-
thick ring-like structure around Tr 14, which we see nearly edge- ber of these clouds show prominent cometary shapes pointing
on. Beaumont & Williams (2010) recently suggested that many towards η Car. In many cases, the sub-mm morphology closely
apparent bubbles around young clusters are actually not three- follows the shape of the cloud surfaces as seen in the Spitzer im-
dimensional spheres, but instead more or less two-dimensional ages; this will be discussed in more detail in Sect. 5. The two
thick rings. They claim that this could be the result of star forma- northernmost larger clouds in this region constitute the eastern
tion and stellar feedback within a flattened, sheet-like molecular part of the V-shaped dark feature seen in the optical images.
cloud. The spatial configuration of the clouds around Tr 14 seem A particularly interesting part of the South Pillars is the
to fit to this model. Treasure Chest, a dense cluster of some 200 stars embedded in
A92, page 7 of 14
8. A&A 525, A92 (2011)
a compact nebula at the head of a large dust pillar (Smith et al. RA = 10h 43m 18.2s, Dec = −60◦ 15 59 , and RA = 10h 43m 24.9s,
2005). The brightest object in this cluster is the O9.5 V star CPD Dec = −60◦ 15 40 . The western [eastern] peak shows a flux
−59◦ 2661, that ionizes a small HII region inside a ∼40 diame- maximum of 0.25 [0.19] Jy/beam, which translates into a col-
ter cavity near the western edge of the dust pillar, in which the umn density of NH2 ≈ 2 [1.5] × 1022 cm−2 , corresponding to a
cluster is located. The edges of this cavity can be well seen in the visual extinction of AV ≈ 22 [17] mag.
narrowband images presented in Smith et al. (2005, their Fig. 3). The optical DSS image shows that this cloud corresponds
The cluster seems to be extremely young (<0.1 Myr) and the
∼ to a very prominent dark globule in the southern part of the
young stars show strong reddening with extinction values up to CNC. This cloud seems to be a good example of an infrared dark
AV ∼ 50 mag. cloud, i.e. particularly dense and cold clouds, which are thought
Our LABOCA data reveal the detailed morphology of the to be the birth places of massive stars (e.g., Carey et al. 1998;
associated dust cloud (see Fig. 5) out of which this cluster re- Rathborne et al. 2006; Rygl et al. 2010). The integrated 870 μm
cently formed. The large scale structure of the 870 μm emission flux of this cloud is 3.5 Jy, which corresponds to a cloud mass
shows a cometary shape, with peak intensity just to the north and of ∼320 M for T = 10 K.
some 15 to the east of the infrared cluster. At the position of the Finally, in Fig. 8 we consider the small scale structure of the
cavity surrounding the embedded cluster, the sub-mm emission massive cloud complex to the west of Tr 14. The eastern edge,
shows a “hole” and is ∼3× weaker than on the eastern side. This where the cloud is strongly irradiated by the massive stars in
suggests that the cavity takes up a large fraction of the full depth Tr 14 and where a bright PDR can bee seen in the optical images,
of the dust cloud, and is not just a minor disturbance at the sur- the rim of the cloud is very sharp. The interior of the cloud com-
face of the cloud. plex seems to consist of at least five bright clumps. To the north
Our column density estimate for the brightest part of the and the southeast of this dense cloud complex, weaker diffuse
cloud, NH2 ∼ 4 × 1022 cm−2 , corresponds to visual extinction emission is visible. This may be material that was evaporated at
values of AV ∼ 50 mag and agrees very well with the maxi- the eastern edge of the cloud in the PDR and is now streaming
mum extinction found by Smith et al. (2005) for the stars in this away in the directions perpendicular to the impacting radiation
region. Proceeding to the south, the structure of the cloud shows field from Tr 14.
a bifurcation; the western arm is denser and thicker than the east-
ern arm.
To derive an estimate for the total mass of the dust cloud, we 6. Sub-mm emission from CO molecular cloud
integrated the 870 μm emission above the 3σ noise level over
a ≈2 × 3.5 box including the brightest part of the emission, clumps
finding a flux of 30.2 Jy. Assuming a cloud temperature of 20 K, Yonekura et al. (2005) detected 15 individual cloud clumps5 in
this suggests a cloud mass of ∼880 M . their C18 O map6 ; eight of these (number 8−15) are located in
the field-of-view of our LABOCA map and are marked by the
red circles in Fig. 1. Sub-mm emission is clearly detected at the
5. Cloud morphology from the combination
locations of all eight clumps. In five cases (clumps 9, 11, 13, 14,
of the Spitzer and the LABOCA images and 15) our LABOCA map shows strong and compact sub-mm
The combination of our LABOCA data with the existing Spitzer emission, as expected for high-density clumps. At the location
images provides a very good way to study the morphology of the of clumps 8, 10, and 12, however, we see only diffuse sub-mm
clouds. The 8 μm emission in the IRAC4 band is dominated by emission.
polyaromatic hydrocarbon emission, which is excited by the UV In order to determine the sub-mm fluxes of the clumps, we
irradiation, and thus reveals the detailed structure of the cloud used the positions and sizes (the beam-deconvolved radii) of the
surfaces. The 870 μm emission, on the other hand, traces the cold clumps reported in Table 3 of Yonekura and integrated all pixels
dust inside the dense central cloud regions. The full extent of the values above the 3σ noise level. For the clumps with clear peaks
Carina Nebula has been mapped with IRAC, and we retrieved in the sub-mm map we centered the integration regions on these
these data4 from the Spitzer data archive for analysis. Below, we peaks. The resulting fluxes are given in Table 2. We also list
discuss interesting features resulting from this investigation. the corresponding masses computed from these fluxes, assuming
In Fig. 6 we compare the LABOCA data to the Spitzer two different temperature values, T = 20 K and T = 10 K.
8.0 μm image of the South Pillars region. In many parts of this Comparison to the masses determined by Yonekura from
region we find a remarkable resemblance between the morphol- their C18 O map shows that the sub-mm mass estimates for T =
ogy in the Spitzer and the LABOCA images. Essentially all 20 K are always substantially lower than the C18 O masses. With
clouds that emit brightly in the Spitzer image do also clearly T = 10 K we find a much better agreement; the mass estimates
show 870 μm emission. from the sub-mm data and the C18 O data generally agree within
On the other hand, not all of the dense dusty clouds re- a factor of ∼2. Although this seems to be a relatively good match,
vealed by LABOCA are visible in the Spitzer images. An es- we note that the assumed very cold T = 10 K temperatures ap-
pecially notable example is the cloud marked with “IRDC” pear to be in conflict with the CO excitation temperatures, which
in Fig. 6, near the western edge of the South Pillars. A are ≥20 K for all but one of these clumps. This apparent in-
more detailed view and comparison to images in other wave- consistency may perhaps indicate that the derived CO excitation
lengths are provided in Fig. 7. In the LABOCA map, this temperatures do not well represent the characteristic temperature
cloud shows a double-peaked structure. In the Spitzer 8 μm at which most of the cold dust mass resides.
IRAC map as well as the 24 μm MIPS map, these two 870 μm
5
peaks correspond to very dark shadows, which are located at We note that Yonekura et al. (2005) denoted these structures as
“cores”; however, with a size scale of ∼2 pc, these clouds are not cores
4
These IRAC data were obtained in July 2008 in the program (which have typical sizes of <0.2 pc) but rather clumps.
∼
6
“Galactic Structure and Star Formation in Vela-Carina” (PI: Steven With a half-power beam width of 2.7 the spatial resolution of the
Majewski, Prog-ID: 40791). C18 O map is about nine times lower than that of our LABOCA map.
A92, page 8 of 14
9. T. Preibisch et al.: Deep wide-field sub-mm survey of the Carina Nebula
Tr 15
10’
Tr 14
-59:30:00
η Car
-60:00:00
IRDC
10:50:00 10:48:00 10:46:00 10:44:00 10:42:00
Fig. 6. False-color representation of the 8.0 μm Spitzer image with superposed contours of the LABOCA map. In the area within a few arcminutes
from η Car the very bright infrared emission caused strong artifacts in the Spitzer image. A grid of J2000 coordinates is shown.
7. Global properties of the Carina Nebula complex IRAS images) on scales of tens of arcminutes, and therefore we
expect that the missing flux is not insignificant. On the other
Our wide-field LABOCA map yields for the first time a direct hand, it appears likely that some part of this large scale emission
measurement of the total sub-mm emission from the CNC. It arises from distant clouds in the background; owing to its posi-
represents a missing piece of the puzzle for the investigations of tion very close to the Galactic plane (l ≈ −0.6◦ ) and near the
the global properties of the complex, in particular for the total tangent point of the Sagittarius-Carina spiral arm, the Galactic
luminosity and its spectral energy distribution, and for the total background emission at the location of the Carina Nebula must
mass and its distribution in the different phases, i.e. dust, molec- be fairly high.
ular, and atomic gas. As determined in Sect. 3, the total flux in our map originating
from dusty clouds (and not from free-free emission) is 1077 Jy.
7.1. The total dust and gas mass To illustrate how sensitively the corresponding mass estimate
depends on the assumed dust temperature, we consider three
We can use our sub-mm map to derive an estimate of the to- different temperature values, and find that the measured flux cor-
tal mass of dust and gas in the Carina Nebula. We note again responds to (dust + gas) masses of 99 000 M , 31 400 M , or
that our LABOCA map is not sensitive to possibly existing 18 100 M for 10, 20, or 30 K, respectively. As our best estimate
widespread and spatially homogeneous sub-mm emission on we assume here a total mass of the cold dusty clouds traced by
large angular scales, >2.5 ; our measured sub-mm fluxes are LABOCA of ∼60 000 M .
therefore only lower limits to the true flux. In principle, if most The total mass of molecular gas in the CNC has been de-
of the cloud mass is concentrated into dense compact struc- rived from the CO observations by Yonekura et al. (2005). Since
tures, the fraction of unrecovered large-scale flux may be very their full map size is considerably larger than the field-of-view
small (see, e.g., Maruta et al. 2010). However, the CNC clearly of our LABOCA map, we added their CO masses for their sub-
shows wide-spread far-infrared emission (as visible, e.g., in the regions 1, 2, 3, and 7, which cover approximately the field of our
A92, page 9 of 14
10. A&A 525, A92 (2011)
Fig. 7. False-color images of the region around
the infrared dark cloud, seen in the Spitzer 8 μm
IRAC map (upper left), the 24 μm MIPS map
(upper right), the LABOCA map (lower left),
and the optical DSS image (lower right). In
each image, the field-of-view is ≈8.2 × 6.6 ,
north is up, east to the left. The contour levels
superposed onto the LABOCA map are 0.06,
0.09, 0.12, and 0.15 Jy/beam. The two peaks
are marked by green circles.
Table 2. LABOCA fluxes and mass estimates of the C18 O clumps de-
-59:30:00
tected by Yonekura et al. (2005).
2’
Clump T ex M(C18 O) F(870 μm) M870 (20 K) M870 (10 K)
Tr 14
# [K] [M ] [Jy] [M ] [M ]
8 24 3700 28.4 ± 4.3 829 2612
9 21 1400 20.3 ± 3.0 593 1868
520 11.9 ± 1.8
-59:33:00
10 25 347 1093
11 22 1400 10.7 ± 1.6 312 983
12 20 2600 37.5 ± 5.6 1095 3450
13 20 4200 41.5 ± 6.2 1212 3819
14 9 450 2.9 ± 0.4 85 267
15 19 2000 15.5 ± 2.3 453 1427
-59:36:00
LABOCA map traces about 40% of the total molecular cloud
emission, a fraction that appears very reasonable considering the
arguments about the unrecovered large-scale sub-mm flux given
-59:39:00
above.
10:44:00 10:43:36 10:43:12
7.2. The spectral energy distribution of the complex
Fig. 8. False-color representation of the 8.0 μm Spitzer image of the
cloud west of Tr 14 with superposed contours of the LABOCA map. A good way to study the global energetics and properties of the
CNC is to analyze the global spectral energy distribution (SED)
of the complex. Smith & Brooks (2007) constructed the SED
in the wavelength range from 8 μm to 100 μm from MSX and
LABOCA map. This yields a total mass of 141 000 M based on IRAS data (excluding the flux of the star η Car) and modeled
their 12 CO map, 63 000 M from their 13 CO map, and 22 000 M these data (their Fig. 2) with a combination of three different op-
from their C18 O map. These numbers suggest that a large frac- tically thin graybody components with discrete temperatures of
tion of the cloud mass resides in clouds of moderate density (as 220 K, 80 K, and 35 K. They used this model to estimate the
traced by 12 CO), whereas the denser gas (as traced by 13 CO) total dust masses associated to these components and suggested
and the very dense clouds traced by C18 O contain progressively that the CNC contains about 106 M of gas; they claimed that
smaller fractions of the total mass. Interestingly, our mass esti- there is about three times more gas in atomic form than molec-
mate for the cloud emission seen by LABOCA of ∼60 000 M ular gas. However, they also noted that their fit is not unique;
agrees fairly well to the mass in dense, well localized clouds as equally good fits can be obtained with different sets of tempera-
traced by 13 CO. Comparison to the 12 CO mass suggests that our ture components, and thus these mass estimates are uncertain.
A92, page 10 of 14
11. T. Preibisch et al.: Deep wide-field sub-mm survey of the Carina Nebula
Our LABOCA data provide a very important new SED point
at longer wavelengths, which strongly constrains possible mod-
els of the SED and allows us to obtain new insights into the mass
budget of the complex. As mentioned above, the total integrated
flux (above the 3σ noise limit) in our LABOCA map is 1147 Jy.
Subtracting the flux from η Car (43 Jy), to be consistent with
the analysis of SB07, the total flux from the complex is 1100 Jy.
This value is nearly 20 times smaller than the 870 μm flux pre-
dicted by the the model of SB07 (see their Fig. 2). Even if we
take into account that the field of our LABOCA map is consid-
erably smaller than the 5.6 square-degree area for which the
SED points in SB07 were determined7, a large discrepancy of a
factor of ∼14 remains.
Several possible effects could contribute to this discrepancy.
First, the choice of the discrete temperatures for the graybody
components can strongly affect the predicted sub-mm flux; a
slightly higher assumed temperature would reduce the predicted
sub-mm flux substantially. A second aspect is the wavelength-
dependence of the dust emissivity: SB07 assumed an emissiv-
ity ∝λ−1 , i.e. a dust emissivity index β = 1, which is at the low
side of the range of values found by Rathborne et al. (2010) for Fig. 9. Spectral energy distribution of the Carina Nebula complex. The
dark clouds (β = 1−2). Values of β > 1 would also reduce the diamonds and crosses show the mid- and far-infrared fluxes determined
predicted sub-mm flux substantially. Thirdly, a three temperature from the IRAS and MSX maps for the field of the LABOCA map.
The cross with the upward triangle shows the total 870 μm flux derived
model is obviously a simplification, because the true temperature from our LABOCA map (excluding the emission from η Car and the
distribution must be continuous. Considering the comparatively Keyhole Nebula). The asterisks show the integrated optical and near-
small wavelength range covered by the data that were available infrared fluxes of the known stellar members of Carina as identified in
for their analysis, the use of a three temperature model by SB07 a deep Chandra X-ray survey (see Preibisch et al. 2011b). The solid
was quite appropriate, but the availability of our new sub-mm line shows the spectral energy distribution resulting from our spherical
data justify a new modeling attempt. cloud model of the CNC with a total gas + dust mass of 140 000 M ;
the gray line shows the effect of adding 1 mag of visual foreground ex-
tinction to the spectrum. The dashed line is the model with a cloud mass
7.3. A simple radiative transfer model of the Carina Nebula of 280 000 M .
complex
In order to investigate the SED in more detail, we performed
a simple radiative transfer modeling of the CNC. First, we ex- surrounded by a spherical envelope of dust and gas. Although
tracted the fluxes for the SED for the area of our LABOCA map this is obviously a strong simplification, it provides the advan-
from the IRAS8 and MSX images9 ; the resulting SED is shown tage that the temperature distribution of the gas is computed in a
in Fig. 9. more physically meaningful way than adding up a few discrete
Our radiative transfer modeling of the observed SED is not graybody components.
intended to be detailed and highly accurate, but just to see The radiation transfer calculations were carried out with a
whether we can reproduce the general shape of the observed modified version of the code of Yorke (1980a,b). This program
SED with reasonable assumptions about the mass and large- yields an exact solution of the frequency-dependent radiation
scale density distribution of the surrounding clouds. We do transfer problem in spherical geometry simultaneously with a
not intend to model the small-scale structure of the individual self-consistent determination of the dust temperatures. One has
clouds; instead, we simply assume a central source of radiation to specify the luminosity and the effective temperature of the
central source, as well as the density distribution of the surround-
7
We analyzed the 100 μm IRAS map (since the luminosity and mass ing cloud and can compute the overall spectrum and the flux dis-
estimates from SB07 are strongly dominated by their assumed 35 K tribution at each wavelength. We use a grid 64 different wave-
model component, the amplitude of which is proportional to the 100 μm length points10 ranging from 0.1 μm to 5 mm. The dust model
flux) and found that our LABOCA field encloses 70% of the total from Preibisch et al. (1993) was employed, which had been
100 μm flux in the larger field. constructed to match the dust properties in molecular clouds.
8
The total flux in the area of our LABOCA map was found to be It consists of small (7−0 nm) amorphous carbon grains and
40 784 Jy, 137 539 Jy, 627 038 Jy, and 832 420 Jy for the wavelengths large (40 nm−1 μm) silicate grains, and assumes that the silicate
of 12 μm, 25 μm, 60 μm, and 100 μm, respectively.
9 grains are coated with a thin mantle (thickness = 14.5% of the
In order to convert the MSX fluxes, which are given in units
grain radius) of “dirty ice” if their temperature is below 125 K.
of radiance, to intensity units at the isophotal wavelength, we
used the conversion factors listed in the General Description The inner and outer edges of the spatial grid are at r = 1016 cm
of MSX Images from the NASA/IPAC Infrared Science Archive (0.003 pc) and 28 pc.
(see http://irsa.ipac.caltech.edu/applications/MSX/MSX/ Following the census of massive stars in the CNC by Smith
imageDescriptions.htm). For band A, we used an additional correc- (2006), we assumed a total stellar luminosity of 2.4 × 10⁷ L
tion factor of 2, as recommended for blackbodies and modified black- and a typical temperature of T eff = 44 700 K. In the first series
bodies at temperatures of about 120–140 K. The corresponding correc- of models, we set the total (gas + dust) mass of the cloud to
tion factors for the other bands are very close to unity. The resulting
fluxes are 10 211 Jy, 57 784 Jy, 55 200 Jy, and 148 479 Jy for the 8 μm, 10
The wavelength grid has a approximately equidistant steps in log λ
12 μm, 14 μm, and 21 μm band, respectively. and includes most optical to far-infrared standard bands.
A92, page 11 of 14
12. A&A 525, A92 (2011)
140 000 M , following the CO mass estimate of Yonekura et al. (Smith et al. 2010a,b). With our new results on the mass budget
(2005). The free parameters in our modeling were the character- of the clouds, we can address the question of how many addi-
istics of the radial density distribution of the cloud. The model tional stars may form in the near future in the CNC.
shown in Fig. 9 assumes that the density slowly increases with
distance from the center according to ρ(r) ∝ r0.75 ; this should
approximately match the conditions in the CNC, where most of 7.4.1. Cloud mass above the star-formation threshold
the cloud material has already been dispersed from the central From studies of other molecular cloud complexes it is well
region and is now located at typical distances between ∼5 pc known that typically only a small fraction of the total cloud mass
and ∼25 pc. will form stars, whereas the majority of the mass will finally be
The computed dust temperatures in this model range from dispersed. Only the densest (and coldest) parts of the gas in a typ-
144 K (carbon grains) and 69 K (silicate grains) at 5 pc, over ical molecular cloud will be transformed into stars. An estimate
103 K and 51 K at 10 pc, to 34 K and 23 K at 28 pc distance of the fraction of the cloud mass available for star formation
from the central luminosity source. The spectrum of this sim- can be made if the spatial distribution of (column) density in the
ple model matches the observed mid-infrared to sub-mm fluxes cloud is known. Froebrich & Rowles (2010) showed that the ex-
not perfectly, but reasonably well. The predicted 100 μm flux tinction (or column density) threshold for star formation in sev-
is 739 299 Jy, i.e. 11% lower than the value extracted from the eral nearby molecular clouds is typically at AV ∼ 5 mag, corre-
IRAS image. The predicted 870 μm flux is 1816 Jy, i.e. ≈70% sponding to a column density threshold of NH2 = 4.7×1021 cm−2 .
higher than the observed LABOCA flux of 1077 Jy. This differ- Assuming a typical cloud temperature of T = 20 K, we find
ence agrees well with the expected level of missing large-scale from our LABOCA map that the total mass of the clouds above
flux in the LABOCA map estimated above from the CO masses. this column density threshold is about 20 000 M . Note that this
Assuming the missing flux of 729 Jy to be evenly distributed value agrees quite well with the total mass of all C18 O clumps
over the area of our LABOCA map would require an unrecov- as determined by Yonekura et al. (2005). Assuming a total gas
ered homogenous flux level of only ≈0.014 Jy/beam. mass of 140 000−280 000 M (as derived above), this implies
The most important characteristics of this model is that it re- that only a small fraction, 7−14%, of the total gas mass is in a
produces both far-infrared and sub-mm fluxes reasonably well. state in which it is available for star formation.
There is therefore no need to postulate a large mass component
of widely distributed purely atomic gas that would be neither
detectable in the CO maps nor in the sub-mm map. All avail- 7.4.2. The possibility of future massive star-formation
able data, i.e. the far-infrared fluxes, the sub-mm flux, and the in the CNC
results derived from the CO maps, can be explained by a total
gas and dust mass of about 140 000 M . We note that this num- An interesting aspect to investigate is whether the current (and
ber also agrees well with the recent results from hydrodynamical future) star-formation process is similar or different from the
modeling of the Carina super-bubble by Harper-Clark & Murray previous star-formation activity, which created the massive star
(2009), who derived a total (dust + gas) mass of the nebula of clusters Tr 14, 15, and 16. A particularly important point in this
∼105 M . Finally, it is interesting to note that adding 1.0 mag respect is the maximum mass of the forming stars. The clusters
of visual foreground extinction yields quite good agreement be- Tr 14 and 16 contain numerous very massive (M > 50 M ) stars.
tween the model spectrum and the observed integrated optical In the more recently formed embedded population in the South
and near-infrared fluxes of the stellar member of the CNC. Pillars, however, the most massive star identified so far is the
In a second series of models we investigated the effect of O9.5 V star in the Treasure Chest, which has a comparatively
increasing the total gas mass above the 140 000 M of gas as small mass of ∼20 M . This suggests that stars in the newest
traced by CO emission. In particular, we wanted to find out generation have substantially lower maximum masses than in the
whether adding significant amounts of (atomic) gas would raise older generation. Will this also be true for the stellar populations
the 100 μm flux to the observed level. We found this not to be yet to form in the remaining clouds?
the case. Increasing the total gas mass actually leads to lower Observations of stellar clusters suggest that there is a relation
100 μm model fluxes, because the optical thickness of the gas between the mass M∗,max of the most massive star in a cluster
envelope increases, which leads to cooler dust temperatures in and the total mass Mcluster of all cluster stars (see Weidner et al.
the outer parts of the nebula. This effect can be partly compen- 2010). Although it is still debated whether the observed corre-
sated for by assuming a steeper outward density increase. In the lation is actually caused by physical processes or instead is an
second model shown in Fig. 9 we assumed a total gas mass of effect of pure random sampling from the IMF in individual star
280 000 M , i.e. twice the mass as traced by CO. With a density clusters (see Elmegreen 2006), we assume here that the simple
law ρ(r) ∝ r we can find an acceptable SED fit. The predicted empirical relation
100 μm flux of this model is 722 721 Jy, 13% lower than ob-
served. The 870 μm flux is 2076 Jy, only 14% higher than in the M∗,max ≈ 1.2 × Mcluster
0.45
(3)
lower mass model; this small increase in sub-mm flux despite
the higher mass is caused by the cooler dust temperatures in the suggested by Larson (2003) provides a reasonable approxima-
outer parts of this model (25 K and 22 K for the carbon and tion. Assuming a star-formation efficiency (i.e. the ratio of the to-
silicate grains at the outer edge of the model grid). tal stellar cluster mass versus the original cloud mass) of S FE <
0.3, as established for cluster formation by Lada & Lada (2003),
7.4. Star formation in the observed clouds yields the desired relation between the cloud mass and the max-
imum mass of the stars that can be expected to form out of this
The dense clouds seen by LABOCA are the site of the cur- cloud. It suggests that a cloud with a mass of Mcloud ≈ 1000 M
rent and future star-formation activity in the CNC. Recent ob- will yield a maximum stellar mass of ∼15 M , whereas cloud
servations have revealed hundreds to thousands of very young masses of ≥12 000 M are required to form a very massive star
(<1 Myr old) stellar objects in these clouds throughout the CNC
∼ (M ≥ 50 M ).
A92, page 12 of 14
13. T. Preibisch et al.: Deep wide-field sub-mm survey of the Carina Nebula
Nearly all cloud clumps we detected in the CNC have masses <
high star formation efficiency of 30%, but probably ∼2000 M
≤5000 M , and therefore will according to Eq. (3), yield a maxi- for lower star-formation efficiencies. Compared to the total mass
mum stellar mass of <30 M . Most clouds, including the infrared
∼ of the already existing stars, this will be a comparatively small
dark cloud discussed above, have masses ≤1000 M , and there- addition.
fore will yield a maximum stellar mass of just <15 M . Only
∼ The importance of the ongoing and future star-formation
the cloud complex to the west of Tr 14 is substantially more process in the complex may be increased by the effect of stel-
massive. However, as can be seen in Fig. 8, this cloud with esti- lar feedback: if the irradiation and the winds from the massive
mated ∼15 000 M is already fragmented into several individual stars efficiently compress the clouds, and continuously transform
clumps; most likely, each of these individual clumps will form part of the low-density clouds into denser clouds, the cloud mass
star clusters, and none of them is massive enough to form a very available for star formation could well increase. However, it is
massive star (M ≥ 50 M ), if the assumed relation in Eq. (3) unlikely that this effect can significantly change the ratio be-
holds. tween the stellar populations, simply because time is running
To summarize, the observed cloud masses suggest that the out: within less than ∼1 Myr, η Car will explode as a supernovae.
currently ongoing, presumably triggered (see Smith et al. 2010b) This event will be followed by series of ∼70 further supernova
star-formation process will probably not lead to the formation of explosions from the massive stars in the complex (see Smith &
very massive stars, as present in large numbers in the older, trig- Brooks 2008). Each of these explosions will send strong shock-
gering population. This suggests a clear quantitative difference waves through the clouds. While supernova shockwaves are very
in the formation processes of the currently forming and the ear- destructive for any interstellar material in their immediate sur-
lier generation of stars in the CNC. roundings, they decay into much slower and weaker shocks af-
ter traveling distances of >1 pc. Today, most of the molecular
∼
clouds in the CNC are already located at the periphery of the
8. Conclusion complex, typically a few pc away from the massive stars; these
Our wide-field LABOCA map provides the first large-scale sur- clouds will then be compressed, but probably not destroyed by
vey of the sub-mm emission in the CNC. We find that the cold the crossing “evolved” shockwaves. At locations where suitable
dust in the complex is distributed in a wide variety of structures, conditions are met (see, e.g., Vanhala & Cameron 1998; Oey &
from the very massive (∼15 000 M ) and dense cloud complex Garcia-Segura 2004), vigorous star formation activity can then
near Tr 14, over several clumps of a few hundred solar masses, be expected (see, e.g., Preibisch & Zinnecker 2007, for the ex-
to numerous small clumps containing only a few solar masses ample of the Scorpius-Centaurus Association). These supernova
of gas and dust. Many of the clouds show clear indications that shockwaves can not only trigger star formation but also inject
their structure is shaped by the very strong ionizing radiation short-lived radionucleids such as 60 Fe into the collapsing pro-
field and possibly stellar winds. tostellar clouds (Boss & Keiser 2010). Because there is strong
The total mass of the dense clouds to which LABOCA is evidence that such short-lived radionucleids were incorporated
sensitive is ∼60 000 M . This value agrees fairly well with the into the solar nebula material during the formation of our so-
mass estimates for the well localized molecular gas traced by lar system, the clouds in the CNC may provide a good template
13
CO. The complex may contain a considerable amount of very in which to study the initial conditions for the formation of our
widely distributed atomic gas, which is neither recovered in solar system.
our LABOCA map, nor can be seen in the CO data. Our ra-
diative transfer modeling suggests that the total mass of such Acknowledgements. We would like to thank the referee for insightful comments
an distributed atomic gas component does probably not exceed that helped to improve the paper. We gratefully acknowledge funding of this
the total molecular gas mass (140 000 M ) in the region. Thus, work by the German Deutsche Forschungsgemeinschaft, DFG project number
PR 569/9-1. Additional support came from funds from the Munich Cluster of
the total gas mass in the field of our LABOCA map seems to Excellence: “Origin and Structure of the Universe”. This publication makes use
be <300 000 M .
∼ of data products from the Two Micron All Sky Survey, which is a joint project
Only a small fraction (∼10%) of the gas in the CNC is cur- of the University of Massachusetts and the Infrared Processing and Analysis
rently in dense and massive enough clouds to be available for Center/California Institute of Technology, funded by the National Aeronautics
and Space Administration and the National Science Foundation. This work
further star formation. Most observed clouds have masses of less makes use of observations made with the Spitzer Space Telescope, which is op-
than a few 1000 M ; they will most likely not form any very mas- erated by the Jet Propulsion Laboratory, California Institute of Technology under
sive stars, as present in large numbers in the older stellar genera- a contract with NASA. The reduction of the HST image used in our analysis was
tion in the CNC. This suggests a clear quantitative difference be- supported by STScI Archival Research proposal 11765 (PI Mutchler) and the
tween the currently ongoing process of triggered star-formation Hubble Heritage project.
and the process that formed the massive cluster Tr 14, 15, and 16
a few Myr ago. References
It is interesting to compare these results about future star for-
mation in the clouds to the already existing stellar populations. Beaumont, C. N., & Williams, J. P. 2010, ApJ, 709, 791
The results of a recent wide-field Chandra X-ray survey of the Boss, A. P., & Keiser, S. A. 2010, ApJ, 717, L1
CNC (Townsley et al. 2011) suggest that the total stellar pop- Briceno, C., Preibisch, Th., Sherry, W., et al. 2007, in Protostars & Planets V, ed.
ulation of the CNC consists of about 43 000 stars with a com- B. Reipurth, D. Jewitt, & K. Keil (Tucson: University of Arizona Press), 345
bined mass of ∼27 000 M (Preibisch et al. 2011b). This value Brooks, K. J., Whiteoak, J. B., & Storey, J. W. V. 1998, PASA, 15, 202
Brooks, K. J., Cox, P., Schneider, N., et al. 2003, A&A, 412, 751
implies that so far ∼10% of the total cloud mass in the complex Brooks, K. J., Garay, G., Nielbock, M., Smith, N., & Cox, P. 2005, ApJ, 634,
have been transformed into stars. This fraction is similar to the 436
typical values of the global star-formation efficiency determined Carey, S. J., Clark, F. O., Egan, M. P., et al. 1998, ApJ, 508, 721
for other OB associations (Briceno et al. 2007). Cox, P., & Bronfman, L. 1995, A&A, 299, 583
Dale, J. E., & Bonnell, I. A. 2008, MNRAS, 391, 2
With about ∼20 000 M of dense clouds available for star Dale, J. E., Bonnell, I. A., Clarke, C. J., & Bate, M. R. 2005, MNRAS, 358, 291
formation at this moment, the maximum mass of new stars to Deharveng, L., Zavagno, A., Schuller, F., et al. 2009, A&A, 496, 177
form within the next ∼1 Myr may be <7000 M if we assume a
∼ Elmegreen, B. G. 2006, ApJ, 648, 572
A92, page 13 of 14
14. A&A 525, A92 (2011)
Freyer, T., Hensler, G., & Yorke, H. W. 2003, ApJ, 594, 888 Preibisch, Th., Hodgkin, S., Irwin, M., et al. 2011b, ApJS, submitted
Froebrich, D., & Rowles, J. 2010, MNRAS, 406, 1350 Rathborne, J. M., Jackson, J. M., & Simon, R. 2006, ApJ, 641, 389
Gomez, H. L., Vlahakis, C., Stretch, C. M., et al. 2010, MNRAS, 401, L48 Rathborne, J. M., Jackson, J. M., Chambers, E. T., et al. 2010, ApJ, 715, 310
Gritschneder, M., Naab, Th., Walch, S., Burkert, A., & Heitsch, F. 2009, ApJ, Rygl, K. L. J., Wyrowski, F., Schuller, F., & Menten, K. M. 2010, A&A, 515,
694, L26 A42
Groh, J. H., Madura, T. I., Owocki, S. P., Hillier, D. J., & Weigelt, G. 2010, ApJ, Sana, H., Momany, Y., Gieles, M., et al. 2010, A&A, 515, A26
716, L223 Schneider, N., & Brooks, K. 2004, PASA, 21, 290
Güsten, R., Nyman, L. Å., Schilke, P., et al. 2006, A&A, 454, L13 Schuller, F., Menten, K. M., Contreras, Y., et al. 2009, A&A, 504, 415
Harper-Clark, E., & Murray, N. 2009, ApJ, 693, 1696 Siringo, G., et al. 2009, A&A, 497, 945
Henning, T., Michel, B., & Stognienko, R. 1995, Planet. Space Sci., 43, 1333 Smith, N. 2006, MNRAS, 367, 763
Hildebrand, R. H. 1983, QJRAS, 24, 267 Smith, N., & Brooks, K. J. 2007, MNRAS, 379, 1279
Kramer, C., Cubick, M., Röllig, M., et al. 2008, A&A, 477, 547 Smith, N., & Brooks, K. J. 2008, Handbook of Star Forming Regions, Vol. II:
Lada, C. J., & Lada, E. A. 2003, ARA&A, 41, 57 The Southern Sky, ed. B. Reipurth, ASP Monograph Publ., 5, 138
Larson, R. B. 2003, in Galactic Star Formation Across the Stellar Mass Smith, N., Stassun, K. G., & Bally, J. 2005, AJ, 129, 888
Spectrum, ASP Conf. Ser., 287, 65 Smith, N., Bally, J., & Walborn, N. R. 2010a, MNRAS, 405, 1153
Maruta, H., Nakamura, F., Nishi, R., Ikeda, N., & Kitamura, Y. 2010, ApJ, 714, Smith, N., Povich, N. S., Whitney, B. A., et al. 2010b, MNRAS, 406, 952
680 Stamatellos, D., Whitworth, A. P., & Ward-Thompson, D. 2007, MNRAS, 379,
Megeath, S. T., Cox, P., Bronfman, L., & Roelfsema, P. R. 1996, A&A, 305, 296 1390
Mehner, A., Davidson, K., Humphreys, R. M., et al. 2010, ApJ, 717, L22 Tapia, M., Roth, M., Vazques, R. A., & Feinstein, A. 2003, MNRAS, 339, 444
Mutchler, M., & Bowers, A. 2009, http://archive.stsci.edu/prepds/ Townsley, L., Broos, P. S., Corcoran, M. F., et al. 2011, ApJS, submitted
carina/ Trumpler, R. J. 1930, Lick Observatory Bulletin, 14, 154
Oey, M. S., & Garcia-Segura, G. 2004, ApJ, 613, 302 Vanhala, H. A. T., & Cameron, A. G. W. 1998, ApJ, 508, 291
Ossenkopf, V., & Henning, T. 1994, A&A, 291, 943 Weidner, C., Kroupa, P., & Bonnell, I. A. D. 2010, MNRAS, 401, 275
Preibisch, Th., & Zinnecker, H. 2007, IAU Symp., 237, 270 Yonekura, Y., Asayama, S., Kimura, K., et al. 2005, ApJ 634, 476
Preibisch, Th., Ossenkopf, V., Yorke, H. W., & Henning, T. 1993, A&A, 279, Yorke, H. W. 1980a, A&A, 85, 215
577 Yorke, H. W. 1980b, A&A, 86, 286
A92, page 14 of 14