1. TREB Member Inquiries:
(416) 443-8152
Media/Public Inquiries:
Fourth Quarter 2011 (416) 443-8158
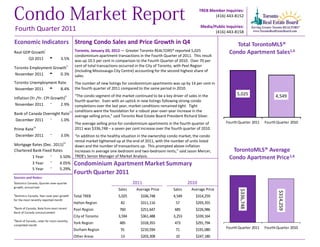
Economic Indicators Strong Condo Sales and Price Growth in Q4 Total TorontoMLS®
Real GDP Growth i Toronto, January 20, 2012 — Greater Toronto REALTORS® reported 5,025 Condo Apartment Sales1,6
condominium apartment transactions in the Fourth Quarter of 2011. This result
Q3 2011 t 3.5% was up 10.5 per cent in comparison to the Fourth Quarter of 2010. Over 70 per
Toronto Employment Growthi i cent of total transactions occurred in the City of Toronto, with Peel Region
(including Mississauga City Centre) accounting for the second highest share of
November 2011 t 0.3% sales.
Toronto Unemployment Rate The number of new listings for condominium apartments was up by 14 per cent in
November 2011 t 8.4% the fourth quarter of 2011 compared to the same period in 2010.
ii “The condo segment of the market continued to be a key driver of sales in the 5,025 4,549
Inflation (Yr./Yr. CPI Growth)
fourth quarter. Even with an uptick in new listings following strong condo
November 2011 q 2.9% completions over the last year, market conditions remained tight. Tight
iii conditions were the foundation for a robust year-over-year increase in the
Bank of Canada Overnight Rate
average selling price,” said Toronto Real Estate Board President Richard Silver.
December 2011 q 1.0%
The average selling price for condominium apartments in the fourth quarter of Fourth Quarter 2011 Fourth Quarter 2010
iv
Prime Rate 2011 was $336,748 – a seven per cent increase over the fourth quarter of 2010.
December 2011 q 3.0%
“In addition to the healthy situation in the ownership condo market, the condo
iv
rental market tightened up at the end of 2011, with the number of units listed
Mortgage Rates (Dec. 2011) down and the number of transactions up. This prompted above-inflation
Chartered Bank Fixed Rates increases in average one-bedroom and two-bedroom rents,” said Jason Mercer, TorontoMLS® Average
1 Year q 3.50% TREB’s Senior Manager of Market Analysis. Condo Apartment Price1,6
3 Year q 4.05% Condominium Apartment Market Summary
5 Year q 5.29%
Fourth Quarter 2011
Sources and Notes:
i
Statistics Canada, Quarter-over-quarter 2011 2010
growth, annualized
Sales Average Price Sales Average Price
$336,748
$314,259
ii
Statistics Canada, Year-over-year growth Total TREB 5,025 $336,748 4,549 $314,259
for the most recently reported month
Halton Region 82 $311,116 57 $293,355
iii
Bank of Canada, Rate from most recent Peel Region 760 $251,647 685 $226,986
Bank of Canada announcement
City of Toronto 3,594 $361,488 3,253 $339,164
iv
Bank of Canada, rates for most recently
completed month
York Region 485 $318,355 473 $291,794
Durham Region 91 $210,594 71 $191,080 Fourth Quarter 2011 Fourth Quarter 2010
Other Areas 13 $203,308 10 $247,180
3. Toronto Real Estate Board
SUMMARY OF CONDOMINIUM APARTMENT TRANSACTIONS Industrial Leasing
CITY OF TORONTO
FOURTH QUARTER 2011
Sales1 Dollar Volume1 Average Price1 Median Price1 New Listings2 Active Listings3 Avg. SP/LP 4 Avg. DOM5
TREB Total 5,025 $1,692,160,838 $336,748 $305,000 7,693 4,349 98% 32
City of Toronto Total 3,594 $1,299,188,484 $361,488 $328,000 5,573 3,157 98% 31
Toronto West 693 $188,905,147 $272,590 $268,000 1,143 781 98% 36
Toronto W01 64 $22,512,100 $351,752 $332,500 96 57 99% 26
Toronto W02 27 $9,360,988 $346,703 $345,000 48 26 98% 19
Toronto W03 21 $4,562,800 $217,276 $222,500 22 12 99% 33
Toronto W04 59 $11,085,601 $187,892 $182,000 90 59 97% 38
Toronto W05 63 $10,621,800 $168,600 $143,000 110 98 96% 48
Toronto W06 142 $48,668,198 $342,734 $309,000 298 234 97% 38
Toronto W07 9 $4,678,500 $519,833 $385,000 10 5 99% 38
Toronto W08 178 $55,584,510 $312,273 $288,750 244 113 99% 31
Toronto W09 54 $8,196,550 $151,788 $109,000 84 64 96% 47
Toronto W10 76 $13,634,100 $179,396 $168,250 141 113 96% 42
Toronto Central 2,296 $966,106,369 $420,778 $365,000 3,450 1,780 98% 29
Toronto C01 888 $366,634,937 $412,877 $370,000 1,394 761 98% 28
Toronto C02 84 $77,490,286 $922,503 $649,000 173 116 96% 31
Toronto C03 25 $12,750,500 $510,020 $447,000 35 23 98% 43
Toronto C04 35 $18,278,300 $522,237 $411,000 66 40 98% 31
Toronto C06 22 $7,436,180 $338,008 $335,000 32 26 98% 43
Toronto C07 139 $45,925,288 $330,398 $318,000 200 87 98% 26
Toronto C08 301 $124,386,064 $413,243 $383,000 398 191 98% 29
Toronto C09 37 $27,424,100 $741,192 $517,000 44 17 98% 24
Toronto C10 87 $40,289,276 $463,095 $415,000 116 39 98% 26
Toronto C11 53 $10,976,350 $207,101 $193,000 75 42 97% 37
Toronto C12 26 $18,387,900 $707,227 $543,500 28 23 96% 50
Toronto C13 109 $32,838,483 $301,270 $274,000 138 61 98% 31
Toronto C14 338 $127,212,582 $376,369 $353,500 438 184 98% 26
Toronto C15 152 $56,076,123 $368,922 $342,000 313 171 98% 33
Toronto East 605 $144,176,968 $238,309 $233,500 980 596 98% 34
Toronto E01 35 $15,727,050 $449,344 $429,900 52 27 100% 22
Toronto E02 24 $10,702,400 $445,933 $388,000 25 11 99% 22
Toronto E03 33 $6,140,300 $186,070 $140,000 44 20 98% 26
Toronto E04 72 $13,415,250 $186,323 $177,500 132 78 97% 37
Toronto E05 97 $24,226,833 $249,761 $221,000 123 48 97% 26
Toronto E06 14 $4,021,300 $287,236 $258,250 11 2 99% 23
Toronto E07 115 $27,262,288 $237,063 $235,000 197 128 98% 39
Toronto E08 39 $6,174,500 $158,321 $152,000 61 45 96% 42
Toronto E09 108 $26,227,050 $242,843 $240,500 227 160 97% 35
Toronto E10 14 $1,979,400 $141,386 $139,000 21 15 97% 46
Toronto E11 54 $8,300,597 $153,715 $150,000 87 61 97% 40
Page 3
Condo Market Report, Fourth Quarter 2011 3
4. Toronto Real Estate Board
Condominium Apartment Market Summary1
Share of Total Condo Apartment Sales By TREB Area Condo Apartment Sales by Price Range (All Areas)
2%
2% 0-199,999
City of Toronto 200K-299,999
10%
300K-399,999
Selling Price Range
400K-499,999
Peel Region
500K-599,999
15% 600K-699,999
York Region
700K-799,999
800K-899,999
Durham Region 900K-999,999
72% 1,000,000+
Halton Region
Number of Sales
Source: TREB Source: TREB
Share of Total Condo Apartment Sales By Bedroom Type Condo Apartment Price by Bedroom Type (All Areas)
2% (All Areas)
$450,000
7% Average Selling Price
Bachelor $400,000
20% Median Selling Price
$350,000
18% One Bedroom $300,000
$250,000
One Bedroom +
$200,000
Den
Two Bedroom $150,000
$100,000
22%
Two Bedroom + $50,000
Den $0
32% Three Bedroom + Bachelor
One One Two Two Three Total
Bedroom Bedroom Bedroom Bedroom Bedroom
Source: TREB Source: Toronto Real Estate Board + Den + Den +
Page 3
Condo Market Report, Fourth Quarter 2011 4
5. Toronto Real Estate Board
Sub-Market Breakdown: Downtown Core1
Condo Apartment Sales by Price Range (Downtown Core)
0-199,999
200K-299,999
300K-399,999
Selling Price Range
400K-499,999
500K-599,999
600K-699,999
700K-799,999
800K-899,999
900K-999,999
1,000,000+
Number of Sales
Source: TREB
Condo Apartment Price by Bedroom Type (Downtown Core) Condo Aptartment Sales By Bedroom Type (Downtown Core)
$1,200,000
Bachelor 54
Average Selling Price
$1,000,000
Median Selling Price One Bedroom 342
$800,000
One Bedroom + Den 364
$600,000
Two Bedroom 244
$400,000
Two Bedroom +
176
$200,000 Den
$0 Three Bedroom + 9
Bachelor One One Two Two Three Total
Bedroom Bedroom Bedroom Bedroom Bedroom 0 100 200 300 400
Source: Toronto Real Estate Board + Den + Den + Source: TREB
Page 3
Condo Market Report, Fourth Quarter 2011 5
6. Toronto Real Estate Board
Sub-Market Breakdown: North York City Centre1
Condo Apartment Sales by Price Range (North York City
Centre)
0-199,999
200K-299,999
300K-399,999
Selling Price Range
400K-499,999
500K-599,999
600K-699,999
700K-799,999
800K-899,999
900K-999,999
1,000,000+
Number of Sales
Source: TREB
Condo Apartment Price by Bedroom Type (North York Condo Apartment Sales By Bedroom Type (North York
City Centre) City Centre)
$500,000 Bachelor 4
Average Selling Price
$450,000
$400,000 Median Selling Price One Bedroom 102
$350,000
$300,000 One Bedroom + Den 118
$250,000
$200,000 Two Bedroom 148
$150,000
Two Bedroom +
$100,000 76
Den
$50,000
$0 Three Bedroom + 29
Bachelor One One Two Two Three Total
Bedroom Bedroom Bedroom Bedroom Bedroom 0 50 100 150 200
Source: Toronto Real Estate Board + Den + Den + Source: TREB
Page 3
Condo Market Report, Fourth Quarter 2011 6
7. Toronto Real Estate Board
Sub-Market Breakdown: Mississauga City Centre1
Condo Apartment Sales by Price Range (Mississauga City
Centre)
0-199,999
200K-299,999
300K-399,999
Selling Price Range
400K-499,999
500K-599,999
600K-699,999
700K-799,999
800K-899,999
900K-999,999
1,000,000+
Number of Sales
Source: TREB
Condo Apartment Price by Bedroom Type (Mississauga Condo Apartment Sales By Bedroom Type (Mississauga
City Centre) City Centre)
$450,000 Bachelor 2
Average Selling Price
$400,000
Median Selling Price One Bedroom 42
$350,000
$300,000
One Bedroom + Den 73
$250,000
$200,000
Two Bedroom 57
$150,000
$100,000 Two Bedroom +
75
Den
$50,000
$0 Three Bedroom + 6
Bachelor One One Two Two Three Total
Bedroom Bedroom Bedroom Bedroom Bedroom 0 20 40 60 80
Source: Toronto Real Estate Board + Den + Den + Source: TREB
Page 3
Condo Market Report, Fourth Quarter 2011 7
8. Toronto Real Estate Board
New Home Market
Toronto CMA Condominium Apartment Completions The Resale and New Home Markets are Linked
(Annualized, 12-Month Moving Average)
• The trend for active condominium apartment listings generally follows
20,000 the trend for condominium apartment completions (bottom left chart).
18,000
16,000 • When new condo projects complete, there is normally a number of
14,000 owners who are looking to sell. These people could be investors or
12,000 buyers whose housing needs changed during the construction period.
10,000
The recent uptick in completions resulted in more active listings in the
8,000
6,000 fourth quarter of 2011.
4,000 • The relationship between listings and sales drives price growth. In
2,000
2011, we have seen condominium apartment sales high relative to
0
listings and strong annual rates of price growth have been the result.
Source: CMHC; TREB Adjustment
Condominium Apartment Completions and Condominium Apartment Sales-to-Active Listings Ratio and
MLS® Active Listings (Annualized Trend) Median Price Growth (All Areas)
70% Annual Median Price Change (Right Scale) 25%
30,000
Annual Median Price Growth
Sales-to-Active Listings ratio
60% Sales-to-Active Listings Ratio (Left Scale) 20%
25,000
50% 15%
20,000
40% 10%
15,000 30% 5%
10,000 20% 0%
5,000 Completions Active Listings 10% -5%
0 0% -10%
Source: Toronto Real Estate Board; CMHC Source: Toronto Real Estate Board
Page 3
Condo Market Report, Fourth Quarter 2011 8
9. Toronto Real Estate Board
Rental Market Summary
Number of Units Listed Rental Market Tightens in September through December Period
Sep.-Dec. 2011 vs. Sep.-Dec. 2010
3,500 • The condominium apartment rental market continued to tighten at the
2011 2010 end of 2011, with TorontoMLS® rental transactions up in comparison
3,000 to last year while the number of units listed for rent was down.
2,500 • This tightening in the rental market was evidenced further by a decline
2,000 in the condominium apartment vacancy rate, as reported by CMHC.
1,500
The overall GTA condo vacancy rate for 2011 was reported at 1.1 per
cent, down from 1.6 per cent in 2010.
1,000
• Average one-bedroom and two-bedroom rents rose above the rate of
500 inflation on a year-over-year basis.
0
Downtown Core North York City Centre Mississauga
Source: TREB
Number of Units Rented Average One-Bedroom Rents
Sep.-Dec. 2011 vs. Sep.-Dec. 2010 Sep.-Dec. 2011 vs. Sep.-Dec. 2010
2,000 $2,000
2011 2010 2011 2010
$1,600
1,500
$1,200
1,000
$800
500
$400
0 $0
Downtown Core North York City Centre Mississauga All TREB Downtown Core North York City Mississauga
Centre
Source: TREB Source: TREB
Page 3
Condo Market Report, Fourth Quarter 2011 9
10. Toronto Real Estate Board
Share of GTA Condo Industrial Leasing
Apartments In Rental
23.6%
19.9%
18.4%
12.8%
12.0%
Halton Peel Toronto York Durham
Source: CMHC, 2011 Fall Rental Market Survey
GTA Condo Apartment
Vacancy Rate
1.3%
0.8%
NOTES
1
Sales, dollar volume, average sale prices and median sale prices are based on firm transactions entered into the TorontoMLS® system between the first
and last day of the quarter being reported.
2
New listings entered into the TorontoMLS® system between the first and last day of the quarter being reported.
0.3% 3
Active listings as of the end of the last day of the quarter being reported.
0.3% 4
Ratio of the average selling price to the average listing price for firm transactions entered into the TorontoMLS® system between the first and last day
of the quarter being reported.
5
Average number of days on the market for firm transactions entered into the TorontoMLS® system between the first and last day of the quarter being
Halton Peel Toronto York Durham reported.
6
Past monthly and year-to-date figures are revised monthly.
Source: CMHC, 2011 Fall Rental Market Survey Page 3
Condo Market Report, Fourth Quarter 2011 10