![Syllabus ,[object Object],[object Object],[object Object],[object Object],[object Object],[object Object],[object Object]](data:image/gif;base64,R0lGODlhAQABAIAAAAAAAP///yH5BAEAAAAALAAAAAABAAEAAAIBRAA7)
Recomendados
Recomendados
Mais conteúdo relacionado
Mais procurados
Mais procurados (18)
Semelhante a 2004-10-14 AIR-257: Satellite Detection of Aerosols
Semelhante a 2004-10-14 AIR-257: Satellite Detection of Aerosols (20)
Mais de Rudolf Husar
Mais de Rudolf Husar (20)
Último
Último (20)
2004-10-14 AIR-257: Satellite Detection of Aerosols
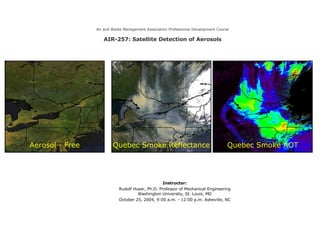
- 1. Air and Waste Management Association Professional Development Course AIR-257: Satellite Detection of Aerosols Instructor: Rudolf Husar, Ph.D. Professor of Mechanical Engineering Washington University, St. Louis, MO October 25, 2004, 9:00 a.m. - 12:00 p.m. Asheville, NC Aerosol - Free Quebec Smoke Reflectance Quebec Smoke AOT
- 6. April 19 Dust Cloud Over Asia SeaWiFS data with TOMS overlays (green lines) After about 500 km of transport, the plumes tend to merge and the streaky plume structure disappears. On April 19, the visibility was reduced due to dust throughout central and eastern Mongolia, and the optical thickness increased from < 0.5 on April 18 to > 2 on April 19. April 19, ‘98
- 7. Impact of Dust on Spectral Reflectance Excess spectral reflectance of dust over the ocean Change of the spectral reflectance of soil with increasing dust. Note, the yellow coloration of white clouds viewed through a dust layer.
- 8. Figure 3. Dust transport over the Pacific Ocean between April 21-25. In the SeaWiFS images [Kuring, 1998], the dust appears as a yellow dye marking its own position at noon each day.
- 9. Dust Cloud Over North America GOES 10 S GOES 10 Geostationary satellite image By April 27 th , the dust cloud rolled into North America and split with one branch heading southward along the CA coast and the another branch continuing eastward across the Canadian Rockies.
- 11. IMPROVE Fine Particle Dust Concentrations April 25, 1998 April 29, 1998 May 2, 1998 On April 25, the western U.S. was virtually dust-free, but reached high concentrations by April 29. On May 2, the elevated dust concentrations moved over the Rocky Mountains and the Colorado Plateau
- 12. Fine Particle Dust Ten Year Trends Figure 8. Ten-year trend of fine particle dust concentration at three IMPROVE monitoring sites.
- 13. Vertical Profile of Dust Cloud Over North America The height of the dust layer on April 27 was between 6-10 km Lidar backscatter at JPL, Pasadena. Lidar profiles at Salt Lake City
- 14. Solar Radiation Data for Eugene, OR
- 15. The Asian Dust Events of April 1998 Prepared by: R. B. Husar, D. Tratt, B. A. Schichtel, S. R. Falke, F. Li D. Jaffe, S. Gassó, T. Gill, N. S. Laulainen, F. Lu. M Reheis, Y. Chun, D. Westpha, B. N. Holben, C. Geymard, I. McKendry, N. Kuring, G. C. Feldman, C. McClain, R. J. Frouin, J. Merrill, D. DuBois, F. Vignola, T. Murayama, S. Nickovic, W. E. Wilson, K. Sassen, N. Sugimoto Paper to be submitted to the JGR issue on dust December 27, 1999 http://capita.wustl.edu/Asia-FarEast/reports/JGR/AsianDustEpisodeApril1998Draft5.htm
- 17. Location of fires (red dots) on May 15, 1998, based on Defense Meteorological Satellite Program ( DMSP ) satellite data NOAA’s Operational Significant Event Imagery (OSEI) Throughout the spring of 1998, thousands of fires in Central America have been burning with twice the intensity of normal springtime fires. Forest Fires over Central America
- 18. Smoke from the Central American Fires Based on SeaWiFS and other satellite imagery, thick smoke has been lingering over southern Mexico, Guatemala and Honduras and adjacent oceans throughout the spring season.
- 19. 3D SeaWiFS May 14, 1998
- 20. SeaWiFS, TOMS, Bext May 14, 1998
- 21. SeaWiFS, TOMS, Bext May 15, 1998
- 22. SeaWiFS, TOMS, Bext May 16, 1998
- 23. TOMS Aerosol Index GOES 8 Visible Imagery May 12 May 14 May 15 May 16 Smoke passes over Eastern North America
- 24. Daily TOMS images of absorbing aerosol index May 2 May 3 May 5 May 6 May 4 May 7 May 8 May 9 May 10 May 11 May 12 May 13 May 14 May 15 May 16 May 17 May 18 May 19 May 20 May 21 May 22 May 23 May 24 May 25 May 26 May 27 May 28 May 29 May 30 May 31
- 25. Average Excess TOMS Index for Mar., Apr., May 1998 Excess TOMS absorbing aerosol index averaged for March, April, May 1998 compared to 1999. The insert depicts the 1998 smoke impact from a global perspective.
- 26. Surface Ozone Concentration Superposition of daily maximum ozone and aerosol extinction maps derived from surface visibility.
- 27. PM10 concentration over the Eastern U.S. during the smoke event The smoke drifted into the US and Canada and caused exceedances of the PM standard, health alerts, and impairment of air traffic due to thick haze.
- 28. SeaWiFS Surface Reflectance on Clear and Smoky Days Spectral reflectance data derived from the SeaWiFS sensor on May 15, 1998; b) Excess aerosol backscattering over water.
- 29. Goes 8 Visible Image HY-SPLIT Trajectories HY-SPLIT Plumes TOMS Aerosol Index Comparison of HYSPLIT Predictions of airmass transport to GOES 8 and TOMS imagery
- 35. GOES 8 Animation July 6 animation: low-resolution , high resolution July 7 animation: low resolution , high resolution
- 43. Voyager Spatio-Temporal Data Browser
- 47. Micro Pulse Lidar, NASA Goddard
- 48. Total reflectance and optical depth comparison Smoke plume Haze Filtered clouds