High Equity Risk Premium in a Low Volatility World
•
1 gostou•532 visualizações

Actionable trade ideas for stock market investors and traders seeking alpha by overlaying their portfolios with options, other derivatives, ETFs, and disciplined and applied Game Theory for hedge fund managers and other active fund managers worldwide. Ryan Renicker, CFA

Recomendados
Recomendados
Mais conteúdo relacionado
Mais procurados
Mais procurados (18)
Destaque
Destaque (20)
Semelhante a High Equity Risk Premium in a Low Volatility World
Semelhante a High Equity Risk Premium in a Low Volatility World (20)
Mais de RYAN RENICKER
Mais de RYAN RENICKER (20)
Último
Último (20)
High Equity Risk Premium in a Low Volatility World
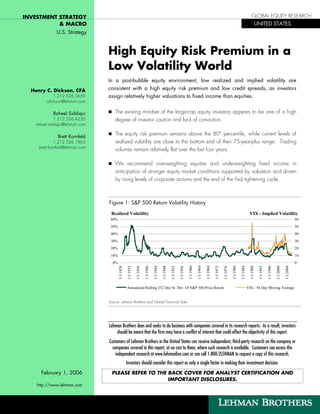
- 1. INVESTMENT STRATEGY GLOBAL EQUITY RESEARCH & MACRO UNITED STATES U.S. Strategy High Equity Risk Premium in a Low Volatility World In a post-bubble equity environment, low realized and implied volatility are Henry C. Dickson, CFA consistent with a high equity risk premium and low credit spreads, as investors 1.212.526.5659 assign relatively higher valuations to fixed income than equities. cdickson@lehman.com Raheel Siddiqui The existing mindset of the large-cap equity investors appears to be one of a high 1.212.526.4250 degree of investor caution and lack of conviction. raheel.siddiqui@lehman.com Brett Kornfeld The equity risk premium remains above the 80th percentile, while current levels of 1.212.526.1862 realized volatility are close to the bottom end of their 75-year-plus range. Trading brett.kornfeld@lehman.com volumes remain relatively flat over the last four years. We recommend overweighting equities and underweighting fixed income in anticipation of stronger equity market conditions supported by valuation and driven by rising levels of corporate actions and the end of the Fed tightening cycle. Figure 1: S&P 500 Return Volatility History Realized Volatility VIX - Implied Volatility 60% 60 50% 50 40% 40 30% 30 20% 20 10% 10 0% 0 1/1/1928 1/1/1932 1/1/1936 1/1/1940 1/1/1944 1/1/1948 1/1/1952 1/1/1956 1/1/1960 1/1/1964 1/1/1968 1/1/1972 1/1/1976 1/1/1980 1/1/1984 1/1/1988 1/1/1992 1/1/1996 1/1/2000 Annualized Rolling 252 Day St. Dev. Of S&P 500 Price Return VIX - 50 Day Moving Average 1/1/2004 Source: Lehman Brothers and Global Financial Data Lehman Brothers does and seeks to do business with companies covered in its research reports. As a result, investors should be aware that the firm may have a conflict of interest that could affect the objectivity of this report. Customers of Lehman Brothers in the United States can receive independent, third-party research on the company or companies covered in this report, at no cost to them, where such research is available. Customers can access this independent research at www.lehmanlive.com or can call 1-800-2LEHMAN to request a copy of this research. Investors should consider this report as only a single factor in making their investment decision. February 1, 2006 PLEASE REFER TO THE BACK COVER FOR ANALYST CERTIFICATION AND IMPORTANT DISCLOSURES. http://www.lehman.com
- 2. High Equity Risk Premium in a Low Volatility World High (Low) Risk Premium Tracks Low (High) Volatility 1 Since 1989, the realized S&P 500 volatility closely tracked the inverse of the ratio of the Fed Model (the P/E equivalent of the 10-year Treasury) relative to the S&P 500 trailing P/E. Currently, investors are paying a 35% premium for 10-year Treasury Bonds relative to the market, and S&P 500 volatility is at the low end of the range (see Figure 2). We believe this relationship is not a contradiction, but one that is consistent with a post-bubble environment for large-cap equities. It reflects a high level of caution and lack of conviction in large cap equities, in our opinion. Figure 2: Realized Volatility and Risk Premium Since 1989 S&P 500 Volatility Valuation Ratio (Inverted) 30% 0.4 25% 0.6 20% 0.8 15% 1.0 10% 1.2 5% 1.4 0% 1.6 Jan-89 Jan-90 Jan-91 Jan-92 Jan-93 Jan-94 Jan-95 Jan-96 Jan-97 Jan-98 Jan-99 Jan-00 Jan-01 Jan-02 Jan-03 Jan-04 Jan-05 Jan-06 Realized S&P 500 Volatility Lagged One Year Ratio of Fed M odel (1/10 Year Treasury Yield) to S&P 500 Trailing P/E Source: Lehman Brothers and Global Financial Data The current level of realized volatility is at the 8th percentile since 1926, while the equity th risk premium remains above its 80 percentile. Typically, periods of high equity risk premiums are followed by positive equity returns over the next 12-18 months. According to Lehman's Equity Derivatives Strategy team, both implied and realized volatility for the S&P 500 and single stocks should trade a few volatility points higher in 2006 relative to 2005. Potential catalysts include credit concerns, an uncertain interest rate outlook, housing market weakness, volatile energy prices, reversion in the volatility risk premium, and event risks such as the 2006 U.S. Congressional elections, 2 geopolitical concerns, and avian flu. 1 Please see the appendix to this report on page 12 for our definitions of realized and implied volatility. 2 Please see “Options Strategy Monthly: Low Volatility in the 7th Inning?” (1/10/06), Ryan Renicker, for further details. 2 February 1, 2006
- 3. High Equity Risk Premium in a Low Volatility World Our asset allocation recommendations include overweighting equities and underweighting fixed income (see Figure 14). This stance reflects our view that the equity risk premium should decline driven by the end of the Fed tightening cycle, solid earnings and economic growth, and continued redeployment of ever rising cash levels back to investors. February 1, 2006 3
- 4. High Equity Risk Premium in a Low Volatility World A Long Look Back at Equity Risk Premium Since 1962 the equity risk premium (ERP) rose to peak levels when periods of market euphoria ended badly and during periods of financial stress (see Figure 3). We believe the prolonged period of high risk premium is a reflection of the post-bubble environment weighing on large-cap equities. The aforementioned catalysts and moderation of headwinds generated by rising energy costs for instance, should help reduce the ERP and provide a real exit from the bubble environment. Figure 3: The Fed Model of Risk Premium Is in the 82nd Percentile Since 1962: Inverse of 10-Year Treasury Yield/S&P 500 Forward P/E 2.0 1.8 1.6 1.4 1.2 1.0 0.8 0.6 0.4 2 6 0 4 8 2 6 0 4 8 2 -6 -6 -7 -7 -7 -8 -8 -9 -9 -9 -0 ar ar ar ar ar ar ar ar ar ar ar M M M M M M M M M M M 1/(10 Yr Constant Maturity Treasury Yield) / S&P 500 Reported P/E Source: Lehman Brothers, Global Financial Data, FactSet, and Thomson Financial Along with the rising level of the ERP has been a flattening in the level of market volumes, which is more pronounced when the changing nature of the stock market is considered. As of December 31, 2005, program trading represented 64% of NYSE volume compared to 19% at the end of 1999. In contrast, block trading represented 19% of volume in S&P 500 names compared to 28% at the end of 1999. 4 February 1, 2006
- 5. High Equity Risk Premium in a Low Volatility World Figure 4: NYSE and Nasdaq Volumes Since 1990 Volume (Millions of Shares) 2,500 2,000 1,500 1,000 500 0 1/1/90 1/1/91 1/1/92 1/1/93 1/1/94 1/1/95 1/1/96 1/1/97 1/1/98 1/1/99 1/1/00 1/1/01 1/1/02 1/1/03 1/1/04 1/1/05 1/1/06 NYSE Volume - 100 Day M oving Average NASDAQ Composite Volume - 100 Day M oving Average Source: Lehman Brothers and Global Financial Data February 1, 2006 5
- 6. High Equity Risk Premium in a Low Volatility World Style, Asset Class, and Sector Comments Growth and Value Style Indices: Since 2000, the realized volatility levels of the Russell 1000 Growth and Value indices have converged as Value outperformed Growth. Figure 5: Realized Volatility of Russell 1000 Style Indices Since 1995 40% 30% 20% 10% 0% 5/31/1995 5/31/1996 5/31/1997 5/31/1998 5/31/1999 5/31/2000 5/31/2001 5/31/2002 5/31/2003 5/31/2004 5/31/2005 Russell 1000 Growth Russell 1000 Value Source: Lehman Brothers and Global Financial Data Large-, Mid- and Small-Caps: Since the market trough of early 2003, the S&P SmallCap 600 has shown more realized volatility than the S&P MidCap 400 which, in turn, has been more volatile than the S&P 500. We think this situation reflects greater investor interest in the Mid and Small Caps. The post bubble blues seem to be mostly a Large Cap phenomenon. 6 February 1, 2006
- 7. High Equity Risk Premium in a Low Volatility World Figure 6: Realized Volatility of S&P Mid- and Small-Cap Indices Relative to S&P 500 Since 1980 1.8 1.6 1.4 1.2 1.0 0.8 0.6 0.4 0.2 0.0 12/31/1979 12/31/1981 12/31/1983 12/31/1985 12/31/1987 12/31/1989 12/31/1991 12/31/1993 12/31/1995 12/31/1997 12/31/1999 12/31/2001 12/31/2003 12/31/2005 S&P M idCap 400 Relative to S&P 500 S&P SmallCap 600 Relative to S&P 500 Source: Lehman Brothers and Global Financial Data Gold and Oil: These commodities have shown more historical realized volatility than Large-Cap equities. Recently, gold has been less volatile as despite rapid price changes, daily returns have been fairly steady. Figure 7: Realized Volatility of WTI Oil and Gold Versus the S&P 500 90% 80% 70% 60% 50% 40% 30% 20% 10% 0% 12/31/1969 12/31/1971 12/31/1973 12/31/1975 12/31/1977 12/31/1979 12/31/1981 12/31/1983 12/31/1985 12/31/1987 12/31/1989 12/31/1991 12/31/1993 12/31/1995 12/31/1997 12/31/1999 12/31/2001 12/31/2003 12/31/2005 S&P 500 Gold Oil Source: Lehman Brothers and Global Financial Data Investment Grade Fixed Income: Historically, bonds have been much less volatile than equities. Credit spreads remain narrow, given the strong financial condition of Corporate America and a demand supply imbalance. We expect supply to increase in order to fund more M&A and underfunded pension plans. February 1, 2006 7
- 8. High Equity Risk Premium in a Low Volatility World Figure 8: Realized Volatility of the Lehman U.S. Aggregate Versus the S&P 500 S&P 500 Lehman U.S. Aggregate 30% 7% 25% 6% 5% 20% 4% 15% 3% 10% 2% 5% 1% 0% 0% 12/31/1989 12/31/1990 12/31/1991 12/31/1992 12/31/1993 12/31/1994 12/31/1995 12/31/1996 12/31/1997 12/31/1998 12/31/1999 12/31/2000 12/31/2001 12/31/2002 12/31/2003 12/31/2004 12/31/2005 S&P 500 Lehman U.S. Aggregate Source: Lehman Brothers and Global Financial Data S&P 500 Sectors: Energy has been the most volatile. Volatility in the Utilities sector began to pick up at the beginning of 2004. Volatility trends for the other sectors have been down to stable, with many sectors exhibiting realized volatility at the very bottom of their historical range. Historical realized volatility by S&P 500 GICS sector is presented in Figure 9. In order to present more history, selected industry and industry group charts are presented in Figure 10. Many industry-specific charts show similar trends to the sector charts. A few differences include the apparent turn in volatility for Chemicals, Property & Casualty Insurance and the Banks. Also, please note the most volatile time since 1950 for Banks was during the S&L Crisis and not during the market bubble or immediately after the 1987 crash. Realized volatility data is available upon request at the S&P 500 sub-industry level. Due to the low number of companies in each sub-industry, many sub-industries appear more volatile than the market simply because only one or two stocks are included, negating any potential diversification effects. 8 February 1, 2006