System Goal Tree Measuring TBLS Strategy
•
2 gostaram•617 visualizações

The document discusses defining a system, its goal, and a supporting strategy using a goal tree. It begins by explaining the importance of clearly defining the system and its boundaries. Next, it discusses defining the system's goal, noting there should only be one goal defined by the system's owner. A goal tree is then presented as a tool to visually map the goal, critical success factors (CSFs), and necessary conditions (NCs). The document emphasizes validating the measuring system to avoid conflicts among metrics that could harm performance. It provides an example goal tree and discusses analyzing metrics to check for relationships and potential conflicts between CSFs.

Recomendados
Recomendados
Mais conteúdo relacionado
Mais procurados
Mais procurados (8)
Destaque
Semelhante a System Goal Tree Measuring TBLS Strategy
Semelhante a System Goal Tree Measuring TBLS Strategy (20)
Último
Último (20)
System Goal Tree Measuring TBLS Strategy
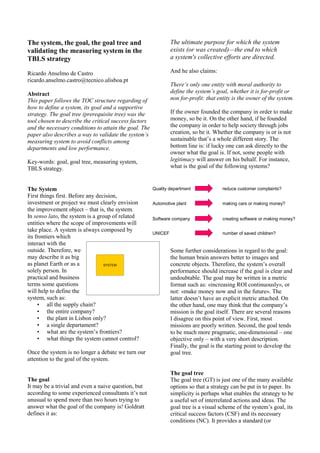
- 1. The system, the goal, the goal tree and validating the measuring system in the TBLS strategy Ricardo Anselmo de Castro ricardo.anselmo.castro@tecnico.ulisboa.pt Abstract This paper follows the TOC structure regarding of how to define a system, its goal and a supportive strategy. The goal tree (prerequisite tree) was the tool chosen to describe the critical success factors and the necessary conditions to attain the goal. The paper also describes a way to validate the system’s measuring system to avoid conflicts among departments and low performance. Key-words: goal, goal tree, measuring system, TBLS strategy. The System First things first. Before any decision, investment or project we must clearly envision the improvement object – that is, the system. In senso lato, the system is a group of related entities where the scope of improvements will take place. A system is always composed by its frontiers which interact with the outside. Therefore, we may describe it as big as planet Earth or as a solely person. In practical and business terms some questions will help to define the system, such as: • all the supply chain? • the entire company? • the plant in Lisbon only? • a single departament? • what are the system’s frontiers? • what things the system cannot control? Once the system is no longer a debate we turn our attention to the goal of the system. The goal It may be a trivial and even a naive question, but according to some experienced consultants it’s not unusual to spend more than two hours trying to answer what the goal of the company is! Goldratt defines it as: The ultimate purpose for which the system exists (or was created)—the end to which a system's collective efforts are directed. And he also claims: There’s only one entity with moral authority to define the system’s goal, whether it is for-profit or non for-profit: that entity is the owner of the system. If the owner founded the company in order to make money, so be it. On the other hand, if he founded the company in order to help society through jobs creation, so be it. Whether the company is or is not sustainable that’s a whole different story. The bottom line is: if lucky one can ask directly to the owner what the goal is. If not, some people with legitimacy will answer on his behalf. For instance, what is the goal of the following systems? Some further considerations in regard to the goal: the human brain answers better to images and concrete objects. Therefore, the system’s overall performance should increase if the goal is clear and undoubtable. The goal may be written in a metric format such as: «increasing ROI continuously», or not: «make money now and in the future». The latter doesn’t have an explicit metric attached. On the other hand, one may think that the company’s mission is the goal itself. There are several reasons I disagree on this point of view. First, most missions are poorly written. Second, the goal tends to be much more pragmatic, one-dimensional – one objective only – with a very short description. Finally, the goal is the starting point to develop the goal tree. The goal tree The goal tree (GT) is just one of the many available options so that a strategy can be put in to paper. Its simplicity is perhaps what enables the strategy to be a useful set of interrelated actions and ideas. The goal tree is a visual scheme of the system’s goal, its critical success factors (CSF) and its necessary conditions (NC). It provides a standard (or SYSTEM Quality department reduce customer complaints? Automotive plant making cars or making money? Software company creating software or making money? UNICEF number of saved children?
- 2. expectation) over what has to be done in order to attain the goal. Without that standard anyone will state what has to be done, and therefore creating a swamp of opinions. In isolation, CSFs and NCs are identical entities. It’s what is written in the goal that differentiates them. Clearly speaking, CSFs are the few necessary conditions that if not met will impede attaining the goal: if there’s not an objective that can be put in between the goal and the CSF, the CSF will be probably one. The company’s goal tree can (and should) be interconnected with the departments’ goal trees. As someone said: «when support functions have a clear vision about their purpose and an ambition (a goal), they can add value beyond just responding to other departments’ demands». Once the system and the goal are defined the steps to construct a goal tree are: 1. Define the CSFs – what are the last 3-5 steps that must be attained immediately before the goal? 2. Define the NCs – what key-actions should take place so that CSFs are attained? 3. Organize and link the goal to the CSFs and these to the NCs – only simple links of necessity logic based, with no «AND» or «OR» signs. 4. Verify the links between boxes and scrutinize the tree – ask help to people who are external to the team. In the figure below there’s an example of a GT applied to the production area (Dettmer, H. 2007). The rule of thumb is that the number of CSFs should be fewer than five as well as the number of NCs layers. The logic relationships (described by arrows) are always necessity based and the tree is read from top to bottom: «in order to do right the first time we must develop a fast problem resolution process». In a classic point of view, one can claim that CSFs are the strategy and NCs the corresponded tactics. Notice however that if the tool is applied at the company level, its top should be very alike regardless of what business industry we may be in. For instance, one should expect to find, quite frequently, metrics such as throughput, inventory or operational expenses at the top of the tree. In contrast, the more we dig into the tactics aspects of the tree the more the boxes description should diverge from one company to another. Maybe it is worth to note some differences between the goal tree and the strategic map proposed by Kaplan and Norton. These professors claim that finance metrics are not enough to correctly assess companies’ performance. They came up with four distinct areas: 1) finance, 2) customers, 3) internal processes, 4) learning and growth. This map follows the same visual aspect of the goal tree and connects a logic chain of events from point 4) to point 1). The reasoning is that it’s only possible to attain good finance results if we recognize customer satisfaction. In turn, this is only possible if internal processes work correctly and finally if they are managed in the right way (by people). To sum up, one will find at the bottom of the tree every box regarding learning and growth and, at the top of it, every box regarding finance. Maybe one of the key differentiators between these two tools is that the goal is explicit only in the goal tree. In the goal tree there is one and only one box at the top. This is not the case in the Norton and Kaplan approach. The risk of the latter is that the company will end up with several metrics that must be managed and improved at the same time. The focus is comprehensive and thus energy will be diverted. This is in opposite direction with what TOC (and TBLS) believes in. On the other hand, the goal tree is always built from top to bottom, something that it’s not clear regarding the way the strategic map is built, neither the type of logic used. Robust operations, flexible and fast. right the first time short lead times maximum flexibility to the demand fast problem resolution high quality raw material raw material short lead times, from order upon delivery effective methods that promote flow effective buffer manage- ment JIT concept usage fast and reliable suppliers NC NC NC NC NCNCNC CSF1 CSF2 CSF3 GOAL STRATEGY
- 3. The last section addresses the possibility of conflicts among CSFs or NCs. Validating the measuring system It’s crucial to guarantee that the measuring system will lead us to make the correct decisions towards the goal. We cannot let that local metrics govern the system itself. Local optima is good only and only if it will provide a boost to the performance of the system as a whole. In this sense, people should have a clear understanding of what is important so that their decisions are more effective and easily taken. One should acknowledge that different ways of measuring will lead us to different decisions. Moreover, there must be a preferred way of measuring that will lead us to attain more quickly goal units. In order to validate the measuring system one should: • List the main system metrics – goal and CSF metrics (in a future step this exercise needs to be expanded to NCs). • Look for causalities among them (use logic or data). • Cross them and look for conflicts. • Obtain feedback from the intervenients. • Reassess/change the system metrics. If we use the previous goal tree example, a straightforward thinking may lead us to the following: Goal Metric: Throughput – the velocity at which money is generated; CSF1 Metric: First Time Through – the probability to produce zero defects in a specific unit (product) with no reworks or scrap; CSF2 Metric: Lead Time – the elapsed time from receiving an order to its delivery; CSF3 Metric: Build to Schedule – metric that that takes into account the produced quantity at the right sequence. Two questions may burst immediately: 1. Are CSFs metrics interdependent of goal metrics? 2. Are CSFs metrics in conflict? It will be hard to convince someone to monitor a metric that presents no causality relationship with the goal. On the other hand, if there are CSFs in conflict one should fix this problem before continuing the TBLS strategic workshop. In the next figure we can see six graphs because these are the total possibilities of pair wise combination among four variables. Imagine that each pair of red dots is the sum of a week or month result. We can clearly see that the higher the first time through metric is, the higher the throughput (which is a good thing). Some other graphic shows that higher lead times put in jeopardy first time through results (compatible metrics!). In contrast we can see no clear relationship between throughput and build to schedule. Maybe the data are flawed or it really makes no sense to use build to schedule as a CSF. This analysis is vital to create a consensus so that the remaining work at the strategic workshop is fruitful. The rational is the following: it’s not a good practice to work on departments or improving NCs if there are conflicts in the system at a higher level. That will provoke deterioration in operations and human relationships and people will work towards compromised solutions – the word optimization is usually a euphemism to describe that trade-off! CONCLUSION If there’s a general consensus that it’s important to continuously improve the system, we need first and foremost to define it and establish a goal. Without this information it’s impossible to know if our decisions are good or bad. There are several tools that can be used to map the system’s strategy. In this paper the goal tree was used. At its top we state the goal, then the critical success factors to support the goal and ultimately the necessary conditions. Finally, validating the measuring system lets us look to the company holistically, increase our knowledge of how it works and eliminate conflicts among departments and mediocre performances. At the moment, the author is looking forward to develop pilots in companies that are willing to apply the TBLS strategy, so that with it, the model is corroborated. THROUGHPUT FIRST TIME THROUGH LEAD TIME BUILD TO SCHEDULE CAUSE AND EFFECT MATRIX
- 4. References [1] Castro, Ricardo A. (2014) O Proveito da Dúvida – troque o peixe pela cana de pesca. Leanpub. [2] Cox III, J., Schleier, J. (2010). Theory of Constraints Handbook. McGraw-Hill. [3] Dettmer, H. (2007). The logical thinking process – a system approach to complex problem solving. Amer Society for Quality; 2 edition. [4] Dettmer, H. (2011). What is our goal? Goal Systems International.