SF Housing Market Slows Sharply in 2022
•
0 gostou•36 visualizações

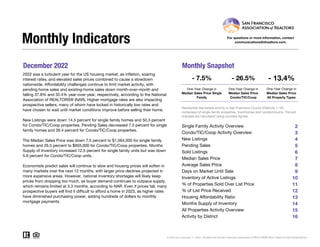
In 2022, rising inflation, interest rates, and home prices slowed the US housing market. Pending and existing home sales declined significantly year-over-year in December. In San Francisco, median home prices fell 7.5% for single family homes and 26.5% for condos from December 2021 to December 2022, as higher mortgage rates reduced buyer demand and purchasing power. New listings, pending sales, and closed sales all declined substantially from 2021 levels. Economists predict further price softening and slowing sales in 2023 if inventory remains limited and rates stay high.

Recomendados
Recomendados
Mais conteúdo relacionado
Semelhante a SF Housing Market Slows Sharply in 2022
Semelhante a SF Housing Market Slows Sharply in 2022 (20)
Último
Último (20)
SF Housing Market Slows Sharply in 2022
- 1. December 2022 Monthly Snapshot One-Year Change in One-Year Change in Median Sales Price Single Family Median Sales Price Condo/TIC/Coop 2 3 4 5 6 7 8 9 10 11 12 13 14 15 16 Monthly Indicators - 7.5% - 26.5% - 13.4% One-Year Change in 2022 was a turbulent year for the US housing market, as inflation, soaring interest rates, and elevated sales prices combined to cause a slowdown nationwide. Affordability challenges continue to limit market activity, with pending home sales and existing-home sales down month-over-month and falling 37.8% and 35.4% year-over-year, respectively, according to the National Association of REALTORS® (NAR). Higher mortgage rates are also impacting prospective sellers, many of whom have locked in historically low rates and have chosen to wait until market conditions improve before selling their home. New Listings were down 14.5 percent for single family homes and 50.3 percent for Condo/TIC/Coop properties. Pending Sales decreased 7.0 percent for single family homes and 39.4 percent for Condo/TIC/Coop properties. The Median Sales Price was down 7.5 percent to $1,564,000 for single family homes and 26.5 percent to $955,000 for Condo/TIC/Coop properties. Months Supply of Inventory increased 12.5 percent for single family units but was down 5.6 percent for Condo/TIC/Coop units. Economists predict sales will continue to slow and housing prices will soften in many markets over the next 12 months, with larger price declines projected in more expensive areas. However, national inventory shortages will likely keep prices from dropping too much, as buyer demand continues to outpace supply, which remains limited at 3.3 months, according to NAR. Even if prices fall, many prospective buyers will find it difficult to afford a home in 2023, as higher rates have diminished purchasing power, adding hundreds of dollars to monthly mortgage payments. Median Sales Price All Property Types Residential real estate activity in San Francisco County (Districts 1-10) composed of single-family properties, townhomes and condominiums. Percent changes are calculated using rounded figures. Single Family Activity Overview Months Supply of Inventory For questions or more information, contact communications@sfrealtors.com. Current as of January 11, 2023. All data from the San Francisco Association of REALTORS® MLS. Report © 2023 ShowingTime. Condo/TIC/Coop Activity Overview Inventory of Active Listings % of Properties Sold Over List Price % of List Price Received Housing Affordability Ratio All Properties Activity Overview New Listings Pending Sales Sold Listings Median Sales Price Average Sales Price Days on Market Until Sale Activity by District
- 2. Single Family Activity Overview Key metrics by report month and for year-to-date (YTD) starting from the first of the year. Key Metrics Historical Sparkbars 12-2021 12-2022 Percent Change YTD 2021 YTD 2022 Percent Change Current as of January 11, 2023. All data from the San Francisco Association of REALTORS® MLS. Report © 2023 ShowingTime. | 2 Months Supply 0.8 0.9 + 12.5% -- -- -- Affordability Ratio 32 26 - 18.8% % of List Price Received 114.3% 102.9% - 10.0% 114.7% 30 76.9% - 2.4% - 0.3% 23 - 23.3% 114.4% % of Properties Sold Over List Price 78.7% 48.7% - 38.1% 78.8% Active Listings 204 182 - 10.8% -- Avg. Sales Price $2,365,749 $1,886,762 - 20.2% $2,310,465 Days on Market 31 38 + 22.6% 24 24 0.0% $2,210,124 -- -- Median Sales Price $1,690,000 $1,564,000 - 7.5% $1,800,000 Sold Listings 216 150 - 30.6% 3,051 New Listings 83 71 - 14.5% 3,459 Pending Sales 129 120 - 7.0% - 20.8% 3,026 2,397 - 9.8% 3,119 2,411 - 21.0% $1,784,250 - 0.9% - 4.3% 12-2019 12-2020 12-2021 12-2022 12-2019 12-2020 12-2021 12-2022 12-2019 12-2020 12-2021 12-2022 12-2019 12-2020 12-2021 12-2022 12-2019 12-2020 12-2021 12-2022 12-2019 12-2020 12-2021 12-2022 12-2019 12-2020 12-2021 12-2022 12-2019 12-2020 12-2021 12-2022 12-2019 12-2020 12-2021 12-2022 12-2019 12-2020 12-2021 12-2022 12-2019 12-2020 12-2021 12-2022
- 3. Condo/TIC/Coop Activity Overview Key metrics by report month and for year-to-date (YTD) starting from the first of the year. Key Metrics Historical Sparkbars 12-2021 12-2022 Percent Change YTD 2021 YTD 2022 Percent Change Current as of January 11, 2023. All data from the San Francisco Association of REALTORS® MLS. Report © 2023 ShowingTime. | 3 Months Supply 1.8 1.7 - 5.6% -- -- -- Affordability Ratio 49 48 - 2.0% % of List Price Received 103.5% 98.1% - 5.2% 103.8% 53 47.2% - 4.1% - 0.3% 39 - 26.4% 103.5% % of Properties Sold Over List Price 46.5% 16.0% - 65.6% 49.2% Active Listings 677 449 - 33.7% -- Avg. Sales Price $1,488,734 $1,107,808 - 25.6% $1,391,860 Days on Market 47 74 + 57.4% 46 $1,200,000 - 0.8% - 1.3% 44 - 4.3% $1,373,589 -- -- Sold Listings 325 144 - 55.7% 4,507 3,137 - 30.4% Median Sales Price $1,300,000 $955,000 - 26.5% $1,210,000 - 11.4% Pending Sales 226 137 - 39.4% 4,486 3,104 - 30.8% New Listings 147 73 - 50.3% 5,641 4,999 12-2019 12-2020 12-2021 12-2022 12-2019 12-2020 12-2021 12-2022 12-2019 12-2020 12-2021 12-2022 12-2019 12-2020 12-2021 12-2022 12-2019 12-2020 12-2021 12-2022 12-2019 12-2020 12-2021 12-2022 12-2019 12-2020 12-2021 12-2022 12-2019 12-2020 12-2021 12-2022 12-2019 12-2020 12-2021 12-2022 12-2019 12-2020 12-2021 12-2022 12-2019 12-2020 12-2021 12-2022
- 4. New Listings New Listings Single Family Year-Over-Year Change Condo/TIC/ Coop Year-Over-Year Change Jan-2022 228 -9.9% 472 -12.3% Feb-2022 288 +14.7% 535 +6.4% Mar-2022 343 +5.9% 614 +13.7% Apr-2022 329 -4.9% 543 +0.4% May-2022 301 -15.4% 517 +1.4% Jun-2022 321 -4.5% 447 -10.6% Jul-2022 241 -21.2% 381 -16.8% Aug-2022 238 -14.1% 308 -20.6% Sep-2022 367 -13.2% 577 -20.1% Oct-2022 243 -27.0% 378 -28.5% Nov-2022 149 -12.9% 154 -41.9% Dec-2022 71 -14.5% 73 -50.3% 12-Month Avg 260 -9.8% 417 -11.4% Historical New Listings by Month Current as of January 11, 2023. All data from the San Francisco Association of REALTORS® MLS. Report © 2023 ShowingTime. | 4 A count of the properties that have been newly listed on the market in a given month. 124 159 83 147 71 73 Single Family Condo/TIC/Coop December 0 200 400 600 800 1-2005 1-2006 1-2007 1-2008 1-2009 1-2010 1-2011 1-2012 1-2013 1-2014 1-2015 1-2016 1-2017 1-2018 1-2019 1-2020 1-2021 1-2022 Single Family Condo/TIC/Coop 3,329 5,257 3,459 5,641 3,119 4,999 Single Family Condo/TIC/Coop Year to Date 2020 2021 2022 - 50.3% - 7.5% - 14.5% - 33.1% + 7.3% - 9.8% + 3.9% - 11.4% 2020 2021 2022 2020 2021 2022 2020 2021 2022 + 90.8% + 12.8% + 34.9% + 109.2%
- 5. Pending Sales Pending Sales Single Family Year-Over-Year Change Condo/TIC/ Coop Year-Over-Year Change Jan-2022 145 -14.2% 251 -14.0% Feb-2022 216 -4.4% 287 -24.7% Mar-2022 288 -0.3% 436 -8.0% Apr-2022 269 -5.9% 345 -28.1% May-2022 249 -18.9% 332 -28.3% Jun-2022 197 -28.1% 258 -33.5% Jul-2022 182 -29.7% 222 -39.0% Aug-2022 180 -20.4% 232 -26.6% Sep-2022 188 -42.9% 214 -36.5% Oct-2022 197 -27.8% 226 -44.2% Nov-2022 166 -35.9% 164 -54.4% Dec-2022 120 -7.0% 137 -39.4% 12-Month Avg 200 -20.8% 259 -30.8% Historical Pending Sales by Month A count of the properties on which offers have been accepted in a given month. Current as of January 11, 2023. All data from the San Francisco Association of REALTORS® MLS. Report © 2023 ShowingTime. | 5 201 307 129 226 120 137 Single Family Condo/TIC/Coop December 0 100 200 300 400 500 600 1-2005 1-2006 1-2007 1-2008 1-2009 1-2010 1-2011 1-2012 1-2013 1-2014 1-2015 1-2016 1-2017 1-2018 1-2019 1-2020 1-2021 1-2022 Single Family Condo/TIC/Coop 2,514 2,849 3,026 4,486 2,397 3,104 Single Family Condo/TIC/Coop Year to Date 2020 2021 2022 - 39.4% - 26.4% - 7.0% - 35.8% + 57.5% - 20.8% + 20.4% - 30.8% 2020 2021 2022 2020 2021 2022 2020 2021 2022 + 51.1% + 2.8% - 2.0% + 100.7%
- 6. Sold Listings Sold Listings Single Family Year-Over-Year Change Condo/TIC/ Coop Year-Over-Year Change Jan-2022 130 -19.3% 186 -31.1% Feb-2022 159 -2.5% 250 -10.1% Mar-2022 257 -5.2% 394 -13.8% Apr-2022 257 -11.1% 380 -17.7% May-2022 282 +6.0% 368 -17.1% Jun-2022 249 -23.6% 309 -34.7% Jul-2022 183 -28.2% 232 -37.1% Aug-2022 189 -26.2% 236 -32.2% Sep-2022 179 -26.9% 210 -28.1% Oct-2022 190 -38.7% 223 -38.7% Nov-2022 186 -36.5% 205 -51.8% Dec-2022 150 -30.6% 144 -55.7% 12-Month Avg 201 -21.0% 261 -30.4% Historical Sold Listings by Month A count of the actual sales that closed in a given month. Current as of January 11, 2023. All data from the San Francisco Association of REALTORS® MLS. Report © 2023 ShowingTime. | 6 302 353 216 325 150 144 Single Family Condo/TIC/Coop December 0 100 200 300 400 500 1-2005 1-2006 1-2007 1-2008 1-2009 1-2010 1-2011 1-2012 1-2013 1-2014 1-2015 1-2016 1-2017 1-2018 1-2019 1-2020 1-2021 1-2022 Single Family Condo/TIC/Coop 2,463 2,788 3,051 4,507 2,411 3,137 Single Family Condo/TIC/Coop Year to Date 2020 2021 2022 - 55.7% - 7.9% - 30.6% - 28.5% + 61.7% - 21.0% + 23.9% - 30.4% 2020 2021 2022 2020 2021 2022 2020 2021 2022 + 43.8% + 0.9% - 3.5% + 54.1%
- 7. Median Sales Price Median Sales Price Single Family Year-Over-Year Change Condo/TIC/ Coop Year-Over-Year Change Jan-2022 $1,630,000 +3.5% $1,070,000 -0.2% Feb-2022 $1,930,000 +17.0% $1,227,500 +2.6% Mar-2022 $2,000,000 +15.9% $1,206,750 -1.2% Apr-2022 $2,050,000 +13.9% $1,362,500 +13.5% May-2022 $2,007,500 +6.4% $1,215,000 -1.1% Jun-2022 $1,880,000 -3.1% $1,240,000 -0.8% Jul-2022 $1,670,000 -9.7% $1,198,500 -1.0% Aug-2022 $1,610,000 -12.9% $997,500 -13.3% Sep-2022 $1,650,000 -5.7% $1,160,000 -3.3% Oct-2022 $1,670,000 -7.5% $1,200,000 -3.8% Nov-2022 $1,500,000 -20.2% $1,148,000 -8.9% Dec-2022 $1,564,000 -7.5% $955,000 -26.5% 12-Month Avg* $1,784,250 -0.9% $1,200,000 -0.8% Historical Median Sales Price by Month Point at which half of the sales sold for more and half sold for less, not accounting for seller concessions, in a given month. * Median Sales Price for all properties from January 2022 through December 2022. This is not the average of the individual figures above. Current as of January 11, 2023. All data from the San Francisco Association of REALTORS® MLS. Report © 2023 ShowingTime. | 7 $1,550,000 $1,100,000 $1,690,000 $1,300,000 $1,564,000 $955,000 Single Family Condo/TIC/Coop December $500,000 $750,000 $1,000,000 $1,250,000 $1,500,000 $1,750,000 $2,000,000 $2,250,000 1-2005 1-2006 1-2007 1-2008 1-2009 1-2010 1-2011 1-2012 1-2013 1-2014 1-2015 1-2016 1-2017 1-2018 1-2019 1-2020 1-2021 1-2022 Single Family Condo/TIC/Coop $1,608,888 $1,190,000 $1,800,000 $1,210,000 $1,784,250 $1,200,000 Single Family Condo/TIC/Coop Year to Date 2020 2021 2022 - 26.5% + 18.2% - 7.5% + 9.0% + 1.7% - 0.9% + 11.9% - 0.8% 2020 2021 2022 2020 2021 2022 2020 2021 2022 + 11.7% + 3.8% - 0.8% - 7.2%
- 8. Average Sales Price Average Sales Price Single Family Year-Over-Year Change Condo/TIC/ Coop Year-Over-Year Change Jan-2022 $1,971,756 +1.3% $1,311,263 +8.3% Feb-2022 $2,417,245 +7.1% $1,398,389 +4.0% Mar-2022 $2,534,210 +14.6% $1,411,860 +3.1% Apr-2022 $2,515,877 +3.5% $1,464,116 +8.7% May-2022 $2,411,895 -2.7% $1,403,132 +1.7% Jun-2022 $2,355,940 -5.8% $1,366,119 -1.5% Jul-2022 $2,061,331 -10.1% $1,471,068 +8.4% Aug-2022 $1,950,088 -8.4% $1,175,621 -17.5% Sep-2022 $1,886,008 -12.9% $1,343,336 +0.8% Oct-2022 $2,128,399 -9.8% $1,419,037 -2.9% Nov-2022 $1,895,086 -19.4% $1,402,744 -8.8% Dec-2022 $1,886,762 -20.2% $1,107,808 -25.6% 12-Month Avg* $2,210,124 -4.3% $1,373,589 -1.3% Historical Average Sales Price by Month Average sales price for all closed sales, not accounting for seller concessions, in a given month. * Avg. Sales Price for all properties from January 2022 through December 2022. This is not the average of the individual figures above. Current as of January 11, 2023. All data from the San Francisco Association of REALTORS® MLS. Report © 2023 ShowingTime. | 8 $2,013,136 $1,281,834 $2,365,749 $1,488,734 $1,886,762 $1,107,808 Single Family Condo/TIC/Coop December $500,000 $1,000,000 $1,500,000 $2,000,000 $2,500,000 $3,000,000 1-2005 1-2006 1-2007 1-2008 1-2009 1-2010 1-2011 1-2012 1-2013 1-2014 1-2015 1-2016 1-2017 1-2018 1-2019 1-2020 1-2021 1-2022 Single Family Condo/TIC/Coop $2,004,340 $1,315,954 $2,310,465 $1,391,860 $2,210,124 $1,373,589 Single Family Condo/TIC/Coop Year to Date 2020 2021 2022 - 25.6% + 16.1% - 20.2% + 17.5% + 5.8% - 4.3% + 15.3% - 1.3% 2020 2021 2022 2020 2021 2022 2020 2021 2022 + 9.0% + 2.6% - 1.7% + 2.7%
- 9. Days on Market Until Sale Days on Market Until Sale Single Family Year-Over-Year Change Condo/TIC/ Coop Year-Over-Year Change Jan-2022 41 +2.5% 68 -9.3% Feb-2022 22 -35.3% 36 -45.5% Mar-2022 16 -38.5% 34 -29.2% Apr-2022 16 -20.0% 32 -31.9% May-2022 21 +5.0% 37 -5.1% Jun-2022 17 -10.5% 39 +5.4% Jul-2022 21 +10.5% 49 +16.7% Aug-2022 26 +4.0% 50 +16.3% Sep-2022 28 +21.7% 58 +45.0% Oct-2022 28 +40.0% 43 +19.4% Nov-2022 35 +66.7% 51 +24.4% Dec-2022 38 +22.6% 74 +57.4% 12-Month Avg* 24 +2.0% 44 -3.1% Historical Days on Market Until Sale by Month Average number of days between when a property is listed and when an offer is accepted in a given month. * Days on Market for all properties from January 2022 through December 2022. This is not the average of the individual figures above. Current as of January 11, 2023. All data from the San Francisco Association of REALTORS® MLS. Report © 2023 ShowingTime. | 9 36 64 31 47 38 74 Single Family Condo/TIC/Coop December 0 20 40 60 80 100 120 1-2005 1-2006 1-2007 1-2008 1-2009 1-2010 1-2011 1-2012 1-2013 1-2014 1-2015 1-2016 1-2017 1-2018 1-2019 1-2020 1-2021 1-2022 Single Family Condo/TIC/Coop 29 46 24 46 24 44 Single Family Condo/TIC/Coop Year to Date 2020 2021 2022 + 57.4% - 26.6% + 22.6% - 13.9% 0.0% 0.0% - 17.2% - 4.3% 2020 2021 2022 2020 2021 2022 2020 2021 2022 + 12.5% + 7.4% + 17.9% + 25.5%
- 10. Inventory of Active Listings Inventory of Active Listings Single Family Year-Over-Year Change Condo/TIC/ Coop Year-Over-Year Change Jan-2022 261 -35.1% 834 -33.1% Feb-2022 300 -21.1% 993 -19.7% Mar-2022 318 -13.1% 1,049 -8.7% Apr-2022 337 -14.2% 1,111 -0.1% May-2022 331 -18.3% 1,122 +4.8% Jun-2022 377 -9.2% 1,100 +3.8% Jul-2022 366 -13.7% 1,017 -4.1% Aug-2022 347 -19.1% 889 -13.3% Sep-2022 480 +1.7% 1,100 -15.5% Oct-2022 466 -4.3% 1,083 -16.9% Nov-2022 360 -0.6% 843 -22.9% Dec-2022 182 -10.8% 449 -33.7% 12-Month Avg* 344 -13.0% 966 -13.1% Historical Inventory of Active Listings by Month The number of properties available for sale in active status at the end of a given month. * Active Listings for all properties from January 2022 through December 2022. This is not the average of the individual figures above. Current as of January 11, 2023. All data from the San Francisco Association of REALTORS® MLS. Report © 2023 ShowingTime. | 10 398 1,143 204 677 182 449 Single Family Condo/TIC/Coop December 0 500 1,000 1,500 2,000 2,500 1-2005 1-2006 1-2007 1-2008 1-2009 1-2010 1-2011 1-2012 1-2013 1-2014 1-2015 1-2016 1-2017 1-2018 1-2019 1-2020 1-2021 1-2022 Single Family Condo/TIC/Coop 2020 2021 2022 - 33.7% - 40.8% - 10.8% - 48.7% 2020 2021 2022 + 54.3% + 131.4%
- 11. % of Properties Sold Over List Price % of Properties Sold Over List Price Single Family Year-Over-Year Change Condo/TIC/ Coop Year-Over-Year Change Jan-2022 75.4% +30.4% 38.7% +76.7% Feb-2022 86.8% +27.5% 58.4% +65.4% Mar-2022 86.4% +17.1% 58.1% +35.4% Apr-2022 88.7% +16.6% 62.9% +39.2% May-2022 86.9% +9.0% 55.3% +3.6% Jun-2022 86.3% +5.0% 57.3% +5.5% Jul-2022 78.1% -6.5% 40.1% -27.9% Aug-2022 75.7% -10.3% 37.3% -31.7% Sep-2022 67.0% -20.7% 31.0% -43.1% Oct-2022 64.2% -24.0% 37.7% -37.9% Nov-2022 57.5% -27.7% 30.2% -45.9% Dec-2022 48.7% -38.1% 16.0% -65.6% 12-Month Avg 76.9% -2.4% 47.2% -4.1% Historical % of Properties Sold Over List Price by Month Percentage found when dividing the number of properties sold by properties sold over its original list price, not accounting for seller concessions. * % of Properties Sold Over List Price for all properties from January 2022 through December 2022. This is not the average of the individual figures above. Current as of January 11, 2023. All data from the San Francisco Association of REALTORS® MLS. Report © 2023 ShowingTime. | 11 62.9% 28.6% 78.7% 46.5% 48.7% 16.0% Single Family Condo/TIC/Coop December 0.0% 20.0% 40.0% 60.0% 80.0% 100.0% 1-2005 1-2006 1-2007 1-2008 1-2009 1-2010 1-2011 1-2012 1-2013 1-2014 1-2015 1-2016 1-2017 1-2018 1-2019 1-2020 1-2021 1-2022 Single Family Condo/TIC/Coop 65.5% 40.4% 78.8% 49.2% 76.9% 47.2% Single Family Condo/TIC/Coop Year to Date 2020 2021 2022 - 65.6% + 62.6% - 38.1% + 25.1% + 21.8% - 2.4% + 20.3% - 4.1% 2020 2021 2022 2020 2021 2022 2020 2021 2022 - 7.9% - 14.5% - 31.4% - 38.8%
- 12. % of List Price Received % of List Price Received Single Family Year-Over-Year Change Condo/TIC/ Coop Year-Over-Year Change Jan-2022 117.4% +11.5% 101.1% +2.4% Feb-2022 121.2% +10.5% 106.1% +5.4% Mar-2022 121.9% +8.7% 106.4% +3.9% Apr-2022 123.1% +8.2% 107.2% +3.4% May-2022 119.6% +2.4% 105.9% +0.7% Jun-2022 116.8% +0.5% 105.3% 0.0% Jul-2022 110.9% -6.4% 101.5% -3.1% Aug-2022 108.4% -6.6% 100.7% -3.5% Sep-2022 108.5% -6.7% 100.6% -4.2% Oct-2022 107.1% -8.5% 100.4% -4.8% Nov-2022 104.9% -8.6% 99.2% -5.2% Dec-2022 102.9% -10.0% 98.1% -5.2% 12-Month Avg* 114.4% -0.3% 103.5% -0.3% Historical % of List Price Received by Month Percentage found when dividing a property’s sales price by its most recent list price, then taking the average for all properties sold in a given month, not accounting for seller concessions. * % of List Price Received for all properties from January 2022 through December 2022. This is not the average of the individual figures above. Current as of January 11, 2023. All data from the San Francisco Association of REALTORS® MLS. Report © 2023 ShowingTime. | 12 106.0% 99.3% 114.3% 103.5% 102.9% 98.1% Single Family Condo/TIC/Coop December 107.5% 101.2% 114.7% 103.8% 114.4% 103.5% Single Family Condo/TIC/Coop Year to Date 90.0% 100.0% 110.0% 120.0% 130.0% 1-2005 1-2006 1-2007 1-2008 1-2009 1-2010 1-2011 1-2012 1-2013 1-2014 1-2015 1-2016 1-2017 1-2018 1-2019 1-2020 1-2021 1-2022 Single Family Condo/TIC/Coop 2020 2021 2022 - 5.2% + 4.2% - 10.0% + 7.8% 2020 2021 2022 - 3.5% - 3.6% 2020 2021 2022 - 0.3% + 2.6% - 0.3% + 6.7% 2020 2021 2022 - 4.4% - 3.9%
- 13. Housing Affordability Ratio Housing Affordability Ratio Single Family Year-Over-Year Change Condo/TIC/ Coop Year-Over-Year Change Jan-2022 32 -11.1% 57 -9.5% Feb-2022 27 -18.2% 49 -7.5% Mar-2022 24 -25.0% 45 -13.5% Apr-2022 21 -32.3% 37 -32.7% May-2022 22 -26.7% 42 -22.2% Jun-2022 23 -17.9% 40 -23.1% Jul-2022 27 -10.0% 43 -20.4% Aug-2022 28 -6.7% 51 -10.5% Sep-2022 24 -25.0% 39 -29.1% Oct-2022 23 -25.8% 37 -30.2% Nov-2022 27 -10.0% 39 -27.8% Dec-2022 26 -18.8% 48 -2.0% 12-Month Avg* 25 -16.7% 44 -11.6% Historical Housing Affordability Ratio by Month This index measures housing affordability for the region. For example, an index of 120 means the median household income is 120% of what is necessary to qualify for the median-priced home under prevailing interest rates. A higher number means greater affordability. * Affordability Ratio for all properties from January 2022 through December 2022. This is not the average of the individual figures above. Current as of January 11, 2023. All data from the San Francisco Association of REALTORS® MLS. Report © 2023 ShowingTime. | 13 37 62 32 49 26 48 Single Family Condo/TIC/Coop December 20 40 60 80 100 1-2005 1-2006 1-2007 1-2008 1-2009 1-2010 1-2011 1-2012 1-2013 1-2014 1-2015 1-2016 1-2017 1-2018 1-2019 1-2020 1-2021 1-2022 Single Family Condo/TIC/Coop 2020 2021 2022 - 2.0% - 21.0% - 18.8% - 13.5% 2020 2021 2022 - 2.6% + 19.2% 36 58 30 53 23 39 Single Family Condo/TIC/Coop Year to Date 2020 2021 2022 - 26.4% - 8.6% - 23.3% - 16.7% 2020 2021 2022 + 5.9% + 13.7%
- 14. Months Supply of Inventory Months Supply of Inventory Single Family Year-Over-Year Change Condo/TIC/ Coop Year-Over-Year Change Jan-2022 1.0 -47.4% 2.3 -54.0% Feb-2022 1.2 -29.4% 2.7 -42.6% Mar-2022 1.3 -18.8% 2.9 -27.5% Apr-2022 1.4 -12.5% 3.2 -8.6% May-2022 1.4 -12.5% 3.3 +6.5% Jun-2022 1.6 0.0% 3.4 +13.3% Jul-2022 1.6 0.0% 3.2 +10.3% Aug-2022 1.5 -6.3% 2.9 +3.6% Sep-2022 2.2 +22.2% 3.7 +5.7% Oct-2022 2.2 +15.8% 3.8 +8.6% Nov-2022 1.8 +28.6% 3.2 +10.3% Dec-2022 0.9 +12.5% 1.7 -5.6% 12-Month Avg* 1.5 -4.7% 3.0 -10.7% Historical Months Supply of Inventory by Month The inventory of homes for sale at the end of a given month, divided by the average monthly pending sales from the last 12 months. * Months Supply for all properties from January 2022 through December 2022. This is not the average of the individual figures above. Current as of January 11, 2023. All data from the San Francisco Association of REALTORS® MLS. Report © 2023 ShowingTime. | 14 1.9 4.8 0.8 1.8 0.9 1.7 Single Family Condo/TIC/Coop December 0.0 2.0 4.0 6.0 8.0 10.0 12.0 1-2005 1-2006 1-2007 1-2008 1-2009 1-2010 1-2011 1-2012 1-2013 1-2014 1-2015 1-2016 1-2017 1-2018 1-2019 1-2020 1-2021 1-2022 Single Family Condo/TIC/Coop 2020 2021 2022 - 5.6% - 62.5% + 12.5% - 57.9% 2020 2021 2022 + 46.2% + 140.0%
- 15. All Properties Activity Overview Key metrics by report month and for year-to-date (YTD) starting from the first of the year. Key Metrics Historical Sparkbars 12-2021 12-2022 Percent Change YTD 2021 YTD 2022 Percent Change Current as of January 11, 2023. All data from the San Francisco Association of REALTORS® MLS. Report © 2023 ShowingTime. | 15 Months Supply 1.4 1.4 0.0% -- -- -- Affordability Ratio 35 31 - 11.4% % of List Price Received 107.7% 100.6% - 6.6% 108.2% 37 60.1% - 1.6% 0.0% 27 - 27.0% 108.2% % of Properties Sold Over List Price 58.8% 33.1% - 43.7% 61.1% Active Listings 914 653 - 28.6% -- Avg. Sales Price $1,833,674 $1,504,401 - 18.0% $1,762,183 Days on Market 41 55 + 34.1% 37 $1,450,000 + 0.8% - 1.7% 36 - 2.7% $1,732,161 -- -- Sold Listings 546 302 - 44.7% 7,646 5,617 - 26.5% Median Sales Price $1,455,000 $1,260,000 - 13.4% $1,438,000 - 11.0% Pending Sales 360 261 - 27.5% 7,598 5,569 - 26.7% New Listings 233 148 - 36.5% 9,244 8,223 12-2019 12-2020 12-2021 12-2022 12-2019 12-2020 12-2021 12-2022 12-2019 12-2020 12-2021 12-2022 12-2019 12-2020 12-2021 12-2022 12-2019 12-2020 12-2021 12-2022 12-2019 12-2020 12-2021 12-2022 12-2019 12-2020 12-2021 12-2022 12-2019 12-2020 12-2021 12-2022 12-2019 12-2020 12-2021 12-2022 12-2019 12-2020 12-2021 12-2022 12-2019 12-2020 12-2021 12-2022
- 16. Activity by District SF District 1: Northwest (Sea Cliff, Lake, Jordan Park / Laurel Heights, Outer Richmond, Central Richmond, Inner Richmond, Lone Mountain) SF District 2: Central West (Outer Sunset, Central Sunset, Inner Sunset, Outer Parkside, Parkside, Inner Parkside, Golden Gate Heights) SF District 3: Southwest (Pine Lake Park, Lake Shore, Merced Manor, Stonestown, Lakeside, Merced Heights, Ingleside, Ingleside Heights, Oceanview) SF District 4: Twin Peaks W (Forest Hill (& Ext), W Portal, St Francis Wd, Balboa Terr, Mt Dav Manor, Ingleside Terr, Monterey Hts, Wstwd Pk & H'lnds, Shrwd Fst, Miraloma Pk, Dmnd Hts, Mdtwn Terr) SF District 5: Central (Haight Ashbury, Cole Vly / Prnssus Hts, Clarndn Hts, Corona Hts, Twin Pks, Glen Pk, Noe Vly, Eureka Vly / Dolores Hts, Mission Dolores, Duboce Trngl, Buena Vista / Ashbury Hts) SF District 6: Central North (Lower Pacific Heights, Anza Vista, Western Addition, North Panhandle, Alamo Square, Hayes Valley) SF District 7: North (Marina, Cow Hollow, Presidio Heights, Pacific Heights) SF District 8: Northeast (North Waterfront, North Beach, Russian Hill, Telegraph Hill, Nob Hill, Financial District / Barbary Coast, Downtown, Van Ness / Civic Center, Tenderloin) SF District 9: Central East (Yerba Buena, South Beach, South of Market, Mission Bay, Inner Mission, Potrero Hill, Central Waterfront / Dogpatch, Bernal Heights) SF District 10: Southeast (Outer Mission, Mission Terr, Excelsior, Portola, Bayview, Silver Terr, Hunters Pt, Candlestick Pt, Bayview Hts, Little Hollywood, Visitation Vly, Crocker Amazon) 12-2021 12-2022 + / – 12-2021 12-2022 + / – 12-2021 12-2022 + / – 12-2021 12-2022 + / – 12-2021 12-2022 + / – Single Family 1 SF District 1 15 19 +26.7% 17 12 -29.4% $2,999,000 $2,385,000 -20.5% 18 36 +100.0% 0.7 1.1 +57.1% 2 SF District 2 18 16 -11.1% 44 33 -25.0% $1,627,500 $1,600,000 -1.7% 22 33 +50.0% 0.4 0.4 0.0% 3 SF District 3 14 14 0.0% 18 9 -50.0% $1,427,500 $1,094,000 -23.4% 26 45 +73.1% 0.8 1.1 +37.5% 4 SF District 4 16 16 0.0% 36 24 -33.3% $1,875,000 $1,627,500 -13.2% 30 42 +40.0% 0.4 0.6 +50.0% 5 SF District 5 32 20 -37.5% 27 21 -22.2% $2,642,000 $2,200,000 -16.7% 33 39 +18.2% 0.8 0.7 -12.5% 6 SF District 6 6 2 -66.7% 2 3 +50.0% $2,485,000 $2,709,500 +9.0% 22 28 +27.3% 1.2 0.6 -50.0% 7 SF District 7 22 18 -18.2% 12 3 -75.0% $4,500,000 $9,000,000 +100.0% 78 52 -33.3% 1.7 2.3 +35.3% 8 SF District 8 17 8 -52.9% 1 0 -100.0% $8,825,000 $0 -100.0% 268 0 -100.0% 6.1 2.7 -55.7% 9 SF District 9 24 17 -29.2% 21 14 -33.3% $1,450,000 $1,775,000 +22.4% 36 25 -30.6% 0.8 0.8 0.0% 10 SF District 10 40 52 +30.0% 38 31 -18.4% $1,243,500 $1,020,000 -18.0% 28 44 +57.1% 0.9 1.3 +44.4% Condo/TIC/Coop 1 SF District 1 18 8 -55.6% 21 8 -61.9% $1,410,000 $1,170,000 -17.0% 26 50 +92.3% 1.0 0.6 -40.0% 2 SF District 2 9 11 +22.2% 3 3 0.0% $1,395,000 $670,000 -52.0% 32 28 -12.5% 1.6 3.2 +100.0% 3 SF District 3 4 2 -50.0% 5 0 -100.0% $830,000 $0 -100.0% 50 0 -100.0% 1.0 0.6 -40.0% 4 SF District 4 11 6 -45.5% 6 1 -83.3% $986,000 $391,120 -60.3% 55 250 +354.5% 2.2 1.4 -36.4% 5 SF District 5 39 42 +7.7% 54 19 -64.8% $1,480,000 $1,150,000 -22.3% 36 54 +50.0% 0.7 0.9 +28.6% 6 SF District 6 63 27 -57.1% 36 11 -69.4% $1,417,500 $1,025,000 -27.7% 33 90 +172.7% 1.5 0.9 -40.0% 7 SF District 7 39 19 -51.3% 33 20 -39.4% $1,600,000 $1,577,500 -1.4% 50 71 +42.0% 0.9 0.7 -22.2% 8 SF District 8 154 100 -35.1% 58 25 -56.9% $1,115,000 $790,000 -29.1% 70 70 0.0% 2.4 2.3 -4.2% 9 SF District 9 305 213 -30.2% 104 51 -51.0% $1,158,500 $935,000 -19.3% 49 85 +73.5% 2.4 2.5 +4.2% 10 SF District 10 35 21 -40.0% 5 6 +20.0% $710,000 $750,000 +5.6% 23 52 +126.1% 4.1 3.3 -19.5% Key metrics by report month for the districts of San Francisco. Current as of January 11, 2023. All data from the San Francisco Association of REALTORS® MLS. Report © 2023 ShowingTime. | 16 Active Listings Sold Listings Median Sales Price Days on Market Months Supply