SlideShare a Scribd company logo
1 of 16
Download to read offline
December 2021 Monthly Snapshot
One-Year Change in One-Year Change in
Median Sales Price Single
Family
Median Sales Price
Condo/TIC/Coop
2
3
4
5
6
7
8
9
10
11
12
13
14
15
16
Monthly Indicators
+ 8.4% + 17.2% + 9.8%
One-Year Change in
The 2021 housing market was one for the history books. After three consecutive
months of increases recently, existing home sales are on pace to hit their
highest level in 15 years, with an estimated 6 million homes sold in 2021
according to the National Association of REALTORS®. Sales prices reached
new heights, inventory hit rock bottom, and homes sold in record time, often for
well above asking price. Mortgage rates, which began the year at historic lows,
remain attractive, and homeowners who choose to sell in the coming months
can expect to see plenty of buyer activity due to pent-up demand during the
pandemic.
New Listings were down 62.8 percent for single family homes and 55.1 percent
for Condo/TIC/Coop properties. Pending Sales decreased 38.5 percent for
single family homes and 31.9 percent for Condo/TIC/Coop properties.
The Median Sales Price was up 8.4 percent to $1,680,000 for single family
homes and 17.2 percent to $1,289,500 for Condo/TIC/Coop properties. Months
Supply of Inventory decreased 67.9 percent for single family units and 68.3
percent for Condo/TIC/Coop units.
Looking ahead, experts anticipate many of the housing market trends of 2021
will continue in 2022, albeit at a more moderate level. Strong buyer demand and
inventory shortages are likely to persist over the next year. Home sales are
projected to remain strong but will be tempered by the limited supply of homes,
higher sales prices, and rising interest rates, with the Federal Reserve planning
multiple rate hikes in the new year. Price growth is expected to slow somewhat
as a result, but affordability will likely remain a top constraint for some
homebuyers.
Median Sales Price
All Property Types
Residential real estate activity in San Francisco County (Districts 1-10)
composed of single-family properties, townhomes and condominiums. Percent
changes are calculated using rounded figures.
Single Family Activity Overview
Months Supply of Inventory
For questions or more information, contact
communications@sfrealtors.com.
Current as of January 11, 2022. All data from the San Francisco Association of REALTORS® MLS. Report © 2021 ShowingTime.
Condo/TIC/Coop Activity Overview
Inventory of Active Listings
% of Properties Sold Over List Price
% of List Price Received
Housing Affordability Ratio
All Properties Activity Overview
New Listings
Pending Sales
Sold Listings
Median Sales Price
Average Sales Price
Days on Market Until Sale
Activity by District
Single Family Activity Overview
Key metrics by report month and for year-to-date (YTD) starting from the first of the year.
Key Metrics Historical Sparkbars 12-2020 12-2021 Percent Change YTD 2020 YTD 2021 Percent Change
Current as of January 11, 2022. All data from the San Francisco Association of REALTORS® MLS. Report © 2021 ShowingTime. | 2
Months Supply 2.8 0.9 - 67.9% -- -- --
Affordability Ratio 37 32 - 13.5%
% of List Price Received 106.0% 114.6% + 8.1% 107.5%
36
78.9% + 20.5%
+ 6.8%
30 - 16.7%
114.8%
% of Properties Sold Over List Price 62.9% 79.4% + 26.2% 65.5%
Active Listings 584 227 - 61.1% --
Avg. Sales Price $2,013,136 $2,373,631 + 17.9% $2,004,340
Days on Market 35 30 - 14.3% 27 22 - 18.5%
$2,315,670
-- --
Median Sales Price $1,550,000 $1,680,000 + 8.4% $1,608,888
Sold Listings 302 209 - 30.8% 2,463
New Listings 148 55 - 62.8% 3,393
Pending Sales 208 128 - 38.5% + 20.1%
2,524 3,032
- 3.1%
3,287
3,043 + 23.5%
$1,800,000 + 11.9%
+ 15.5%
12-2018 12-2019 12-2020 12-2021
12-2018 12-2019 12-2020 12-2021
12-2018 12-2019 12-2020 12-2021
12-2018 12-2019 12-2020 12-2021
12-2018 12-2019 12-2020 12-2021
12-2018 12-2019 12-2020 12-2021
12-2018 12-2019 12-2020 12-2021
12-2018 12-2019 12-2020 12-2021
12-2018 12-2019 12-2020 12-2021
12-2018 12-2019 12-2020 12-2021
12-2018 12-2019 12-2020 12-2021
Condo/TIC/Coop Activity Overview
Key metrics by report month and for year-to-date (YTD) starting from the first of the year.
Key Metrics Historical Sparkbars 12-2020 12-2021 Percent Change YTD 2020 YTD 2021 Percent Change
Current as of January 11, 2022. All data from the San Francisco Association of REALTORS® MLS. Report © 2021 ShowingTime. | 3
Months Supply 6.3 2.0 - 68.3% -- -- --
Affordability Ratio 62 49 - 21.0%
% of List Price Received 99.3% 103.6% + 4.3% 101.2%
58
49.3% + 22.0%
+ 2.7%
53 - 8.6%
103.9%
% of Properties Sold Over List Price 28.6% 46.9% + 64.0% 40.4%
Active Listings 1,501 729 - 51.4% --
Avg. Sales Price $1,281,834 $1,463,982 + 14.2% $1,315,954
Days on Market 62 45 - 27.4% 43
$1,210,000 + 1.7%
+ 5.6%
43 0.0%
$1,389,519
-- --
Sold Listings 353 318 - 9.9% 2,788 4,489 + 61.0%
Median Sales Price $1,100,000 $1,289,500 + 17.2% $1,190,000
- 1.6%
Pending Sales 307 209 - 31.9% 2,850 4,464 + 56.6%
New Listings 247 111 - 55.1% 5,394 5,309
12-2018 12-2019 12-2020 12-2021
12-2018 12-2019 12-2020 12-2021
12-2018 12-2019 12-2020 12-2021
12-2018 12-2019 12-2020 12-2021
12-2018 12-2019 12-2020 12-2021
12-2018 12-2019 12-2020 12-2021
12-2018 12-2019 12-2020 12-2021
12-2018 12-2019 12-2020 12-2021
12-2018 12-2019 12-2020 12-2021
12-2018 12-2019 12-2020 12-2021
12-2018 12-2019 12-2020 12-2021
New Listings
market was one for
the history books.
After three
Single
Family
Year-Over-Year
Change
Condo/TIC/
Coop
Year-Over-Year
Change
Jan-2021 257 -0.8% 528 +38.6%
Feb-2021 306 +12.5% 501 +23.4%
Mar-2021 345 +98.3% 615 +141.2%
Apr-2021 351 +99.4% 511 +122.2%
May-2021 313 +13.8% 524 +4.0%
Jun-2021 323 -10.0% 490 -15.4%
Jul-2021 299 -26.7% 421 -39.7%
Aug-2021 298 -15.8% 424 -35.0%
Sep-2021 364 +2.5% 566 -15.0%
Oct-2021 245 -34.0% 415 -20.3%
Nov-2021 131 -45.9% 203 -20.4%
Dec-2021 55 -62.8% 111 -55.1%
12-Month Avg 274 -3.1% 442 -1.6%
Historical New Listings by Month
Current as of January 11, 2022. All data from the San Francisco Association of REALTORS® MLS. Report © 2021 ShowingTime. | 4
A count of the properties that have been newly listed on the market in a given month.
95
131
148
247
55
111
Single Family Condo/TIC/Coop
December
0
200
400
600
800
1-2005 1-2006 1-2007 1-2008 1-2009 1-2010 1-2011 1-2012 1-2013 1-2014 1-2015 1-2016 1-2017 1-2018 1-2019 1-2020 1-2021
Single Family Condo/TIC/Coop
2,976
3,951
3,393
5,394
3,287
5,309
Single Family Condo/TIC/Coop
Year to Date
2019 2020 2021
- 55.1%
+ 88.5%
- 62.8%
+ 55.8% + 36.5%
- 3.1%
+ 14.0% - 1.6%
2019 2020 2021 2019 2020 2021 2019 2020 2021
- 5.0% - 6.0% + 0.6%
+ 13.9%
Pending Sales
market was one for
the history books.
After three
Single
Family
Year-Over-Year
Change
Condo/TIC/
Coop
Year-Over-Year
Change
Jan-2021 170 +44.1% 292 +81.4%
Feb-2021 225 +52.0% 381 +67.8%
Mar-2021 290 +68.6% 473 +157.1%
Apr-2021 286 +262.0% 478 +419.6%
May-2021 307 +89.5% 462 +225.4%
Jun-2021 275 +21.1% 391 +67.1%
Jul-2021 260 -5.8% 364 +50.4%
Aug-2021 226 -3.8% 316 -1.9%
Sep-2021 333 +18.5% 337 +10.1%
Oct-2021 274 -11.9% 404 +21.3%
Nov-2021 258 -16.0% 357 +19.0%
Dec-2021 128 -38.5% 209 -31.9%
12-Month Avg 253 +20.1% 372 +56.6%
Historical Pending Sales by Month
A count of the properties on which offers have been accepted in a given month.
Current as of January 11, 2022. All data from the San Francisco Association of REALTORS® MLS. Report © 2021 ShowingTime. | 5
133
153
208
307
128
209
Single Family Condo/TIC/Coop
December
0
100
200
300
400
500
1-2005 1-2006 1-2007 1-2008 1-2009 1-2010 1-2011 1-2012 1-2013 1-2014 1-2015 1-2016 1-2017 1-2018 1-2019 1-2020 1-2021
Single Family Condo/TIC/Coop
2,445
2,907
2,524
2,850
3,032
4,464
Single Family Condo/TIC/Coop
Year to Date
2019 2020 2021
- 31.9%
+ 100.7%
- 38.5%
+ 56.4% - 2.0%
+ 20.1%
+ 3.2% + 56.6%
2019 2020 2021 2019 2020 2021 2019 2020 2021
- 2.2% - 2.5% - 3.5%
+ 2.0%
Sold Listings
market was one for
the history books.
After three
Single
Family
Year-Over-Year
Change
Condo/TIC/
Coop
Year-Over-Year
Change
Jan-2021 162 +48.6% 270 +78.8%
Feb-2021 163 +24.4% 278 +56.2%
Mar-2021 270 +50.8% 457 +93.6%
Apr-2021 289 +140.8% 462 +294.9%
May-2021 266 +133.3% 442 +287.7%
Jun-2021 325 +79.6% 471 +166.1%
Jul-2021 255 +7.1% 371 +39.5%
Aug-2021 257 +5.8% 348 +45.0%
Sep-2021 245 -4.7% 291 -9.9%
Oct-2021 309 +1.3% 362 +24.0%
Nov-2021 293 +3.2% 419 +22.9%
Dec-2021 209 -30.8% 318 -9.9%
12-Month Avg 254 +23.5% 374 +61.0%
Historical Sold Listings by Month
A count of the actual sales that closed in a given month.
Current as of January 11, 2022. All data from the San Francisco Association of REALTORS® MLS. Report © 2021 ShowingTime. | 6
210
229
302
353
209
318
Single Family Condo/TIC/Coop
December
0
100
200
300
400
500
1-2005 1-2006 1-2007 1-2008 1-2009 1-2010 1-2011 1-2012 1-2013 1-2014 1-2015 1-2016 1-2017 1-2018 1-2019 1-2020 1-2021
Single Family Condo/TIC/Coop
2,441
2,889
2,463
2,788
3,043
4,489
Single Family Condo/TIC/Coop
Year to Date
2019 2020 2021
- 9.9%
+ 54.1%
- 30.8%
+ 43.8% - 3.5%
+ 23.5%
+ 0.9% + 61.0%
2019 2020 2021 2019 2020 2021 2019 2020 2021
+ 22.1% - 2.7% - 5.3%
+ 13.9%
Median Sales Price
market was one for
the history books.
After three
Single
Family
Year-Over-Year
Change
Condo/TIC/
Coop
Year-Over-Year
Change
Jan-2021 $1,587,500 +8.7% $1,072,500 -7.2%
Feb-2021 $1,650,000 +2.5% $1,196,500 -5.0%
Mar-2021 $1,725,000 +9.5% $1,221,184 -2.3%
Apr-2021 $1,800,000 +12.1% $1,200,000 -5.9%
May-2021 $1,886,500 +18.8% $1,225,000 +12.6%
Jun-2021 $1,950,000 +12.7% $1,250,000 +2.0%
Jul-2021 $1,850,000 +15.3% $1,208,000 -4.2%
Aug-2021 $1,850,000 +13.8% $1,150,000 -5.0%
Sep-2021 $1,750,000 +6.1% $1,200,000 +2.1%
Oct-2021 $1,810,000 +12.8% $1,247,000 +8.2%
Nov-2021 $1,900,000 +16.0% $1,270,000 +8.4%
Dec-2021 $1,680,000 +8.4% $1,289,500 +17.2%
12-Month Avg* $1,800,000 +11.9% $1,210,000 +1.7%
Historical Median Sales Price by Month
Point at which half of the sales sold for more and half sold for less, not accounting for seller concessions, in a given month.
* Median Sales Price for all properties from January 2021 through December 2021. This is not the
average of the individual figures above.
Current as of January 11, 2022. All data from the San Francisco Association of REALTORS® MLS. Report © 2021 ShowingTime. | 7
$1,387,500
$1,185,000
$1,550,000
$1,100,000
$1,680,000
$1,289,500
Single Family Condo/TIC/Coop
December
$500,000
$750,000
$1,000,000
$1,250,000
$1,500,000
$1,750,000
$2,000,000
$2,250,000
1-2005 1-2006 1-2007 1-2008 1-2009 1-2010 1-2011 1-2012 1-2013 1-2014 1-2015 1-2016 1-2017 1-2018 1-2019 1-2020 1-2021
Single Family Condo/TIC/Coop
$1,551,000
$1,200,000
$1,608,888
$1,190,000
$1,800,000
$1,210,000
Single Family Condo/TIC/Coop
Year to Date
2019 2020 2021
+ 17.2%
- 7.2%
+ 8.4%
+ 11.7% - 0.8%
+ 11.9%
+ 3.7% + 1.7%
2019 2020 2021 2019 2020 2021 2019 2020 2021
- 6.6% + 1.7% + 2.1%
+ 2.2%
Average Sales Price
market was one for
the history books.
After three
Single
Family
Year-Over-Year
Change
Condo/TIC/
Coop
Year-Over-Year
Change
Jan-2021 $1,952,692 -8.2% $1,211,039 -4.5%
Feb-2021 $2,257,454 +18.2% $1,344,643 -0.5%
Mar-2021 $2,214,726 +9.2% $1,369,434 +0.2%
Apr-2021 $2,430,795 +11.3% $1,347,315 -0.0%
May-2021 $2,479,992 +32.1% $1,369,209 +9.4%
Jun-2021 $2,504,876 +13.8% $1,388,929 -1.9%
Jul-2021 $2,292,230 +13.8% $1,355,128 -3.0%
Aug-2021 $2,142,583 +7.8% $1,425,053 +7.4%
Sep-2021 $2,165,489 +14.2% $1,330,272 +1.9%
Oct-2021 $2,363,520 +23.9% $1,460,761 +16.6%
Nov-2021 $2,375,151 +16.7% $1,548,852 +21.9%
Dec-2021 $2,373,631 +17.9% $1,463,982 +14.2%
12-Month Avg* $2,315,670 +15.5% $1,389,519 +5.6%
Historical Average Sales Price by Month
Average sales price for all closed sales, not accounting for seller concessions, in a given month.
* Avg. Sales Price for all properties from January 2021 through December 2021. This is not the
average of the individual figures above.
Current as of January 11, 2022. All data from the San Francisco Association of REALTORS® MLS. Report © 2021 ShowingTime. | 8
$1,846,130
$1,247,790
$2,013,136
$1,281,834
$2,373,631
$1,463,982
Single Family Condo/TIC/Coop
December
$500,000
$1,000,000
$1,500,000
$2,000,000
$2,500,000
$3,000,000
1-2005 1-2006 1-2007 1-2008 1-2009 1-2010 1-2011 1-2012 1-2013 1-2014 1-2015 1-2016 1-2017 1-2018 1-2019 1-2020 1-2021
Single Family Condo/TIC/Coop
$1,952,993
$1,339,362
$2,004,340
$1,315,954
$2,315,670
$1,389,519
Single Family Condo/TIC/Coop
Year to Date
2019 2020 2021
+ 14.2%
+ 2.7%
+ 17.9%
+ 9.0% - 1.7%
+ 15.5%
+ 2.6% + 5.6%
2019 2020 2021 2019 2020 2021 2019 2020 2021
+ 4.8% + 3.2% + 2.9%
- 4.7%
Days on Market Until Sale
market was one for
the history books.
After three
Single
Family
Year-Over-Year
Change
Condo/TIC/
Coop
Year-Over-Year
Change
Jan-2021 37 +2.8% 70 +14.8%
Feb-2021 30 +20.0% 62 +121.4%
Mar-2021 23 +9.5% 45 +66.7%
Apr-2021 19 -5.0% 45 +40.6%
May-2021 18 -25.0% 36 -10.0%
Jun-2021 17 -34.6% 35 +2.9%
Jul-2021 18 -28.0% 40 +5.3%
Aug-2021 24 0.0% 40 0.0%
Sep-2021 22 -12.0% 37 -17.8%
Oct-2021 19 -29.6% 34 -17.1%
Nov-2021 20 -39.4% 40 -20.0%
Dec-2021 30 -14.3% 45 -27.4%
12-Month Avg* 22 -19.2% 43 -0.5%
Historical Days on Market Until Sale by Month
Average number of days between when a property is listed and when an offer is accepted in a given month.
* Days on Market for all properties from January 2021 through December 2021. This is not the
average of the individual figures above.
Current as of January 11, 2022. All data from the San Francisco Association of REALTORS® MLS. Report © 2021 ShowingTime. | 9
30
48
35
62
30
45
Single Family Condo/TIC/Coop
December
0
20
40
60
80
100
120
1-2005 1-2006 1-2007 1-2008 1-2009 1-2010 1-2011 1-2012 1-2013 1-2014 1-2015 1-2016 1-2017 1-2018 1-2019 1-2020 1-2021
Single Family Condo/TIC/Coop
26
36
27
43
22
43
Single Family Condo/TIC/Coop
Year to Date
2019 2020 2021
- 27.4%
+ 29.2%
- 14.3%
+ 16.7% + 19.4%
- 18.5%
+ 3.8% 0.0%
2019 2020 2021 2019 2020 2021 2019 2020 2021
- 6.3% + 13.0% + 12.5%
+ 6.7%
Inventory of Active Listings
market was one for
the history books.
After three
Single
Family
Year-Over-Year
Change
Condo/TIC/
Coop
Year-Over-Year
Change
Jan-2021 592 +20.8% 1,594 +83.4%
Feb-2021 626 +7.2% 1,583 +60.1%
Mar-2021 632 +14.7% 1,570 +57.6%
Apr-2021 665 +9.4% 1,506 +40.7%
May-2021 634 -7.8% 1,480 +10.4%
Jun-2021 631 -19.4% 1,457 -7.0%
Jul-2021 633 -26.5% 1,422 -26.2%
Aug-2021 662 -28.4% 1,422 -32.5%
Sep-2021 646 -30.5% 1,543 -33.4%
Oct-2021 573 -38.2% 1,434 -39.0%
Nov-2021 413 -47.9% 1,167 -44.2%
Dec-2021 227 -61.1% 729 -51.4%
12-Month Avg* 578 -20.5% 1,409 -11.6%
Historical Inventory of Active Listings by Month
The number of properties available for sale in active status at the end of a given month.
* Active Listings for all properties from January 2021 through December 2021. This is not the
average of the individual figures above.
Current as of January 11, 2022. All data from the San Francisco Association of REALTORS® MLS. Report © 2021 ShowingTime. | 10
393
716
584
1,501
227
729
Single Family Condo/TIC/Coop
December
0
500
1,000
1,500
2,000
2,500
1-2005 1-2006 1-2007 1-2008 1-2009 1-2010 1-2011 1-2012 1-2013 1-2014 1-2015 1-2016 1-2017 1-2018 1-2019 1-2020 1-2021
Single Family Condo/TIC/Coop
2019 2020 2021
- 51.4%
+ 109.6%
- 61.1%
+ 48.6%
2019 2020 2021
- 6.2% + 12.2%
% of Properties Sold Over List Price
market was one for
the history books.
After three
Single
Family
Year-Over-Year
Change
Condo/TIC/
Coop
Year-Over-Year
Change
Jan-2021 58.0% -7.3% 21.9% -32.6%
Feb-2021 68.1% -7.1% 35.3% -44.4%
Mar-2021 74.1% -5.2% 42.9% -28.7%
Apr-2021 76.1% +8.7% 45.0% -24.7%
May-2021 79.7% +26.1% 53.6% +27.3%
Jun-2021 82.5% +49.5% 54.4% +74.9%
Jul-2021 83.5% +29.1% 55.8% +25.7%
Aug-2021 84.0% +27.7% 54.6% +59.6%
Sep-2021 84.5% +30.0% 54.6% +58.7%
Oct-2021 84.5% +25.2% 61.0% +42.5%
Nov-2021 79.2% +28.6% 55.6% +69.5%
Dec-2021 79.4% +26.2% 46.9% +64.0%
12-Month Avg 78.9% +20.5% 49.3% +22.1%
Historical % of Properties Sold Over List Price by Month
Percentage found when dividing the number of properties sold by properties sold over its original list price, not accounting for seller
concessions.
* % of Properties Sold Over List Price for all properties from January 2021 through December
2021. This is not the average of the individual figures above.
Current as of January 11, 2022. All data from the San Francisco Association of REALTORS® MLS. Report © 2021 ShowingTime. | 11
68.3%
46.7%
62.9%
28.6%
79.4%
46.9%
Single Family Condo/TIC/Coop
December
0.0%
20.0%
40.0%
60.0%
80.0%
100.0%
1-2005 1-2006 1-2007 1-2008 1-2009 1-2010 1-2011 1-2012 1-2013 1-2014 1-2015 1-2016 1-2017 1-2018 1-2019 1-2020 1-2021
Single Family Condo/TIC/Coop
76.7%
58.9%
65.5%
40.4%
78.9%
49.3%
Single Family Condo/TIC/Coop
Year to Date
2019 2020 2021
+ 64.0%
- 38.8%
+ 26.2%
- 7.9% - 31.4%
+ 20.5%
- 14.6% + 22.0%
2019 2020 2021 2019 2020 2021 2019 2020 2021
+ 1.3% - 3.4% - 2.3%
+ 3.1%
% of List Price Received
market was one for
the history books.
After three
Single
Family
Year-Over-Year
Change
Condo/TIC/
Coop
Year-Over-Year
Change
Jan-2021 105.2% -1.7% 98.7% -1.7%
Feb-2021 109.7% -1.7% 100.7% -4.3%
Mar-2021 112.2% -1.7% 102.4% -1.6%
Apr-2021 113.8% +4.6% 103.7% -1.5%
May-2021 116.8% +10.4% 105.2% +4.8%
Jun-2021 116.3% +10.1% 105.3% +5.4%
Jul-2021 118.5% +11.8% 104.8% +3.8%
Aug-2021 116.0% +7.9% 104.3% +3.9%
Sep-2021 116.3% +8.9% 105.0% +4.8%
Oct-2021 117.0% +8.2% 105.5% +4.1%
Nov-2021 114.9% +8.4% 104.6% +4.4%
Dec-2021 114.6% +8.1% 103.6% +4.3%
12-Month Avg* 114.8% +6.7% 103.9% +2.7%
Historical % of List Price Received by Month
Percentage found when dividing a property’s sales price by its most recent list price, then taking the average for all properties sold in a given
month, not accounting for seller concessions.
* % of List Price Received for all properties from January 2021 through December 2021. This is
not the average of the individual figures above.
Current as of January 11, 2022. All data from the San Francisco Association of REALTORS® MLS. Report © 2021 ShowingTime. | 12
109.9%
103.0%
106.0%
99.3%
114.6%
103.6%
Single Family Condo/TIC/Coop
December
112.5%
105.3%
107.5%
101.2%
114.8%
103.9%
Single Family Condo/TIC/Coop
Year to Date
90.0%
100.0%
110.0%
120.0%
130.0%
1-2005 1-2006 1-2007 1-2008 1-2009 1-2010 1-2011 1-2012 1-2013 1-2014 1-2015 1-2016 1-2017 1-2018 1-2019 1-2020 1-2021
Single Family Condo/TIC/Coop
2019 2020 2021
+ 4.3%
- 3.6%
+ 8.1%
- 3.5%
2019 2020 2021
- 1.0% + 0.8%
2019 2020 2021
+ 2.7%
- 3.9%
+ 6.8%
- 4.4%
2019 2020 2021
- 2.8% - 0.8%
Housing Affordability Ratio
market was one for
the history books.
After three
Single
Family
Year-Over-Year
Change
Condo/TIC/
Coop
Year-Over-Year
Change
Jan-2021 36 -2.7% 63 +14.5%
Feb-2021 33 -2.9% 53 +3.9%
Mar-2021 32 -3.0% 52 +6.1%
Apr-2021 31 -8.8% 55 +7.8%
May-2021 30 -14.3% 54 -8.5%
Jun-2021 28 -12.5% 52 -3.7%
Jul-2021 30 -14.3% 55 +3.8%
Aug-2021 30 -14.3% 57 +1.8%
Sep-2021 32 -8.6% 55 -3.5%
Oct-2021 31 -13.9% 53 -10.2%
Nov-2021 30 -14.3% 53 -10.2%
Dec-2021 32 -13.5% 49 -21.0%
12-Month Avg* 31 -8.1% 35 -11.6%
Historical Housing Affordability Ratio by Month
This index measures housing affordability for the region. For example, an index of 120 means the median household income is 120% of what is
necessary to qualify for the median-priced home under prevailing interest rates. A higher number means greater affordability.
* Affordability Ratio for all properties from January 2021 through December 2021. This is not the
average of the individual figures above.
Current as of January 11, 2022. All data from the San Francisco Association of REALTORS® MLS. Report © 2021 ShowingTime. | 13
38
52
37
62
32
49
Single Family Condo/TIC/Coop
December
20
40
60
80
100
1-2005 1-2006 1-2007 1-2008 1-2009 1-2010 1-2011 1-2012 1-2013 1-2014 1-2015 1-2016 1-2017 1-2018 1-2019 1-2020 1-2021
Single Family Condo/TIC/Coop
2019 2020 2021
- 21.0%
+ 19.2%
- 13.5%
- 2.6%
2019 2020 2021
+ 15.2% + 6.1%
34
51
36
58
30
53
Single Family Condo/TIC/Coop
Year to Date
2019 2020 2021
- 8.6%
+ 13.7%
- 16.7%
+ 5.9%
2019 2020 2021
+ 6.3% + 6.3%
Months Supply of Inventory
market was one for
the history books.
After three
Single
Family
Year-Over-Year
Change
Condo/TIC/
Coop
Year-Over-Year
Change
Jan-2021 2.8 +16.7% 6.4 +82.9%
Feb-2021 2.8 -3.4% 6.1 +52.5%
Mar-2021 2.7 -3.6% 5.5 +31.0%
Apr-2021 2.7 -18.2% 4.7 -4.1%
May-2021 2.4 -38.5% 4.3 -35.8%
Jun-2021 2.4 -45.5% 4.1 -47.4%
Jul-2021 2.4 -48.9% 3.9 -58.9%
Aug-2021 2.5 -49.0% 3.9 -61.0%
Sep-2021 2.4 -50.0% 4.2 -60.4%
Oct-2021 2.2 -53.2% 3.8 -64.5%
Nov-2021 1.6 -59.0% 3.1 -66.7%
Dec-2021 0.9 -67.9% 2.0 -68.3%
12-Month Avg* 2.3 -38.7% 4.3 -40.9%
Historical Months Supply of Inventory by Month
The inventory of homes for sale at the end of a given month, divided by the average monthly pending sales from the last 12 months.
* Months Supply for all properties from January 2021 through December 2021. This is not the
average of the individual figures above.
Current as of January 11, 2022. All data from the San Francisco Association of REALTORS® MLS. Report © 2021 ShowingTime. | 14
1.9
3.0
2.8
6.3
0.9
2.0
Single Family Condo/TIC/Coop
December
0.0
2.0
4.0
6.0
8.0
10.0
12.0
1-2005 1-2006 1-2007 1-2008 1-2009 1-2010 1-2011 1-2012 1-2013 1-2014 1-2015 1-2016 1-2017 1-2018 1-2019 1-2020 1-2021
Single Family Condo/TIC/Coop
2019 2020 2021
- 68.3%
+ 110.0%
- 67.9%
+ 47.4%
2019 2020 2021
- 5.0% + 20.0%
All Properties Activity Overview
Key metrics by report month and for year-to-date (YTD) starting from the first of the year.
Key Metrics Historical Sparkbars 12-2020 12-2021 Percent Change YTD 2020 YTD 2021 Percent Change
Current as of January 11, 2022. All data from the San Francisco Association of REALTORS® MLS. Report © 2021 ShowingTime. | 15
Months Supply 4.7 1.6 - 66.0% -- -- --
Affordability Ratio 43 35 - 18.6%
% of List Price Received 102.4% 107.9% + 5.4% 104.1%
42
61.2% + 17.5%
+ 3.9%
36 - 14.3%
108.2%
% of Properties Sold Over List Price 44.1% 59.3% + 34.5% 52.1%
Active Listings 2,128 991 - 53.4% --
Avg. Sales Price $1,614,665 $1,821,113 + 12.8% $1,636,496
Days on Market 49 39 - 20.4% 36
$1,439,000 + 3.9%
+ 7.7%
34 - 5.6%
$1,763,286
-- --
Sold Listings 671 531 - 20.9% 5,357 7,619 + 42.2%
Median Sales Price $1,320,000 $1,450,000 + 9.8% $1,385,000
- 2.6%
Pending Sales 526 341 - 35.2% 5,483 7,583 + 38.3%
New Listings 397 169 - 57.4% 8,967 8,737
12-2018 12-2019 12-2020 12-2021
12-2018 12-2019 12-2020 12-2021
12-2018 12-2019 12-2020 12-2021
12-2018 12-2019 12-2020 12-2021
12-2018 12-2019 12-2020 12-2021
12-2018 12-2019 12-2020 12-2021
12-2018 12-2019 12-2020 12-2021
12-2018 12-2019 12-2020 12-2021
12-2018 12-2019 12-2020 12-2021
12-2018 12-2019 12-2020 12-2021
12-2018 12-2019 12-2020 12-2021
Activity by District
SF District 1: Northwest (Sea Cliff, Lake, Jordan Park / Laurel Heights, Outer Richmond, Central Ric The 2021
SF District 2: Central West (Outer Sunset, Central Sunset, Inner Sunset, Outer Parkside, Parkside, Inner Parkside, Golden Gate Heights)
SF District 3: Southwest (Pine Lake Park, Lake Shore, Merced Manor, Stonestown, Lakeside, Merced Heights, Ingleside, Ingleside Heights, Oceanview)
SF District 4: Twin Peaks W (Forest Hill (& Ext), W Portal, St Francis Wd, Balboa Terr, Mt Dav Manor, Ingleside Terr, Monterey Hts, Wstwd Pk & H'lnds, Shrwd Fst, Miraloma Pk, Dmnd Hts, Mdtwn Terr)
SF District 5: Central (Haight Ashbury, Cole Vly / Prnssus Hts, Clarndn Hts, Corona Hts, Twin Pks, Glen Pk, Noe Vly, Eureka Vly / Dolores Hts, Mission Dolores, Duboce Trngl, Buena Vista / Ashbury Hts)
SF District 6: Central North (Lower Pacific Heights, Anza Vista, Western Addition, North Panhandle, Alamo Square, Hayes Valley)
SF District 7: North (Marina, Cow Hollow, Presidio Heights, Pacific Heights)
SF District 8: Northeast (North Waterfront, North Beach, Russian Hill, Telegraph Hill, Nob Hill, Financial District / Barbary Coast, Downtown, Van Ness / Civic Center, Tenderloin)
SF District 9: Central East (Yerba Buena, South Beach, South of Market, Mission Bay, Inner Mission, Potrero Hill, Central Waterfront / Dogpatch, Bernal Heights)
SF District 10: Southeast (Outer Mission, Mission Terr, Excelsior, Portola, Bayview, Silver Terr, Hunters Pt, Candlestick Pt, Bayview Hts, Little Hollywood, Visitation Vly, Crocker Amazon)
12-2020 12-2021 + / – 12-2020 12-2021 + / – 12-2020 12-2021 + / – 12-2020 12-2021 + / – 12-2020 12-2021 + / –
Single Family
1 SF District 1 42 19 -54.8% 23 16 -30.4% $2,000,000 $2,874,500 +43.7% 58 19 -67.2% 2.1 1.0 -52.4%
2 SF District 2 40 20 -50.0% 50 43 -14.0% $1,534,500 $1,625,000 +5.9% 27 21 -22.2% 1.1 0.4 -63.6%
3 SF District 3 25 14 -44.0% 20 17 -15.0% $1,227,500 $1,425,000 +16.1% 33 25 -24.2% 1.8 0.8 -55.6%
4 SF District 4 52 18 -65.4% 37 36 -2.7% $1,700,000 $1,875,000 +10.3% 28 29 +3.6% 1.8 0.5 -72.2%
5 SF District 5 120 36 -70.0% 46 25 -45.7% $2,200,000 $2,900,000 +31.8% 38 24 -36.8% 3.8 0.9 -76.3%
6 SF District 6 17 10 -41.2% 7 2 -71.4% $2,250,000 $2,485,000 +10.4% 23 22 -4.3% 3.4 2.0 -41.2%
7 SF District 7 55 21 -61.8% 20 12 -40.0% $5,647,500 $4,500,000 -20.3% 70 78 +11.4% 7.3 1.6 -78.1%
8 SF District 8 17 16 -5.9% 1 1 0.0% $2,520,000 $8,825,000 +250.2% 137 268 +95.6% 7.7 5.3 -31.2%
9 SF District 9 94 27 -71.3% 38 21 -44.7% $1,517,625 $1,450,000 -4.5% 26 34 +30.8% 3.9 0.9 -76.9%
10 SF District 10 122 46 -62.3% 60 36 -40.0% $1,100,000 $1,243,500 +13.0% 29 27 -6.9% 2.9 1.0 -65.5%
Condo/TIC/Coop
1 SF District 1 63 20 -68.3% 19 21 +10.5% $1,160,000 $1,410,000 +21.6% 46 26 -43.5% 4.3 1.1 -74.4%
2 SF District 2 17 10 -41.2% 6 3 -50.0% $972,500 $1,395,000 +43.4% 43 32 -25.6% 3.3 1.8 -45.5%
3 SF District 3 11 4 -63.6% 3 5 +66.7% $738,000 $830,000 +12.5% 27 50 +85.2% 4.0 1.0 -75.0%
4 SF District 4 17 11 -35.3% 5 6 +20.0% $700,000 $986,000 +40.9% 61 55 -9.8% 3.6 2.3 -36.1%
5 SF District 5 162 50 -69.1% 60 54 -10.0% $1,344,444 $1,480,000 +10.1% 48 36 -25.0% 3.9 0.9 -76.9%
6 SF District 6 114 65 -43.0% 43 36 -16.3% $985,000 $1,417,500 +43.9% 60 30 -50.0% 4.1 1.6 -61.0%
7 SF District 7 148 47 -68.2% 37 32 -13.5% $1,500,000 $1,624,500 +8.3% 65 43 -33.8% 5.8 1.1 -81.0%
8 SF District 8 291 160 -45.0% 51 56 +9.8% $885,000 $1,075,000 +21.5% 70 71 +1.4% 7.9 2.5 -68.4%
9 SF District 9 639 327 -48.8% 124 100 -19.4% $1,050,000 $1,158,500 +10.3% 68 46 -32.4% 8.5 2.6 -69.4%
10 SF District 10 39 35 -10.3% 5 5 0.0% $515,000 $710,000 +37.9% 74 18 -75.7% 7.2 4.1 -43.1%
Key metrics by report month for the districts of San Fransisco.
Current as of January 11, 2022. All data from the San Francisco Association of REALTORS® MLS. Report © 2021 ShowingTime. | 16
Active Listings Sold Listings Median Sales Price Days on Market Months Supply

More Related Content

What's hot

What's hot (18)

San Francisco Market Report May 2021
San Francisco Market Report May 2021San Francisco Market Report May 2021
San Francisco Market Report May 2021
 
San Francisco Market Report April 2021
San Francisco Market Report April 2021San Francisco Market Report April 2021
San Francisco Market Report April 2021
 
San Francisco market focus report December 2019
San Francisco market focus report December 2019San Francisco market focus report December 2019
San Francisco market focus report December 2019
 
San Francisco Market Report March 2021
San Francisco Market Report March 2021San Francisco Market Report March 2021
San Francisco Market Report March 2021
 
Gbar monthly-market-insight-report-jan20
Gbar monthly-market-insight-report-jan20Gbar monthly-market-insight-report-jan20
Gbar monthly-market-insight-report-jan20
 
San Francisco Market Focus December 2013
San Francisco Market Focus December 2013San Francisco Market Focus December 2013
San Francisco Market Focus December 2013
 
San Francisco Market Focus Report Nov 2020
San Francisco Market Focus Report Nov 2020San Francisco Market Focus Report Nov 2020
San Francisco Market Focus Report Nov 2020
 
San Francisco Market Focus February 2014
San Francisco Market Focus February 2014San Francisco Market Focus February 2014
San Francisco Market Focus February 2014
 
San francisco residential apr 2011 apr 2013
San francisco residential apr 2011   apr 2013San francisco residential apr 2011   apr 2013
San francisco residential apr 2011 apr 2013
 
FVREB Statistics Package March 2022
FVREB Statistics Package March 2022FVREB Statistics Package March 2022
FVREB Statistics Package March 2022
 
Gbar monthly-market-insights-report-november20
Gbar monthly-market-insights-report-november20Gbar monthly-market-insights-report-november20
Gbar monthly-market-insights-report-november20
 
San Francisco Market Data October 2020
San Francisco Market Data October 2020San Francisco Market Data October 2020
San Francisco Market Data October 2020
 
2013 Annual Historical Data
2013 Annual Historical Data2013 Annual Historical Data
2013 Annual Historical Data
 
San Francisco Market Report January 2021
San Francisco Market Report January 2021San Francisco Market Report January 2021
San Francisco Market Report January 2021
 
San Francisco Market Report December 2020
San Francisco Market Report December 2020San Francisco Market Report December 2020
San Francisco Market Report December 2020
 
Victoria Real Estate Board Statistics Package January 2022
Victoria Real Estate Board Statistics Package January 2022Victoria Real Estate Board Statistics Package January 2022
Victoria Real Estate Board Statistics Package January 2022
 
Real Estate Board of Greater Vancouver Statistics Package February 2022
Real Estate Board of Greater Vancouver Statistics Package February 2022Real Estate Board of Greater Vancouver Statistics Package February 2022
Real Estate Board of Greater Vancouver Statistics Package February 2022
 
San Francisco Market Focus Report Aug 2018
San Francisco Market Focus Report Aug 2018San Francisco Market Focus Report Aug 2018
San Francisco Market Focus Report Aug 2018
 

Similar to San Francisco Market Report December 2021

Similar to San Francisco Market Report December 2021 (20)

San Francisco Market Report February 2022
San Francisco Market Report February 2022San Francisco Market Report February 2022
San Francisco Market Report February 2022
 
San Francisco Market Report April 2022.pdf
San Francisco Market Report April 2022.pdfSan Francisco Market Report April 2022.pdf
San Francisco Market Report April 2022.pdf
 
San Francisco Market Report June 2022.pdf
San Francisco Market Report June 2022.pdfSan Francisco Market Report June 2022.pdf
San Francisco Market Report June 2022.pdf
 
San Francisco Market Report May 2022.
San Francisco Market Report May 2022.San Francisco Market Report May 2022.
San Francisco Market Report May 2022.
 
San Francisco Market Report March 2022
San Francisco Market Report March 2022San Francisco Market Report March 2022
San Francisco Market Report March 2022
 
San Francisco Market Report July 2022.pdf
San Francisco Market Report July 2022.pdfSan Francisco Market Report July 2022.pdf
San Francisco Market Report July 2022.pdf
 
San Francisco Market Report October 2022.pdf
San Francisco Market Report October 2022.pdfSan Francisco Market Report October 2022.pdf
San Francisco Market Report October 2022.pdf
 
San Francisco Market Report December 2022.pdf
San Francisco Market Report December 2022.pdfSan Francisco Market Report December 2022.pdf
San Francisco Market Report December 2022.pdf
 
San Francisco Market Report November 2022.pdf
San Francisco Market Report November 2022.pdfSan Francisco Market Report November 2022.pdf
San Francisco Market Report November 2022.pdf
 
San Francisco Market Report August 2022.pdf
San Francisco Market Report August 2022.pdfSan Francisco Market Report August 2022.pdf
San Francisco Market Report August 2022.pdf
 
San Francisco December 2023 Market Report
San Francisco December 2023 Market ReportSan Francisco December 2023 Market Report
San Francisco December 2023 Market Report
 
San Francisco Market Report September 2022.pdf
San Francisco Market Report September 2022.pdfSan Francisco Market Report September 2022.pdf
San Francisco Market Report September 2022.pdf
 
San Francisco Market Report January 2023.pdf
San Francisco Market Report January 2023.pdfSan Francisco Market Report January 2023.pdf
San Francisco Market Report January 2023.pdf
 
San Francisco Market Report February 2023
San Francisco Market Report February 2023San Francisco Market Report February 2023
San Francisco Market Report February 2023
 
San Francisco January 2024 Market Report
San Francisco January 2024 Market ReportSan Francisco January 2024 Market Report
San Francisco January 2024 Market Report
 
San Francisco Market Report March 2023.pdf
San Francisco Market Report March 2023.pdfSan Francisco Market Report March 2023.pdf
San Francisco Market Report March 2023.pdf
 
San Francisco June 2023 Market Report.pdf
San Francisco June 2023 Market Report.pdfSan Francisco June 2023 Market Report.pdf
San Francisco June 2023 Market Report.pdf
 
San Francisco May 2023 Market Report.pdf
San Francisco May 2023 Market Report.pdfSan Francisco May 2023 Market Report.pdf
San Francisco May 2023 Market Report.pdf
 
October 2023 Report: San Francisco Real Estate Market Insights
October 2023 Report: San Francisco Real Estate Market InsightsOctober 2023 Report: San Francisco Real Estate Market Insights
October 2023 Report: San Francisco Real Estate Market Insights
 
San Francisco November 2023 Market Report
San Francisco November 2023 Market ReportSan Francisco November 2023 Market Report
San Francisco November 2023 Market Report
 

More from Ronny Budiutama (6)

San Francisco Market Update -February 2024
San Francisco Market Update -February 2024San Francisco Market Update -February 2024
San Francisco Market Update -February 2024
 
San Francisco Market Update - March 2024
San Francisco Market Update - March 2024San Francisco Market Update - March 2024
San Francisco Market Update - March 2024
 
2023 Annual San Francisco Housing Market
2023 Annual San Francisco Housing Market2023 Annual San Francisco Housing Market
2023 Annual San Francisco Housing Market
 
CA Weekly MLS Market Data Report - August 2023
CA Weekly MLS Market Data Report - August 2023CA Weekly MLS Market Data Report - August 2023
CA Weekly MLS Market Data Report - August 2023
 
San Francisco Market Report July 2023.pdf
San Francisco Market Report July 2023.pdfSan Francisco Market Report July 2023.pdf
San Francisco Market Report July 2023.pdf
 
Annual Report on the San Francisco County Housing Market.pdf
Annual Report on the San Francisco County Housing Market.pdfAnnual Report on the San Francisco County Housing Market.pdf
Annual Report on the San Francisco County Housing Market.pdf
 

Recently uploaded

Listing Turkey - 2024 - May Featured Portfolio
Listing Turkey - 2024 - May Featured PortfolioListing Turkey - 2024 - May Featured Portfolio
Listing Turkey - 2024 - May Featured Portfolio
Listing Turkey
 
Call girls in Shakti Nagar Delhi~8447779280°/=@/ Short 1500 Night 6000}ESCORT...
Call girls in Shakti Nagar Delhi~8447779280°/=@/ Short 1500 Night 6000}ESCORT...Call girls in Shakti Nagar Delhi~8447779280°/=@/ Short 1500 Night 6000}ESCORT...
Call girls in Shakti Nagar Delhi~8447779280°/=@/ Short 1500 Night 6000}ESCORT...
asmaqueen5
 
Call Girls in Maurice Nagar (Delhi) ꧁8447779280꧂ Female Escorts Service in De...
Call Girls in Maurice Nagar (Delhi) ꧁8447779280꧂ Female Escorts Service in De...Call Girls in Maurice Nagar (Delhi) ꧁8447779280꧂ Female Escorts Service in De...
Call Girls in Maurice Nagar (Delhi) ꧁8447779280꧂ Female Escorts Service in De...
asmaqueen5
 
BPTP THE AMAARIO For The Royals Of Tomorrow in Sector 37D Gurgaon Dwarka Expr...
BPTP THE AMAARIO For The Royals Of Tomorrow in Sector 37D Gurgaon Dwarka Expr...BPTP THE AMAARIO For The Royals Of Tomorrow in Sector 37D Gurgaon Dwarka Expr...
BPTP THE AMAARIO For The Royals Of Tomorrow in Sector 37D Gurgaon Dwarka Expr...
ApartmentWala1
 
Low Rate ✨➥9711108085▻✨Call Girls In East Of Kailash (E.K) (Delhi)
Low Rate ✨➥9711108085▻✨Call Girls In East Of Kailash (E.K) (Delhi)Low Rate ✨➥9711108085▻✨Call Girls In East Of Kailash (E.K) (Delhi)
Low Rate ✨➥9711108085▻✨Call Girls In East Of Kailash (E.K) (Delhi)
delhi24hrs1
 
Low Rate ✨➥9711108085▻✨Call Girls In Majnu Ka Tilla (Mt) (Delhi)
Low Rate ✨➥9711108085▻✨Call Girls In Majnu Ka Tilla (Mt) (Delhi)Low Rate ✨➥9711108085▻✨Call Girls In Majnu Ka Tilla (Mt) (Delhi)
Low Rate ✨➥9711108085▻✨Call Girls In Majnu Ka Tilla (Mt) (Delhi)
delhi24hrs1
 
Low Rate Call girls in Sant Nagar{Delhi }8447779280} Service Escorts In South...
Low Rate Call girls in Sant Nagar{Delhi }8447779280} Service Escorts In South...Low Rate Call girls in Sant Nagar{Delhi }8447779280} Service Escorts In South...
Low Rate Call girls in Sant Nagar{Delhi }8447779280} Service Escorts In South...
asmaqueen5
 
Bptp The Amaario Launch Luxury Project Sector 37D Gurgaon Dwarka Expressway...
Bptp The Amaario Launch  Luxury Project  Sector 37D Gurgaon Dwarka Expressway...Bptp The Amaario Launch  Luxury Project  Sector 37D Gurgaon Dwarka Expressway...
Bptp The Amaario Launch Luxury Project Sector 37D Gurgaon Dwarka Expressway...
ApartmentWala1
 
Acibadem Konaklari Uskudar - Listin Turkey
Acibadem Konaklari Uskudar - Listin TurkeyAcibadem Konaklari Uskudar - Listin Turkey
Acibadem Konaklari Uskudar - Listin Turkey
Listing Turkey
 
Escort—>Call GiRls In Mori Gate Delhi —>8447779280—Service Escorts In South D...
Escort—>Call GiRls In Mori Gate Delhi —>8447779280—Service Escorts In South D...Escort—>Call GiRls In Mori Gate Delhi —>8447779280—Service Escorts In South D...
Escort—>Call GiRls In Mori Gate Delhi —>8447779280—Service Escorts In South D...
asmaqueen5
 
BPTP THE AMAARIO Luxury Project Invest Like Royalty in Sector 37D Gurgaon Dwa...
BPTP THE AMAARIO Luxury Project Invest Like Royalty in Sector 37D Gurgaon Dwa...BPTP THE AMAARIO Luxury Project Invest Like Royalty in Sector 37D Gurgaon Dwa...
BPTP THE AMAARIO Luxury Project Invest Like Royalty in Sector 37D Gurgaon Dwa...
ApartmentWala1
 

Recently uploaded (20)

Vanam At Purva Soukhyam Guduvanchery.pdf.pdf
Vanam At Purva Soukhyam Guduvanchery.pdf.pdfVanam At Purva Soukhyam Guduvanchery.pdf.pdf
Vanam At Purva Soukhyam Guduvanchery.pdf.pdf
 
Listing Turkey - 2024 - May Featured Portfolio
Listing Turkey - 2024 - May Featured PortfolioListing Turkey - 2024 - May Featured Portfolio
Listing Turkey - 2024 - May Featured Portfolio
 
Call girls in Shakti Nagar Delhi~8447779280°/=@/ Short 1500 Night 6000}ESCORT...
Call girls in Shakti Nagar Delhi~8447779280°/=@/ Short 1500 Night 6000}ESCORT...Call girls in Shakti Nagar Delhi~8447779280°/=@/ Short 1500 Night 6000}ESCORT...
Call girls in Shakti Nagar Delhi~8447779280°/=@/ Short 1500 Night 6000}ESCORT...
 
Call Girls in Maurice Nagar (Delhi) ꧁8447779280꧂ Female Escorts Service in De...
Call Girls in Maurice Nagar (Delhi) ꧁8447779280꧂ Female Escorts Service in De...Call Girls in Maurice Nagar (Delhi) ꧁8447779280꧂ Female Escorts Service in De...
Call Girls in Maurice Nagar (Delhi) ꧁8447779280꧂ Female Escorts Service in De...
 
BPTP THE AMAARIO For The Royals Of Tomorrow in Sector 37D Gurgaon Dwarka Expr...
BPTP THE AMAARIO For The Royals Of Tomorrow in Sector 37D Gurgaon Dwarka Expr...BPTP THE AMAARIO For The Royals Of Tomorrow in Sector 37D Gurgaon Dwarka Expr...
BPTP THE AMAARIO For The Royals Of Tomorrow in Sector 37D Gurgaon Dwarka Expr...
 
Low Rate ✨➥9711108085▻✨Call Girls In East Of Kailash (E.K) (Delhi)
Low Rate ✨➥9711108085▻✨Call Girls In East Of Kailash (E.K) (Delhi)Low Rate ✨➥9711108085▻✨Call Girls In East Of Kailash (E.K) (Delhi)
Low Rate ✨➥9711108085▻✨Call Girls In East Of Kailash (E.K) (Delhi)
 
Low Rate ✨➥9711108085▻✨Call Girls In Majnu Ka Tilla (Mt) (Delhi)
Low Rate ✨➥9711108085▻✨Call Girls In Majnu Ka Tilla (Mt) (Delhi)Low Rate ✨➥9711108085▻✨Call Girls In Majnu Ka Tilla (Mt) (Delhi)
Low Rate ✨➥9711108085▻✨Call Girls In Majnu Ka Tilla (Mt) (Delhi)
 
Bridge & Elliot Ladner Floor Plans May 2024.pdf
Bridge & Elliot Ladner Floor Plans May 2024.pdfBridge & Elliot Ladner Floor Plans May 2024.pdf
Bridge & Elliot Ladner Floor Plans May 2024.pdf
 
Parksville 96 Surrey Floor Plans May 2024
Parksville 96 Surrey Floor Plans May 2024Parksville 96 Surrey Floor Plans May 2024
Parksville 96 Surrey Floor Plans May 2024
 
Explore Dual Citizenship in Africa | Citizenship Benefits & Requirements
Explore Dual Citizenship in Africa | Citizenship Benefits & RequirementsExplore Dual Citizenship in Africa | Citizenship Benefits & Requirements
Explore Dual Citizenship in Africa | Citizenship Benefits & Requirements
 
Low Rate Call girls in Sant Nagar{Delhi }8447779280} Service Escorts In South...
Low Rate Call girls in Sant Nagar{Delhi }8447779280} Service Escorts In South...Low Rate Call girls in Sant Nagar{Delhi }8447779280} Service Escorts In South...
Low Rate Call girls in Sant Nagar{Delhi }8447779280} Service Escorts In South...
 
Bptp The Amaario Launch Luxury Project Sector 37D Gurgaon Dwarka Expressway...
Bptp The Amaario Launch  Luxury Project  Sector 37D Gurgaon Dwarka Expressway...Bptp The Amaario Launch  Luxury Project  Sector 37D Gurgaon Dwarka Expressway...
Bptp The Amaario Launch Luxury Project Sector 37D Gurgaon Dwarka Expressway...
 
Acibadem Konaklari Uskudar - Listin Turkey
Acibadem Konaklari Uskudar - Listin TurkeyAcibadem Konaklari Uskudar - Listin Turkey
Acibadem Konaklari Uskudar - Listin Turkey
 
Prestige Sancoale Goa Residneces Brochure.pdf
Prestige Sancoale Goa Residneces Brochure.pdfPrestige Sancoale Goa Residneces Brochure.pdf
Prestige Sancoale Goa Residneces Brochure.pdf
 
Escort—>Call GiRls In Mori Gate Delhi —>8447779280—Service Escorts In South D...
Escort—>Call GiRls In Mori Gate Delhi —>8447779280—Service Escorts In South D...Escort—>Call GiRls In Mori Gate Delhi —>8447779280—Service Escorts In South D...
Escort—>Call GiRls In Mori Gate Delhi —>8447779280—Service Escorts In South D...
 
construction material procurement in India
construction material procurement in Indiaconstruction material procurement in India
construction material procurement in India
 
Retail Space for Lease - 1221 W. Main St., Sun Prairie, WI
Retail Space for Lease - 1221 W. Main St., Sun Prairie, WIRetail Space for Lease - 1221 W. Main St., Sun Prairie, WI
Retail Space for Lease - 1221 W. Main St., Sun Prairie, WI
 
Jaipur Escorts 🥰 8617370543 Call Girls Offer VIP Hot Girls
Jaipur Escorts 🥰 8617370543 Call Girls Offer VIP Hot GirlsJaipur Escorts 🥰 8617370543 Call Girls Offer VIP Hot Girls
Jaipur Escorts 🥰 8617370543 Call Girls Offer VIP Hot Girls
 
BPTP THE AMAARIO Luxury Project Invest Like Royalty in Sector 37D Gurgaon Dwa...
BPTP THE AMAARIO Luxury Project Invest Like Royalty in Sector 37D Gurgaon Dwa...BPTP THE AMAARIO Luxury Project Invest Like Royalty in Sector 37D Gurgaon Dwa...
BPTP THE AMAARIO Luxury Project Invest Like Royalty in Sector 37D Gurgaon Dwa...
 
Real Estate Finance and Investments (2019).pdf
Real Estate Finance and Investments (2019).pdfReal Estate Finance and Investments (2019).pdf
Real Estate Finance and Investments (2019).pdf
 

San Francisco Market Report December 2021

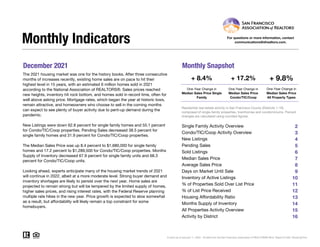
  • 1. December 2021 Monthly Snapshot One-Year Change in One-Year Change in Median Sales Price Single Family Median Sales Price Condo/TIC/Coop 2 3 4 5 6 7 8 9 10 11 12 13 14 15 16 Monthly Indicators + 8.4% + 17.2% + 9.8% One-Year Change in The 2021 housing market was one for the history books. After three consecutive months of increases recently, existing home sales are on pace to hit their highest level in 15 years, with an estimated 6 million homes sold in 2021 according to the National Association of REALTORS®. Sales prices reached new heights, inventory hit rock bottom, and homes sold in record time, often for well above asking price. Mortgage rates, which began the year at historic lows, remain attractive, and homeowners who choose to sell in the coming months can expect to see plenty of buyer activity due to pent-up demand during the pandemic. New Listings were down 62.8 percent for single family homes and 55.1 percent for Condo/TIC/Coop properties. Pending Sales decreased 38.5 percent for single family homes and 31.9 percent for Condo/TIC/Coop properties. The Median Sales Price was up 8.4 percent to $1,680,000 for single family homes and 17.2 percent to $1,289,500 for Condo/TIC/Coop properties. Months Supply of Inventory decreased 67.9 percent for single family units and 68.3 percent for Condo/TIC/Coop units. Looking ahead, experts anticipate many of the housing market trends of 2021 will continue in 2022, albeit at a more moderate level. Strong buyer demand and inventory shortages are likely to persist over the next year. Home sales are projected to remain strong but will be tempered by the limited supply of homes, higher sales prices, and rising interest rates, with the Federal Reserve planning multiple rate hikes in the new year. Price growth is expected to slow somewhat as a result, but affordability will likely remain a top constraint for some homebuyers. Median Sales Price All Property Types Residential real estate activity in San Francisco County (Districts 1-10) composed of single-family properties, townhomes and condominiums. Percent changes are calculated using rounded figures. Single Family Activity Overview Months Supply of Inventory For questions or more information, contact communications@sfrealtors.com. Current as of January 11, 2022. All data from the San Francisco Association of REALTORS® MLS. Report © 2021 ShowingTime. Condo/TIC/Coop Activity Overview Inventory of Active Listings % of Properties Sold Over List Price % of List Price Received Housing Affordability Ratio All Properties Activity Overview New Listings Pending Sales Sold Listings Median Sales Price Average Sales Price Days on Market Until Sale Activity by District
  • 2. Single Family Activity Overview Key metrics by report month and for year-to-date (YTD) starting from the first of the year. Key Metrics Historical Sparkbars 12-2020 12-2021 Percent Change YTD 2020 YTD 2021 Percent Change Current as of January 11, 2022. All data from the San Francisco Association of REALTORS® MLS. Report © 2021 ShowingTime. | 2 Months Supply 2.8 0.9 - 67.9% -- -- -- Affordability Ratio 37 32 - 13.5% % of List Price Received 106.0% 114.6% + 8.1% 107.5% 36 78.9% + 20.5% + 6.8% 30 - 16.7% 114.8% % of Properties Sold Over List Price 62.9% 79.4% + 26.2% 65.5% Active Listings 584 227 - 61.1% -- Avg. Sales Price $2,013,136 $2,373,631 + 17.9% $2,004,340 Days on Market 35 30 - 14.3% 27 22 - 18.5% $2,315,670 -- -- Median Sales Price $1,550,000 $1,680,000 + 8.4% $1,608,888 Sold Listings 302 209 - 30.8% 2,463 New Listings 148 55 - 62.8% 3,393 Pending Sales 208 128 - 38.5% + 20.1% 2,524 3,032 - 3.1% 3,287 3,043 + 23.5% $1,800,000 + 11.9% + 15.5% 12-2018 12-2019 12-2020 12-2021 12-2018 12-2019 12-2020 12-2021 12-2018 12-2019 12-2020 12-2021 12-2018 12-2019 12-2020 12-2021 12-2018 12-2019 12-2020 12-2021 12-2018 12-2019 12-2020 12-2021 12-2018 12-2019 12-2020 12-2021 12-2018 12-2019 12-2020 12-2021 12-2018 12-2019 12-2020 12-2021 12-2018 12-2019 12-2020 12-2021 12-2018 12-2019 12-2020 12-2021
  • 3. Condo/TIC/Coop Activity Overview Key metrics by report month and for year-to-date (YTD) starting from the first of the year. Key Metrics Historical Sparkbars 12-2020 12-2021 Percent Change YTD 2020 YTD 2021 Percent Change Current as of January 11, 2022. All data from the San Francisco Association of REALTORS® MLS. Report © 2021 ShowingTime. | 3 Months Supply 6.3 2.0 - 68.3% -- -- -- Affordability Ratio 62 49 - 21.0% % of List Price Received 99.3% 103.6% + 4.3% 101.2% 58 49.3% + 22.0% + 2.7% 53 - 8.6% 103.9% % of Properties Sold Over List Price 28.6% 46.9% + 64.0% 40.4% Active Listings 1,501 729 - 51.4% -- Avg. Sales Price $1,281,834 $1,463,982 + 14.2% $1,315,954 Days on Market 62 45 - 27.4% 43 $1,210,000 + 1.7% + 5.6% 43 0.0% $1,389,519 -- -- Sold Listings 353 318 - 9.9% 2,788 4,489 + 61.0% Median Sales Price $1,100,000 $1,289,500 + 17.2% $1,190,000 - 1.6% Pending Sales 307 209 - 31.9% 2,850 4,464 + 56.6% New Listings 247 111 - 55.1% 5,394 5,309 12-2018 12-2019 12-2020 12-2021 12-2018 12-2019 12-2020 12-2021 12-2018 12-2019 12-2020 12-2021 12-2018 12-2019 12-2020 12-2021 12-2018 12-2019 12-2020 12-2021 12-2018 12-2019 12-2020 12-2021 12-2018 12-2019 12-2020 12-2021 12-2018 12-2019 12-2020 12-2021 12-2018 12-2019 12-2020 12-2021 12-2018 12-2019 12-2020 12-2021 12-2018 12-2019 12-2020 12-2021
  • 4. New Listings market was one for the history books. After three Single Family Year-Over-Year Change Condo/TIC/ Coop Year-Over-Year Change Jan-2021 257 -0.8% 528 +38.6% Feb-2021 306 +12.5% 501 +23.4% Mar-2021 345 +98.3% 615 +141.2% Apr-2021 351 +99.4% 511 +122.2% May-2021 313 +13.8% 524 +4.0% Jun-2021 323 -10.0% 490 -15.4% Jul-2021 299 -26.7% 421 -39.7% Aug-2021 298 -15.8% 424 -35.0% Sep-2021 364 +2.5% 566 -15.0% Oct-2021 245 -34.0% 415 -20.3% Nov-2021 131 -45.9% 203 -20.4% Dec-2021 55 -62.8% 111 -55.1% 12-Month Avg 274 -3.1% 442 -1.6% Historical New Listings by Month Current as of January 11, 2022. All data from the San Francisco Association of REALTORS® MLS. Report © 2021 ShowingTime. | 4 A count of the properties that have been newly listed on the market in a given month. 95 131 148 247 55 111 Single Family Condo/TIC/Coop December 0 200 400 600 800 1-2005 1-2006 1-2007 1-2008 1-2009 1-2010 1-2011 1-2012 1-2013 1-2014 1-2015 1-2016 1-2017 1-2018 1-2019 1-2020 1-2021 Single Family Condo/TIC/Coop 2,976 3,951 3,393 5,394 3,287 5,309 Single Family Condo/TIC/Coop Year to Date 2019 2020 2021 - 55.1% + 88.5% - 62.8% + 55.8% + 36.5% - 3.1% + 14.0% - 1.6% 2019 2020 2021 2019 2020 2021 2019 2020 2021 - 5.0% - 6.0% + 0.6% + 13.9%
  • 5. Pending Sales market was one for the history books. After three Single Family Year-Over-Year Change Condo/TIC/ Coop Year-Over-Year Change Jan-2021 170 +44.1% 292 +81.4% Feb-2021 225 +52.0% 381 +67.8% Mar-2021 290 +68.6% 473 +157.1% Apr-2021 286 +262.0% 478 +419.6% May-2021 307 +89.5% 462 +225.4% Jun-2021 275 +21.1% 391 +67.1% Jul-2021 260 -5.8% 364 +50.4% Aug-2021 226 -3.8% 316 -1.9% Sep-2021 333 +18.5% 337 +10.1% Oct-2021 274 -11.9% 404 +21.3% Nov-2021 258 -16.0% 357 +19.0% Dec-2021 128 -38.5% 209 -31.9% 12-Month Avg 253 +20.1% 372 +56.6% Historical Pending Sales by Month A count of the properties on which offers have been accepted in a given month. Current as of January 11, 2022. All data from the San Francisco Association of REALTORS® MLS. Report © 2021 ShowingTime. | 5 133 153 208 307 128 209 Single Family Condo/TIC/Coop December 0 100 200 300 400 500 1-2005 1-2006 1-2007 1-2008 1-2009 1-2010 1-2011 1-2012 1-2013 1-2014 1-2015 1-2016 1-2017 1-2018 1-2019 1-2020 1-2021 Single Family Condo/TIC/Coop 2,445 2,907 2,524 2,850 3,032 4,464 Single Family Condo/TIC/Coop Year to Date 2019 2020 2021 - 31.9% + 100.7% - 38.5% + 56.4% - 2.0% + 20.1% + 3.2% + 56.6% 2019 2020 2021 2019 2020 2021 2019 2020 2021 - 2.2% - 2.5% - 3.5% + 2.0%
  • 6. Sold Listings market was one for the history books. After three Single Family Year-Over-Year Change Condo/TIC/ Coop Year-Over-Year Change Jan-2021 162 +48.6% 270 +78.8% Feb-2021 163 +24.4% 278 +56.2% Mar-2021 270 +50.8% 457 +93.6% Apr-2021 289 +140.8% 462 +294.9% May-2021 266 +133.3% 442 +287.7% Jun-2021 325 +79.6% 471 +166.1% Jul-2021 255 +7.1% 371 +39.5% Aug-2021 257 +5.8% 348 +45.0% Sep-2021 245 -4.7% 291 -9.9% Oct-2021 309 +1.3% 362 +24.0% Nov-2021 293 +3.2% 419 +22.9% Dec-2021 209 -30.8% 318 -9.9% 12-Month Avg 254 +23.5% 374 +61.0% Historical Sold Listings by Month A count of the actual sales that closed in a given month. Current as of January 11, 2022. All data from the San Francisco Association of REALTORS® MLS. Report © 2021 ShowingTime. | 6 210 229 302 353 209 318 Single Family Condo/TIC/Coop December 0 100 200 300 400 500 1-2005 1-2006 1-2007 1-2008 1-2009 1-2010 1-2011 1-2012 1-2013 1-2014 1-2015 1-2016 1-2017 1-2018 1-2019 1-2020 1-2021 Single Family Condo/TIC/Coop 2,441 2,889 2,463 2,788 3,043 4,489 Single Family Condo/TIC/Coop Year to Date 2019 2020 2021 - 9.9% + 54.1% - 30.8% + 43.8% - 3.5% + 23.5% + 0.9% + 61.0% 2019 2020 2021 2019 2020 2021 2019 2020 2021 + 22.1% - 2.7% - 5.3% + 13.9%
  • 7. Median Sales Price market was one for the history books. After three Single Family Year-Over-Year Change Condo/TIC/ Coop Year-Over-Year Change Jan-2021 $1,587,500 +8.7% $1,072,500 -7.2% Feb-2021 $1,650,000 +2.5% $1,196,500 -5.0% Mar-2021 $1,725,000 +9.5% $1,221,184 -2.3% Apr-2021 $1,800,000 +12.1% $1,200,000 -5.9% May-2021 $1,886,500 +18.8% $1,225,000 +12.6% Jun-2021 $1,950,000 +12.7% $1,250,000 +2.0% Jul-2021 $1,850,000 +15.3% $1,208,000 -4.2% Aug-2021 $1,850,000 +13.8% $1,150,000 -5.0% Sep-2021 $1,750,000 +6.1% $1,200,000 +2.1% Oct-2021 $1,810,000 +12.8% $1,247,000 +8.2% Nov-2021 $1,900,000 +16.0% $1,270,000 +8.4% Dec-2021 $1,680,000 +8.4% $1,289,500 +17.2% 12-Month Avg* $1,800,000 +11.9% $1,210,000 +1.7% Historical Median Sales Price by Month Point at which half of the sales sold for more and half sold for less, not accounting for seller concessions, in a given month. * Median Sales Price for all properties from January 2021 through December 2021. This is not the average of the individual figures above. Current as of January 11, 2022. All data from the San Francisco Association of REALTORS® MLS. Report © 2021 ShowingTime. | 7 $1,387,500 $1,185,000 $1,550,000 $1,100,000 $1,680,000 $1,289,500 Single Family Condo/TIC/Coop December $500,000 $750,000 $1,000,000 $1,250,000 $1,500,000 $1,750,000 $2,000,000 $2,250,000 1-2005 1-2006 1-2007 1-2008 1-2009 1-2010 1-2011 1-2012 1-2013 1-2014 1-2015 1-2016 1-2017 1-2018 1-2019 1-2020 1-2021 Single Family Condo/TIC/Coop $1,551,000 $1,200,000 $1,608,888 $1,190,000 $1,800,000 $1,210,000 Single Family Condo/TIC/Coop Year to Date 2019 2020 2021 + 17.2% - 7.2% + 8.4% + 11.7% - 0.8% + 11.9% + 3.7% + 1.7% 2019 2020 2021 2019 2020 2021 2019 2020 2021 - 6.6% + 1.7% + 2.1% + 2.2%
  • 8. Average Sales Price market was one for the history books. After three Single Family Year-Over-Year Change Condo/TIC/ Coop Year-Over-Year Change Jan-2021 $1,952,692 -8.2% $1,211,039 -4.5% Feb-2021 $2,257,454 +18.2% $1,344,643 -0.5% Mar-2021 $2,214,726 +9.2% $1,369,434 +0.2% Apr-2021 $2,430,795 +11.3% $1,347,315 -0.0% May-2021 $2,479,992 +32.1% $1,369,209 +9.4% Jun-2021 $2,504,876 +13.8% $1,388,929 -1.9% Jul-2021 $2,292,230 +13.8% $1,355,128 -3.0% Aug-2021 $2,142,583 +7.8% $1,425,053 +7.4% Sep-2021 $2,165,489 +14.2% $1,330,272 +1.9% Oct-2021 $2,363,520 +23.9% $1,460,761 +16.6% Nov-2021 $2,375,151 +16.7% $1,548,852 +21.9% Dec-2021 $2,373,631 +17.9% $1,463,982 +14.2% 12-Month Avg* $2,315,670 +15.5% $1,389,519 +5.6% Historical Average Sales Price by Month Average sales price for all closed sales, not accounting for seller concessions, in a given month. * Avg. Sales Price for all properties from January 2021 through December 2021. This is not the average of the individual figures above. Current as of January 11, 2022. All data from the San Francisco Association of REALTORS® MLS. Report © 2021 ShowingTime. | 8 $1,846,130 $1,247,790 $2,013,136 $1,281,834 $2,373,631 $1,463,982 Single Family Condo/TIC/Coop December $500,000 $1,000,000 $1,500,000 $2,000,000 $2,500,000 $3,000,000 1-2005 1-2006 1-2007 1-2008 1-2009 1-2010 1-2011 1-2012 1-2013 1-2014 1-2015 1-2016 1-2017 1-2018 1-2019 1-2020 1-2021 Single Family Condo/TIC/Coop $1,952,993 $1,339,362 $2,004,340 $1,315,954 $2,315,670 $1,389,519 Single Family Condo/TIC/Coop Year to Date 2019 2020 2021 + 14.2% + 2.7% + 17.9% + 9.0% - 1.7% + 15.5% + 2.6% + 5.6% 2019 2020 2021 2019 2020 2021 2019 2020 2021 + 4.8% + 3.2% + 2.9% - 4.7%
  • 9. Days on Market Until Sale market was one for the history books. After three Single Family Year-Over-Year Change Condo/TIC/ Coop Year-Over-Year Change Jan-2021 37 +2.8% 70 +14.8% Feb-2021 30 +20.0% 62 +121.4% Mar-2021 23 +9.5% 45 +66.7% Apr-2021 19 -5.0% 45 +40.6% May-2021 18 -25.0% 36 -10.0% Jun-2021 17 -34.6% 35 +2.9% Jul-2021 18 -28.0% 40 +5.3% Aug-2021 24 0.0% 40 0.0% Sep-2021 22 -12.0% 37 -17.8% Oct-2021 19 -29.6% 34 -17.1% Nov-2021 20 -39.4% 40 -20.0% Dec-2021 30 -14.3% 45 -27.4% 12-Month Avg* 22 -19.2% 43 -0.5% Historical Days on Market Until Sale by Month Average number of days between when a property is listed and when an offer is accepted in a given month. * Days on Market for all properties from January 2021 through December 2021. This is not the average of the individual figures above. Current as of January 11, 2022. All data from the San Francisco Association of REALTORS® MLS. Report © 2021 ShowingTime. | 9 30 48 35 62 30 45 Single Family Condo/TIC/Coop December 0 20 40 60 80 100 120 1-2005 1-2006 1-2007 1-2008 1-2009 1-2010 1-2011 1-2012 1-2013 1-2014 1-2015 1-2016 1-2017 1-2018 1-2019 1-2020 1-2021 Single Family Condo/TIC/Coop 26 36 27 43 22 43 Single Family Condo/TIC/Coop Year to Date 2019 2020 2021 - 27.4% + 29.2% - 14.3% + 16.7% + 19.4% - 18.5% + 3.8% 0.0% 2019 2020 2021 2019 2020 2021 2019 2020 2021 - 6.3% + 13.0% + 12.5% + 6.7%
  • 10. Inventory of Active Listings market was one for the history books. After three Single Family Year-Over-Year Change Condo/TIC/ Coop Year-Over-Year Change Jan-2021 592 +20.8% 1,594 +83.4% Feb-2021 626 +7.2% 1,583 +60.1% Mar-2021 632 +14.7% 1,570 +57.6% Apr-2021 665 +9.4% 1,506 +40.7% May-2021 634 -7.8% 1,480 +10.4% Jun-2021 631 -19.4% 1,457 -7.0% Jul-2021 633 -26.5% 1,422 -26.2% Aug-2021 662 -28.4% 1,422 -32.5% Sep-2021 646 -30.5% 1,543 -33.4% Oct-2021 573 -38.2% 1,434 -39.0% Nov-2021 413 -47.9% 1,167 -44.2% Dec-2021 227 -61.1% 729 -51.4% 12-Month Avg* 578 -20.5% 1,409 -11.6% Historical Inventory of Active Listings by Month The number of properties available for sale in active status at the end of a given month. * Active Listings for all properties from January 2021 through December 2021. This is not the average of the individual figures above. Current as of January 11, 2022. All data from the San Francisco Association of REALTORS® MLS. Report © 2021 ShowingTime. | 10 393 716 584 1,501 227 729 Single Family Condo/TIC/Coop December 0 500 1,000 1,500 2,000 2,500 1-2005 1-2006 1-2007 1-2008 1-2009 1-2010 1-2011 1-2012 1-2013 1-2014 1-2015 1-2016 1-2017 1-2018 1-2019 1-2020 1-2021 Single Family Condo/TIC/Coop 2019 2020 2021 - 51.4% + 109.6% - 61.1% + 48.6% 2019 2020 2021 - 6.2% + 12.2%
  • 11. % of Properties Sold Over List Price market was one for the history books. After three Single Family Year-Over-Year Change Condo/TIC/ Coop Year-Over-Year Change Jan-2021 58.0% -7.3% 21.9% -32.6% Feb-2021 68.1% -7.1% 35.3% -44.4% Mar-2021 74.1% -5.2% 42.9% -28.7% Apr-2021 76.1% +8.7% 45.0% -24.7% May-2021 79.7% +26.1% 53.6% +27.3% Jun-2021 82.5% +49.5% 54.4% +74.9% Jul-2021 83.5% +29.1% 55.8% +25.7% Aug-2021 84.0% +27.7% 54.6% +59.6% Sep-2021 84.5% +30.0% 54.6% +58.7% Oct-2021 84.5% +25.2% 61.0% +42.5% Nov-2021 79.2% +28.6% 55.6% +69.5% Dec-2021 79.4% +26.2% 46.9% +64.0% 12-Month Avg 78.9% +20.5% 49.3% +22.1% Historical % of Properties Sold Over List Price by Month Percentage found when dividing the number of properties sold by properties sold over its original list price, not accounting for seller concessions. * % of Properties Sold Over List Price for all properties from January 2021 through December 2021. This is not the average of the individual figures above. Current as of January 11, 2022. All data from the San Francisco Association of REALTORS® MLS. Report © 2021 ShowingTime. | 11 68.3% 46.7% 62.9% 28.6% 79.4% 46.9% Single Family Condo/TIC/Coop December 0.0% 20.0% 40.0% 60.0% 80.0% 100.0% 1-2005 1-2006 1-2007 1-2008 1-2009 1-2010 1-2011 1-2012 1-2013 1-2014 1-2015 1-2016 1-2017 1-2018 1-2019 1-2020 1-2021 Single Family Condo/TIC/Coop 76.7% 58.9% 65.5% 40.4% 78.9% 49.3% Single Family Condo/TIC/Coop Year to Date 2019 2020 2021 + 64.0% - 38.8% + 26.2% - 7.9% - 31.4% + 20.5% - 14.6% + 22.0% 2019 2020 2021 2019 2020 2021 2019 2020 2021 + 1.3% - 3.4% - 2.3% + 3.1%
  • 12. % of List Price Received market was one for the history books. After three Single Family Year-Over-Year Change Condo/TIC/ Coop Year-Over-Year Change Jan-2021 105.2% -1.7% 98.7% -1.7% Feb-2021 109.7% -1.7% 100.7% -4.3% Mar-2021 112.2% -1.7% 102.4% -1.6% Apr-2021 113.8% +4.6% 103.7% -1.5% May-2021 116.8% +10.4% 105.2% +4.8% Jun-2021 116.3% +10.1% 105.3% +5.4% Jul-2021 118.5% +11.8% 104.8% +3.8% Aug-2021 116.0% +7.9% 104.3% +3.9% Sep-2021 116.3% +8.9% 105.0% +4.8% Oct-2021 117.0% +8.2% 105.5% +4.1% Nov-2021 114.9% +8.4% 104.6% +4.4% Dec-2021 114.6% +8.1% 103.6% +4.3% 12-Month Avg* 114.8% +6.7% 103.9% +2.7% Historical % of List Price Received by Month Percentage found when dividing a property’s sales price by its most recent list price, then taking the average for all properties sold in a given month, not accounting for seller concessions. * % of List Price Received for all properties from January 2021 through December 2021. This is not the average of the individual figures above. Current as of January 11, 2022. All data from the San Francisco Association of REALTORS® MLS. Report © 2021 ShowingTime. | 12 109.9% 103.0% 106.0% 99.3% 114.6% 103.6% Single Family Condo/TIC/Coop December 112.5% 105.3% 107.5% 101.2% 114.8% 103.9% Single Family Condo/TIC/Coop Year to Date 90.0% 100.0% 110.0% 120.0% 130.0% 1-2005 1-2006 1-2007 1-2008 1-2009 1-2010 1-2011 1-2012 1-2013 1-2014 1-2015 1-2016 1-2017 1-2018 1-2019 1-2020 1-2021 Single Family Condo/TIC/Coop 2019 2020 2021 + 4.3% - 3.6% + 8.1% - 3.5% 2019 2020 2021 - 1.0% + 0.8% 2019 2020 2021 + 2.7% - 3.9% + 6.8% - 4.4% 2019 2020 2021 - 2.8% - 0.8%
  • 13. Housing Affordability Ratio market was one for the history books. After three Single Family Year-Over-Year Change Condo/TIC/ Coop Year-Over-Year Change Jan-2021 36 -2.7% 63 +14.5% Feb-2021 33 -2.9% 53 +3.9% Mar-2021 32 -3.0% 52 +6.1% Apr-2021 31 -8.8% 55 +7.8% May-2021 30 -14.3% 54 -8.5% Jun-2021 28 -12.5% 52 -3.7% Jul-2021 30 -14.3% 55 +3.8% Aug-2021 30 -14.3% 57 +1.8% Sep-2021 32 -8.6% 55 -3.5% Oct-2021 31 -13.9% 53 -10.2% Nov-2021 30 -14.3% 53 -10.2% Dec-2021 32 -13.5% 49 -21.0% 12-Month Avg* 31 -8.1% 35 -11.6% Historical Housing Affordability Ratio by Month This index measures housing affordability for the region. For example, an index of 120 means the median household income is 120% of what is necessary to qualify for the median-priced home under prevailing interest rates. A higher number means greater affordability. * Affordability Ratio for all properties from January 2021 through December 2021. This is not the average of the individual figures above. Current as of January 11, 2022. All data from the San Francisco Association of REALTORS® MLS. Report © 2021 ShowingTime. | 13 38 52 37 62 32 49 Single Family Condo/TIC/Coop December 20 40 60 80 100 1-2005 1-2006 1-2007 1-2008 1-2009 1-2010 1-2011 1-2012 1-2013 1-2014 1-2015 1-2016 1-2017 1-2018 1-2019 1-2020 1-2021 Single Family Condo/TIC/Coop 2019 2020 2021 - 21.0% + 19.2% - 13.5% - 2.6% 2019 2020 2021 + 15.2% + 6.1% 34 51 36 58 30 53 Single Family Condo/TIC/Coop Year to Date 2019 2020 2021 - 8.6% + 13.7% - 16.7% + 5.9% 2019 2020 2021 + 6.3% + 6.3%
  • 14. Months Supply of Inventory market was one for the history books. After three Single Family Year-Over-Year Change Condo/TIC/ Coop Year-Over-Year Change Jan-2021 2.8 +16.7% 6.4 +82.9% Feb-2021 2.8 -3.4% 6.1 +52.5% Mar-2021 2.7 -3.6% 5.5 +31.0% Apr-2021 2.7 -18.2% 4.7 -4.1% May-2021 2.4 -38.5% 4.3 -35.8% Jun-2021 2.4 -45.5% 4.1 -47.4% Jul-2021 2.4 -48.9% 3.9 -58.9% Aug-2021 2.5 -49.0% 3.9 -61.0% Sep-2021 2.4 -50.0% 4.2 -60.4% Oct-2021 2.2 -53.2% 3.8 -64.5% Nov-2021 1.6 -59.0% 3.1 -66.7% Dec-2021 0.9 -67.9% 2.0 -68.3% 12-Month Avg* 2.3 -38.7% 4.3 -40.9% Historical Months Supply of Inventory by Month The inventory of homes for sale at the end of a given month, divided by the average monthly pending sales from the last 12 months. * Months Supply for all properties from January 2021 through December 2021. This is not the average of the individual figures above. Current as of January 11, 2022. All data from the San Francisco Association of REALTORS® MLS. Report © 2021 ShowingTime. | 14 1.9 3.0 2.8 6.3 0.9 2.0 Single Family Condo/TIC/Coop December 0.0 2.0 4.0 6.0 8.0 10.0 12.0 1-2005 1-2006 1-2007 1-2008 1-2009 1-2010 1-2011 1-2012 1-2013 1-2014 1-2015 1-2016 1-2017 1-2018 1-2019 1-2020 1-2021 Single Family Condo/TIC/Coop 2019 2020 2021 - 68.3% + 110.0% - 67.9% + 47.4% 2019 2020 2021 - 5.0% + 20.0%
  • 15. All Properties Activity Overview Key metrics by report month and for year-to-date (YTD) starting from the first of the year. Key Metrics Historical Sparkbars 12-2020 12-2021 Percent Change YTD 2020 YTD 2021 Percent Change Current as of January 11, 2022. All data from the San Francisco Association of REALTORS® MLS. Report © 2021 ShowingTime. | 15 Months Supply 4.7 1.6 - 66.0% -- -- -- Affordability Ratio 43 35 - 18.6% % of List Price Received 102.4% 107.9% + 5.4% 104.1% 42 61.2% + 17.5% + 3.9% 36 - 14.3% 108.2% % of Properties Sold Over List Price 44.1% 59.3% + 34.5% 52.1% Active Listings 2,128 991 - 53.4% -- Avg. Sales Price $1,614,665 $1,821,113 + 12.8% $1,636,496 Days on Market 49 39 - 20.4% 36 $1,439,000 + 3.9% + 7.7% 34 - 5.6% $1,763,286 -- -- Sold Listings 671 531 - 20.9% 5,357 7,619 + 42.2% Median Sales Price $1,320,000 $1,450,000 + 9.8% $1,385,000 - 2.6% Pending Sales 526 341 - 35.2% 5,483 7,583 + 38.3% New Listings 397 169 - 57.4% 8,967 8,737 12-2018 12-2019 12-2020 12-2021 12-2018 12-2019 12-2020 12-2021 12-2018 12-2019 12-2020 12-2021 12-2018 12-2019 12-2020 12-2021 12-2018 12-2019 12-2020 12-2021 12-2018 12-2019 12-2020 12-2021 12-2018 12-2019 12-2020 12-2021 12-2018 12-2019 12-2020 12-2021 12-2018 12-2019 12-2020 12-2021 12-2018 12-2019 12-2020 12-2021 12-2018 12-2019 12-2020 12-2021
  • 16. Activity by District SF District 1: Northwest (Sea Cliff, Lake, Jordan Park / Laurel Heights, Outer Richmond, Central Ric The 2021 SF District 2: Central West (Outer Sunset, Central Sunset, Inner Sunset, Outer Parkside, Parkside, Inner Parkside, Golden Gate Heights) SF District 3: Southwest (Pine Lake Park, Lake Shore, Merced Manor, Stonestown, Lakeside, Merced Heights, Ingleside, Ingleside Heights, Oceanview) SF District 4: Twin Peaks W (Forest Hill (& Ext), W Portal, St Francis Wd, Balboa Terr, Mt Dav Manor, Ingleside Terr, Monterey Hts, Wstwd Pk & H'lnds, Shrwd Fst, Miraloma Pk, Dmnd Hts, Mdtwn Terr) SF District 5: Central (Haight Ashbury, Cole Vly / Prnssus Hts, Clarndn Hts, Corona Hts, Twin Pks, Glen Pk, Noe Vly, Eureka Vly / Dolores Hts, Mission Dolores, Duboce Trngl, Buena Vista / Ashbury Hts) SF District 6: Central North (Lower Pacific Heights, Anza Vista, Western Addition, North Panhandle, Alamo Square, Hayes Valley) SF District 7: North (Marina, Cow Hollow, Presidio Heights, Pacific Heights) SF District 8: Northeast (North Waterfront, North Beach, Russian Hill, Telegraph Hill, Nob Hill, Financial District / Barbary Coast, Downtown, Van Ness / Civic Center, Tenderloin) SF District 9: Central East (Yerba Buena, South Beach, South of Market, Mission Bay, Inner Mission, Potrero Hill, Central Waterfront / Dogpatch, Bernal Heights) SF District 10: Southeast (Outer Mission, Mission Terr, Excelsior, Portola, Bayview, Silver Terr, Hunters Pt, Candlestick Pt, Bayview Hts, Little Hollywood, Visitation Vly, Crocker Amazon) 12-2020 12-2021 + / – 12-2020 12-2021 + / – 12-2020 12-2021 + / – 12-2020 12-2021 + / – 12-2020 12-2021 + / – Single Family 1 SF District 1 42 19 -54.8% 23 16 -30.4% $2,000,000 $2,874,500 +43.7% 58 19 -67.2% 2.1 1.0 -52.4% 2 SF District 2 40 20 -50.0% 50 43 -14.0% $1,534,500 $1,625,000 +5.9% 27 21 -22.2% 1.1 0.4 -63.6% 3 SF District 3 25 14 -44.0% 20 17 -15.0% $1,227,500 $1,425,000 +16.1% 33 25 -24.2% 1.8 0.8 -55.6% 4 SF District 4 52 18 -65.4% 37 36 -2.7% $1,700,000 $1,875,000 +10.3% 28 29 +3.6% 1.8 0.5 -72.2% 5 SF District 5 120 36 -70.0% 46 25 -45.7% $2,200,000 $2,900,000 +31.8% 38 24 -36.8% 3.8 0.9 -76.3% 6 SF District 6 17 10 -41.2% 7 2 -71.4% $2,250,000 $2,485,000 +10.4% 23 22 -4.3% 3.4 2.0 -41.2% 7 SF District 7 55 21 -61.8% 20 12 -40.0% $5,647,500 $4,500,000 -20.3% 70 78 +11.4% 7.3 1.6 -78.1% 8 SF District 8 17 16 -5.9% 1 1 0.0% $2,520,000 $8,825,000 +250.2% 137 268 +95.6% 7.7 5.3 -31.2% 9 SF District 9 94 27 -71.3% 38 21 -44.7% $1,517,625 $1,450,000 -4.5% 26 34 +30.8% 3.9 0.9 -76.9% 10 SF District 10 122 46 -62.3% 60 36 -40.0% $1,100,000 $1,243,500 +13.0% 29 27 -6.9% 2.9 1.0 -65.5% Condo/TIC/Coop 1 SF District 1 63 20 -68.3% 19 21 +10.5% $1,160,000 $1,410,000 +21.6% 46 26 -43.5% 4.3 1.1 -74.4% 2 SF District 2 17 10 -41.2% 6 3 -50.0% $972,500 $1,395,000 +43.4% 43 32 -25.6% 3.3 1.8 -45.5% 3 SF District 3 11 4 -63.6% 3 5 +66.7% $738,000 $830,000 +12.5% 27 50 +85.2% 4.0 1.0 -75.0% 4 SF District 4 17 11 -35.3% 5 6 +20.0% $700,000 $986,000 +40.9% 61 55 -9.8% 3.6 2.3 -36.1% 5 SF District 5 162 50 -69.1% 60 54 -10.0% $1,344,444 $1,480,000 +10.1% 48 36 -25.0% 3.9 0.9 -76.9% 6 SF District 6 114 65 -43.0% 43 36 -16.3% $985,000 $1,417,500 +43.9% 60 30 -50.0% 4.1 1.6 -61.0% 7 SF District 7 148 47 -68.2% 37 32 -13.5% $1,500,000 $1,624,500 +8.3% 65 43 -33.8% 5.8 1.1 -81.0% 8 SF District 8 291 160 -45.0% 51 56 +9.8% $885,000 $1,075,000 +21.5% 70 71 +1.4% 7.9 2.5 -68.4% 9 SF District 9 639 327 -48.8% 124 100 -19.4% $1,050,000 $1,158,500 +10.3% 68 46 -32.4% 8.5 2.6 -69.4% 10 SF District 10 39 35 -10.3% 5 5 0.0% $515,000 $710,000 +37.9% 74 18 -75.7% 7.2 4.1 -43.1% Key metrics by report month for the districts of San Fransisco. Current as of January 11, 2022. All data from the San Francisco Association of REALTORS® MLS. Report © 2021 ShowingTime. | 16 Active Listings Sold Listings Median Sales Price Days on Market Months Supply