1. Global Elevator & Escalator market Overview
Sources: IMF, UNCTAD, Credit Suisse Research, Estimates
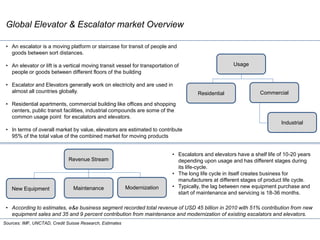
Usage
Residential Commercial
Industrial
Revenue Stream
New Equipment Maintenance Modernization
• An escalator is a moving platform or staircase for transit of people and
goods between sort distances.
• An elevator or lift is a vertical moving transit vessel for transportation of
people or goods between different floors of the building
• Escalator and Elevators generally work on electricity and are used in
almost all countries globally.
• Residential apartments, commercial building like offices and shopping
centers, public transit facilities, industrial compounds are some of the
common usage point for escalators and elevators.
• In terms of overall market by value, elevators are estimated to contribute
95% of the total value of the combined market for moving products
• Escalators and elevators have a shelf life of 10-20 years
depending upon usage and has different stages during
its life-cycle.
• The long life cycle in itself creates business for
manufacturers at different stages of product life cycle.
• Typically, the lag between new equipment purchase and
start of maintenance and servicing is 18-36 months.
• According to estimates, e&e business segment recorded total revenue of USD 45 billion in 2010 with 51% contribution from new
equipment sales and 35 and 9 percent contribution from maintenance and modernization of existing escalators and elevators.
2. • The Global Elevator and escalator market is estimated at USD 63.9 billion in revenues in 2015, a growth of 1.2 percent from USD 63.2
billion in 2014.
• The new equipment market is estimated to have declined by 2.3 percent to USD 33.7 billion in 2015 due to slowdown in China, which
contributes almost 53 percent to new equipment sales in 2014. Chinese E&E market estimated at USD 9 billion in 2015.
• However, maintenance and servicing market continued to expand with an estimated growth of 5 percent to USD 22.3 billion in 2015.
Maintenance market is now estimated to contribute about 35 percent to the total revenues.
• Over the long term, Chinese market grew at a CAGR of 15 percent between 2005-15 , followed by strong growth in APAC and MENA
region.
Global E & E market reaches USD 64 billion in 2015, China leads with a CAGR of
15% during 2005-15
Sources: IMF, UNCTAD, Credit Suisse Research, Estimates
0%
2%
4%
6%
8%
10%
12%
14%
0% 2% 4% 6% 8% 10% 12% 14% 16%
Europe
Japan & Korea
North America
CIS
MENA
South America
Sub Saharan Africa
APAC
China
17.5
22.5
33.7
8.9
15.2
22.3
2.8
6.1
8.0
29.2
43.8
2005 2010 2015E
New Equipment Maintenance ModernizationIn USD Billion
Global E&E market segments Global E&E major markets (2015E)
63.9
Vertical Axis : Construction GDP growth CAGR(2005-2015E)
Horizontal axis : E&E gowth CAGR(2005-15E)
Size of the bubble represents size
of the e&e market in USD Billion
3. • The new equipment sales is estimated to have declined by 1 percent to 717 thousand units in 2015. However the market is estimated to have
increased by a CAGR of 7 percent between 2005-2015.
• Chinese market is expected to have recorded a slower growth in 2015 due to decline in upcoming real estate projects. However, Chinese market
have expanded from 30 percent of total market size in 2005 to 53 percent of total e&e market by 2015.
• The slowdown in growth is expected to be coupled with drop in average selling prices of the equipment. New equipment prices are estimated to
have dropped by 2 percent in 2015.
• However drop in prices would not have much impact due to reduction in commodity prices which comprises the majority of the input costs for the
industry.
China slows, but continues to use above 50% of the global new equipment
manufactured, cussions global growth rate during turbulent times.
Sources: IMF, UNCTAD, Credit Suisse Research, Estimates
30%
20%
14%
6%
17%
5%
5%
53%
12%
14%
8%
4%
3%
China North America APAC MENA Europe
Japan & Korea CIS South America Sub Saharan Africa
375,000
510,000
570,000
727,864 716,946
6%
-6%
6%
3%
-1%
2005 2008 2010 2014 2015E
New Equipment Growth Cagr (%)
New Equipment sales and growth rate CAGR Region wise new equipment sales split
2015E :717,000
2005 : 375,000
In USD Billion
4. Growth in maintenance income relatively more stable. Pressure on servicing charges
due to local competition.
Sources: IMF, UNCTAD, Credit Suisse Research, Estimates
New
Equipment
MaintenanceModernization
Full
Replacement
9.0
10.1
11.6
13.1
2005 2008 2012 2015E
MaintenanceIn Million units
Elevator & Escalator’s Life Cycle Global count of Installed machineries
• The total market size of service and maintenance of escalators and elevators is estimated to have increase by 5 percent in
2015 to reach USD 22 billion.
• The total installed machines is estimated at 13 million units. Although the average cost of servicing an equipment has been
sluggish between USD 2200 and 2500 per annum, it still provides a cushion to the companies when new equipment sales
declines.
• Maintenance sector contribution to the overall elevator and escalator industry revenue has increased at a rapid pace during
2010-15 growing from 32% to 35%. Regional players have showed a better growth in comparison to industry average.
• Over a short to medium term, the deferment of replacement demand in developed markets is likely to keep the segments
growth stable due to continuous requirement of maintenance of aging equipment.
5. SWOT :Opportunities outweighs Weakness
Sources: Wikipedia
Increasing residential demand backed by increasing
urbanization
Continuous Business Opportunity in the form of
maintenance and servicing contract
Increasing per capita income along with increasing
technological advancement
Increase of automation in goods movement within
the Industry
Shortage of skilled labour for after sales service and
maintenance
Pricing pressure due to fragmented nature of
Industry.
Cyclical nature with generally low growth rate
Capital intensive business with longer gestation
period.
Expansion in untapped market with lower
urbanization rate.
Possibility of Inorganic expansion due to large
number of small regional players in a low margin
business
Government focus on increasing infrastructure
spending in emerging economies
Investment on research and development in energy
efficient and green technologies
Price sensitive market with regional local players
undercutting prices to increase volume
Economic slowdown can push the growth rate
down, prolonged slowdown hurts new additions
Regulatory and safety issues in some regions
Lack of investment into skill training due to eroding
margins in maintenance business
Strength Weakness
Opportunity Threat
6. China along with Asia Pacific & MENA region expected to drive demand;
Europe to continue underperforming on commercial and industrial front.
Sources: IMF, UNCTAD, Credit Suisse Research, Estimates
• Emerging economies with increasing per capita income
is a growth opportunity
• Large housing deficit a major driver, with oil prices at
low, government spending on housing a positive
Residential Demand
• Increase in services sector at cost efficient locations are
demand driver for certain emerging countries.
• Urbanization rate is expected to increase at a CAGR of
3-10% in medium terms for developing countries
Commercial Demand
• The Industry demand is expected to be low due to
global reduction of capex, amidst declining margins in
commodity business.
Industrial Demand
Positive impact:
• Asia pacific
• China
• South America
• North America
Positive impact:
China
MENA
Negative impact:
Europe
Negative impact:
China
MENA
South America
Europe
7. Global E&E market to grow at 6 percent CAGR between 2015-2020. China, Asia Pacific
expected to outperform global growth. Europe, MENA and Japan laggards.
34.4 33.7 34.0 35.3 36.8 38.6 40.5
7.9 8.0 8.1 8.7 9.5 10.5 10.9
20.8 22.3 23.7 25.9
28.7
32.5
34.5
2014 2015E 2016E 2017E 2018E 2019E 2020E
New Equipment Modernization MaintenanceIn USD Billion
9.5 9.0 8.6 9.6 10.5 11.8 12.5
11.4 12.8 13.2
14.0
15.0
16.0 17.2
6.0 5.9 5.8
6.0
6.7
7.3
7.7
4.0 4.7 5.5
6.3
6.8
7.6
8.1
8.8
8.8 8.9
9.4
10.0
10.6
11.2
7.9
7.8 7.8
8.1
8.4
8.9
9.1
5.1
5.2 5.5
5.9
6.5
7.2
7.3
9.1 8.3 8.4
8.4
9.0
9.9
10.5
1.6 1.7
2.0
2.2
2.2
2.4
2.7
2014 2015E 2016E 2017E 2018E 2019E 2020E
China North America Europe
APAC MENA Japan & Korea
South America Cis Sub saharan Africa
In USD Billion
Sources: IMF, UNCTAD, Credit Suisse Research, Estimates
E&E market size (2014-2020E) Segment wise revenue (2014-2020E)
63 66
70
75
82
86
64
• The global Elevator and escalator market is estimated to grow at
a CAGR of 6 percent between 2015-2020 to USD 86 billion
dollar.
• Chinese E&E market is expected to grow at a CAGR of 7 percent
between 2015-2020. Asia ex china market expected to grow at a
CAGR of 10 percent.
• Maintenance market is estimated to further move up at a CAGR
of 9 percent due to slow movement of replacement cycle.
• Maintenance contribution to overall market size expected to grow
to 40 percent of total revenue of escalator and elevator industry.