SlideShare uma empresa Scribd logo
1 de 14
Baixar para ler offline
WHITE P APER
                                                               Cloud Computing's Role in Job Creation
                                                               Sponsored by: Microsoft

                                                               John F. Gantz                   Stephen Minton
                                                               Anna Toncheva
                                                               March 2012


                                                               Introduction
www.idc.com


                                                               While cloud computing is still just emerging as a computing style — IDC estimates
                                                               that spending on public cloud IT services in 2011 was $28 billion, compared with
                                                               more than $1.7 trillion in spending on total IT products and services — it already has
F.508.935.4015


                                                               begun changing how IT delivers economic value to countries, cities, industries, and
                                                               small businesses.

                                                               This is because cloud computing comes with unique economic leverage that means a
                                                               little money spent up front leads to impressive returns down the line.
P.508.872.8200


                                                               IDC estimates that last year alone, IT cloud services helped organizations of all sizes
                                                               and all vertical sectors around the world generate more than $400 billion in revenue
                                                               and 1.5 million new jobs. In the next four years, the number of new jobs will surpass
                                                               8.8 million.
Global Headquarters: 5 Speen Street Framingham, MA 01701 USA


                                                               Figure 1 shows the number of jobs created worldwide as a result of cloud computing.


                                                               FIGURE 1

                                                               Cloud Computing Impact on Jobs: Total Cumulative Jobs
                                                               Generated by Cloud Computing Worldwide at Year -End,
                                                               2012–2015

                                                                                                                                            13.8
                                                                        14
                                                                        12                                              11.3

                                                                        10                           8.8
                                                                  (M)


                                                                         8         6.7
                                                                         6
                                                                         4
                                                                         2
                                                                         0
                                                                                   2012             2013                2014               2015

                                                               Source: IDC, 2012
This White Paper, commissioned by Microsoft, examines the impact cloud computing
       will have on employment around the world — by region, country, enterprise size
       class, and industry. It follows on research IDC has conducted on the economic impact
       of cloud computing since 2009 and the economic impact of IT since 2002.


       The Economic Leverage of Cloud Computing

       Cloud computing comes in many forms, from the use of third-party resources to store
       data to delivery of IT services within an enterprise based on virtualized infrastructure,
       self configuration, and automated provisioning. The former is an example of "public"
                                                                               1
       cloud computing; the latter is an example of "private" cloud computing.

       For four years now, IDC has been estimating the economic impact of public IT cloud
       services by taking conservative estimates of the degree to which they could increase
       IT innovation and then estimating the revenue and potential jobs driven by that
       innovation.

       The following factors play into that equation:

        IDC estimates that, worldwide, 75% of IT spending is tied up with maintenance of
         legacy systems and routine upgrades, or "legacy drag." Cloud computing allows
         IT organizations to shift some of that legacy work to the cloud, freeing up budget
         to invest in IT innovation that supports business innovation.

        Lower IT and business process costs driven by the economies of scale in
         infrastructure and talent of cloud computing also free up funds for new business
         investment.

        The ratio of IT spending as a percentage of revenue is small for most
         organizations — 1% to 4%, generally. Conversely, business revenue, when
         driven by innovative IT, can be a significant multiple of IT investment.

       For this study, IDC expanded on earlier work by extending the analysis to include
       spending on private cloud services. In general, the payoff may not be as big because
       internally provided cloud services may be involved with legacy systems, but in some
       cases not. For example, in emerging geographies where adoption of public IT cloud
       services is not that far along and where the demands of legacy systems are less,
       private cloud services may offer greater economic benefit in the short term than public
       cloud services.

       As a result of extending this earlier work:

        Increased business revenue from the IT innovation enabled by cloud could reach
         $1.1 trillion a year by 2015 across the countries studied.

        IDC estimates that spending on public and private IT cloud services will generate
         nearly 14 million jobs worldwide by 2015.


1
    IDC's definition of cloud computing can be found at http://blogs.idc.com/ie/?p=422.


       2                                                   #233532                                 ©2012 IDC
 More than 50% of those jobs will accrue to small and medium-sized businesses,
       and more than 1 million jobs each will accrue to the banking, communications,
       and discrete manufacturing industries.

      A majority of these jobs will be found in emerging markets because of their
       immense workforces — 1.2 billion workers in China and India alone.


     The Jobs Created

     The basic rationale for job growth is that IT innovation allows for business innovation,
     which leads to business revenue, which leads to job creation — a premise that is not
                          2
     unique to this study. To create a model that analyzes the role of cloud in job creation,
     IDC calculated the number of cloud-generated jobs by weighing several factors,
     including available country workforce, unemployment rates, GDP, IT spend by
     industry and company size, industry mix by country and city, technology infrastructure
     by country and city, regulatory environment, and other factors. Much of this
     methodology is explained in the ensuing pages of this White Paper.

     In the IDC analysis, since the jobs created are the result of increased business
     revenue, we assume they match the industry mix by job function — marketing, sales,
     finance and administration, production, service, and so on. We also consider them net
     of jobs lost to cloud computing (e.g., in the IT organization itself).

     In discussions we have had with CIOs testing and experimenting with cloud
     computing, we find that most look at migration to cloud computing as a way to free up
     existing resources to work on more innovative projects, not to do away with the
     positions entirely. In that way, cloud computing differs from traditional outsourcing. On
     the other hand, cloud computing could certainly change the skills requirements in an
     IT organization.


     Jobs by Segment

     By enterprise size class, the jobs will be split fairly evenly between companies with
     fewer than 500 employees and companies with 500+ employees, as shown in Figure 2.


2
  See, for example, the work of Professor Federico Etro of the University of Milan
(http://www.intertic.org/Policy%20Papers/CC.pdf).


     ©2012 IDC                                           #233532                                 3
FIGURE 2

Cloud Jobs by Size Class: Total Cumulative Jobs Generated by
Cloud Computing Worldwide, 2012–2015


          8                                                                    7.5
          7                                                                          6.3
                                                              6.1
          6
                                                                    5.1
          5                             4.7
                                                4
    (M)


          4         3.6
                          3.1
          3
          2
          1
          0
                     2012                2013                  2014              2015
                    SMEs (<500)
                    Enterprise (500+)

Source: IDC, 2012


In most geographies, organizations with fewer than 500 employees account for a
majority of total employment — more than 70% in some cases — but at the same
time, they account for only a third of IT spending. This lower level of automation
means that jobs created as a result of deploying IT cloud services won't mirror
workforce size class segmentation. At the same time, IDC believes that small and
medium-sized companies — at least those with computers — will adopt cloud IT
services faster than larger companies. A number of factors play into this:

 The degree of "legacy drag" is less for smaller firms than larger firms.

 Capital constraints make public IT cloud services more attractive to smaller firms
  than larger firms but also limit investments in private IT cloud services.

 The concentration of small firms varies by industry, which will affect IT cloud
  service adoption.

The final distribution of cloud-generated jobs, therefore, is the result of an equation with
offsetting elements — high percentage of employment, low percentage of IT spending,
higher-than-average public IT cloud service adoption by computerized firms.


Jobs by Industry

By industry, the jobs to some extent mirror the industries by size, but not entirely. In
research conducted in 2010, IDC found that adoption of IT cloud services varied
greatly by industry. For instance, professional services firms spent nearly five times


4                                                   #233532                                    ©2012 IDC
as much on public IT cloud services as a percentage of IT spending as the
government and nearly two-and-a-half times as much as utility companies.


FIGURE 3

Cloud Computing "Intensity": U.S. Spending on Public IT Cloud
Services as a Percentage of IT Spending, 2011


                   Prof essional services

                                    Insurance

                            Transportation

                               Construction

                                   Education

                  Process manuf acturing

  Securities and investment services

                                         Retail

                      Resource industries

                                      Banking

                                          Total

                  Discrete manuf acturing

           Communications and media

                                  Healthcare

                                  Wholesale

                                       Utilities

                                Government

                                                   0       1        2       3     4   5   6
                                                                           (% )

Source: U.S. Public IT Cloud Services by Industry, IDC #226222, December 2010


©2012 IDC                                              #233532                                5
The reasons for this difference in adoption of public IT cloud services by industry are
complex. In some cases, the preponderance of small and medium-sized companies
in a sector — for example, professional services and retail — will drive up adoption. In
other cases, security issues will slow adoption in sectors, such as banking, that may
typically be high users of IT. At the same time, they might increase adoption of private
IT cloud services.

Some specific insights from the document cited above are as follows:

 Securities and investment services, typically early adopters of new technologies,
  are expected to be ahead of the average in the adoption of public IT cloud
  services as well. This should hold true across all geographies because of the
  global nature of the market.

 Banking, on the other hand, because of regulation, privacy concerns, and
  security issues will be closer to the average, despite being a traditional early
  adopter of technology. On the other hand, banking will be an investor in private
  IT cloud services. There may be more variation across geographies depending
  on the concentration of small lenders and banks.

 Insurance, generally less constrained by regulation than banking and yet a heavy
  user of IT, is already toward the top of the list in spending on public cloud
  services as a percentage of IT spending. On the other hand, it's one of the slower
  growth sectors in both IT and IT cloud services spending, with larger
  organizations slower to adopt cloud solutions than smaller organizations.

 Professional services, a large sector in itself, is a sweet spot of public IT cloud
  services spending because it contains a multitude of information-dependent
  midsize companies that will adopt software-as-a-service components of cloud
  computing, not to mention large services companies adopting infrastructure as a
  service. This holds true across geographies — to the extent that the firms in this
  sector spend on IT at all.

 Communications and media will run below the overall average in terms of
  spending on cloud services as a percentage of IT spending but will be a large —
  and fast-growing — sector when it comes to jobs. IDC expects the media
  segment to be one of the main users of storage on demand as a service to
  enable continuous service for content-heavy customer offerings. This sector
  already accounts for 20% of spending on public cloud storage in the United
  States. IDC expects this to hold true across geographies.

 Healthcare is expected to be a little slow in adoption of public IT cloud services
  as a result of regulation, security issues, and "legacy drag," but healthcare reform
  and the rise of connected healthcare will lead providers toward the public cloud
  for specific functions such as email and portal development. Many of the
  countries studied have initiatives under way similar to those in the United States
  for electronic medical records, which are tailor-made for public IT cloud services.
  Healthcare will also adopt private IT services, but much of this may still be aimed
  at making legacy systems more efficient, not at new business initiatives.


6                                             #233532                                      ©2012 IDC
 The education sector, a small vertical but with better-than-average cloud-related
  job growth, will see IT cloud services as an attractive way to deal with budget
  constraints. Many are worried about being locked into a single cloud vendor, but
  in many developed countries, they may find cloud computing is still a good way
  to face budget cuts. In less financially constrained geographies, IT cloud services
  will offer standardization and lower capital costs of expansion.

 The manufacturing sector, even in developed countries, has a high percentage of
  small businesses, and adoption of cloud-based technologies is a viable way to
  simplify software management, improve service levels, and reduce capital costs.
  Thus far, customer relationship management (CRM) and collaboration have been
  the most popular cloud-based services in this sector. Over time, application
  development services and storage services will grow as manufacturers deal with
  infrastructure costs related to the growing use of digital models and virtual
  product testing. Process manufacturing has a higher percentage of IT spending
  devoted to IT cloud services today than discrete manufacturing, but that
  difference will narrow by 2015.

 Like manufacturing, resource industries have a high concentration of small
  businesses and fewer security and regulatory constraints than many industries
  but just an average level of spending on IT cloud services as a percentage of IT
  spending. What's more, worldwide, the sector is not particularly fast growing in
  either IT spending or cloud-related jobs.

 The retail sector, with lots of small businesses, relatively free of regulatory
  concerns, and with records and documents easily stored in the cloud and despite
  generally being slow to adopt new technologies, has been an early adopter of
  cloud computing. This may be abetted by a smaller sunk investment in legacy
  infrastructure compared with many other sectors.

 Utility companies, low on the vertical "intensity" scale, have traditionally been late
  adopters of IT, and IDC expects the same in adoption of IT cloud services.
  Regulated in many areas of operation, they have less competitive pressure to
  drive new revenue through IT than many other vertical industries. What
  investments they make may be heavier on the private IT cloud services side
  since these investments can be folded into capital budgets. This will change over
  time with the development of smart grids, optimized consumption models, and
  retail energy marketing, but not fast enough for the segment to rise faster than
  other industries.

 Government adoption of IT cloud services will be quite heterogeneous. We would
  expect to see more private IT cloud services at the federal level as large
  agencies offer services for their smaller entities, although services such as email,
  portal development, and collaboration will migrate to public IT cloud services.
  State, provincial, and local governments will be more likely candidates for public
  IT cloud services.

Combine this varying intensity based on industry dynamics with varying sizes of the
industries studied for this White Paper and you get some big differences by industry
in cloud-related jobs, as seen in Table 1.


©2012 IDC                                     #233532                                      7
TABLE 1

    Worldwide Cloud-Generated Jobs, 2012–2015

    Selected                                                                                     2012 Through
    Vertical                       2012                  2013        2014                2015   2015 CAGR (%)

    Banking                     735,126               945,381    1,192,592       1,425,402          27.4

    Communications            1,048,965             1,385,577    1,859,267       2,416,457          31.6
    and media

    Discrete                    631,497               818,679    1,054,258       1,308,262          28.8
    manufacturing

    Education                   347,598               452,584     580,606          723,671          29.0

    Government                  271,039               343,236     427,316          513,202          26.3

    Healthcare                  183,056               234,325     295,887          356,453          26.3

    Insurance                   344,057               442,562     559,401          673,440          27.7

    Process                     446,681               564,700     706,593          854,342          25.9
    manufacturing

    Resource                    127,719               171,886     229,344          296,547          32.7
    industries

    Retail                      351,486               440,404     540,495          639,281          24.2

    Subtotal                  4,487,223             5,799,334    7,445,760       9,207,056          28.5

    All other                 2,244,982             2,954,636    3,804,666       4,632,974          29.6
    industries

    Total                     6,732,204             8,753,969   11,250,426      13,840,030          28.8

    Note: Public and private/hybrid cloud jobs are included.
    Source: IDC, 2012


For instance, note that banking and communications are not particularly early
adopters of cloud computing, but they each will have more than 1 million cloud-
related jobs by 2015. This is because they are big segments and spend a lot on IT.

The government, on the other hand, which is the largest of the enumerated sectors
when it comes to IT spending, is just middle of the pack in cloud-related jobs because
of its slow pace adopting the new computing style.


8                                                     #233532                                       ©2012 IDC
Jobs by Geography: Overview

The data tables that accompany this document show cloud-generated jobs by region,
country, and select metropolitan areas in the United States and Canada.

The factors determining the number of jobs that might be created in a particular
geography are numerous and include:

 The current and projected level of spending on IT

 Current and projected spending on IT cloud services

 IT as a percentage of GDP or output (i.e., the degree of current automation)

 Percentage of IT work done on legacy systems and routine upgrades

 Workforce levels by industry and/or size class

 Economic base by industry and/or size class

 The ratio of private IT cloud services spending to public IT cloud services spending

For instance, in the U.S. metropolitan area splits, New York accounted for just over
9% of the U.S. cloud-generated jobs in 2011, yet only 6% of the U.S. workforce. But
the workforce in New York is more concentrated in banking, communications,
securities, and professional services than the workforces in most other cities, which
increases New York's share of U.S. cloud-related jobs. Washington, D.C., on the
other hand, has a higher concentration of government workers than many other cities,
so while it commands more than 2% of the U.S. workforce, it accounts for less than
2% of the U.S. cloud-generated jobs.

Because of the relatively high level of computerization in the United States and
Canada, variations in share of total U.S. or Canada jobs of a designated market area
(DMA) compared with overall employment are driven mostly by industry
differentiation; there is some differentiation by IT spending level.

By region, however, the differences are more subtle. Between emerging and
developed countries, the numbers are driven more by the degree of IT spending and
adoption levels of cloud, public and private, than industry makeup.


©2012 IDC                                     #233532                                    9
By Major Region

The distribution of cloud-related jobs by region is a mix of employment by region crossed
by investment in IT cloud services by region. The dynamics by major region are as
follows:

 North America (defined by IDC as the United States and Canada) is driven by the
  high adoption rate of IT cloud services in the United States. According to IDC's
  regional forecast, the United States accounted for 62% of worldwide spending for
  public IT cloud services last year, compared with 35% of worldwide IT spending.
  Canada, on the other hand will be a much slower adopter of public IT cloud
  services and therefore a more aggressive adopter of private IT cloud services.
  Coming from a smaller base, though, cloud-generated jobs will grow 50% faster
  in Canada than in the United States. Despite the region's high aggregate share of
  spending on IT cloud services, it will have the lowest total number of cloud-
  generated jobs in 2015. This is because it has the smallest workforce and a high
  "legacy drag" for both public and private cloud services.

 EMEA, a complex mix of developed and emerging countries, has more cloud-
  created jobs than North America primarily because of its workforce, which is
  nearly four times as large. Last year, EMEA's spending in public IT cloud
  services was 40% of North America's, but its investment in private cloud was
  equal to or more than that of North America. This, coupled with the larger
  workforce, drove cloud-created jobs higher than North America.

 Asia/Pacific, except for a few small countries that account for only about 5% of
  the total workforce, is dominated by two countries in terms of job creation —
  China and India. The region is a more aggressive adopter of public IT cloud
  services than one might think, accounting for 12% of such services worldwide
  (compared with 25% of IT spending). In addition, the region has two other factors
  in favor of cloud-based job creation: (1) infrastructure challenges will help spur
  investment in private IT cloud services, and (2) in such an emerging market,
  spending on IT cloud services will be subject to less "legacy drag" than in
  developing regions. But, of course, the primary reason for such high job numbers
  is the immense workforce in the region.

Figure 4 compares the regions in total cloud-created jobs in 2015. For context, we
have broken out China and India from the rest of Asia/Pacific.


10                                             #233532                                      ©2012 IDC
FIGURE 4

Cloud Computing Jobs by Region: Total Cumulative Jobs
Generated by Cloud Computing Worldwide at Year -End 2015


         7                                                                  6.75

         6
         5
         4
   (M)


                                                         2.87
         3
                                     2.07
         2
                    1.17
         1
         0
             North America          EMEA            Asia/Pacif ic*    China and India


* Except China and India
Source: IDC, 2012


U.S. Metropolitan Areas

Part of this study was to develop a picture of cloud-generated job creation in 13 major
metropolitan areas, also called designated market areas (DMAs). As with countries
and regions, this was primarily an exercise in understanding IT spending by vertical in
each DMA, the potential for spending on both public and private cloud computing, and
the dynamics of the local economy.

For the most part, the cloud jobs created in each DMA are proportional to the DMA's
share of the U.S. total workforce, but not exactly. Figure 5 shows how each DMA
varies from its share of the U.S. workforce.


©2012 IDC                                     #233532                                     11
FIGURE 5

Cloud Jobs Versus Total Jobs: Percent of U.S. Cloud -Generated
Jobs – Percent of Total U.S. Workforce


                Atlanta

                Boston

              Chicago

                    Dallas

               Denver

                Detroit

              Houston

         Los Angeles

         Minneapolis

            New York

         Philadelphia

              Phoenix

  Washington, D.C.

                             -0.5   0.0   0.5   1.0   1.5   2.0   2.5     3.0     3.5
                                                      (%)


Source: IDC, 2012


These differences are the result of three factors: (1) IT spending less than or more
than the DMA's share of the U.S. workforce, (2) its mix of spending on public and
private cloud, and (3) its industry mix (refer back to Figure 3).

For example, by DMA:

 Atlanta: While this DMA's vertical industry set is less public cloud intense than
  the United States as a whole (e.g., higher on utilities and lower on professional
  services), its IT spending and investment in private IT cloud services are above
  the U.S. average, making its share of U.S. cloud-related jobs higher than its
  share of the U.S. workforce.

 Boston: The vertical industry mix is such that this DMA has the same public
  cloud intensity as the United States — its educational and financial sectors are
  offset by the healthcare and government sectors — but its general level of
  computerization is high, driving its share of cloud-created jobs higher than its
  share of the U.S. workforce.


12                                              #233532                                 ©2012 IDC
 Chicago: IT spending and spending on cloud services are higher as a
  percentage of the U.S. total than its share of workforce, and the vertical mix is
  more cloud intense than the U.S. as a whole (higher in banking, professional
  services, process manufacturing, etc.).

 Dallas: While this DMA's vertical makeup is a little less cloud intense than the
  U.S. average (lower professional services) and its investment in private cloud
  services will lag some of the other DMAs, its level of computerization compared
  to its workforce is enough to drive its share of cloud-created jobs up to its share
  of the U.S. workforce.

 Denver: The same dynamic is at work for Denver as for Dallas, except Denver's
  investment in private cloud IT services will be higher and its vertical "intensity"
  lower, primarily because of an unusually large communications and media
  sector.

 Detroit: Jobs created by cloud computing are a smaller share of the U.S. total
  than this DMA's workforce is of the U.S. workforce. This is the result of lower-
  than-average vertical intensity (more retail and utilities, fewer professional and
  financial services) and lower investment in private IT cloud services.

 Houston: Although the vertical mix in this DMA is a little different, the general
  dynamics are the same as those of Dallas.

 Los Angeles: This DMA has a share of U.S. cloud-generated jobs a little ahead
  of its share of the total workforce despite a mix of vertical industries that will
  adopt cloud computing more slowly than the U.S. average (particularly
  communications and media). This is because of a better-than-average expected
  investment in private cloud computing and an IT spending per employee that is
  higher than the U.S. average.

 Minneapolis: In this DMA, cloud-created jobs are a lower percentage of total
  U.S. cloud jobs than the Minneapolis workforce is of the total U.S. workforce,
  mostly because of lower-than-average investment in private IT cloud services. In
  its vertical mix, cloud-intense verticals and verticals that aren't cloud-intense
  balance each other to make the total mix about the same as the United States in
  vertical intensity.

 New York: Almost all factors that would increase this DMA's share of cloud-
  created jobs beyond its share of the total U.S. workforce are at play: verticals
  heavy in financial and professional services and lower in utilities and discrete
  manufacturing, higher-than-average investment in private IT cloud services, and
  a general level of IT spending much higher than share of the total U.S. workforce.

 Philadelphia: Although this DMA has a good mix of verticals, especially
  professional services, education, and process manufacturing, its level of IT
  spending as a percentage of total U.S. spending is lower than its share of the
  total U.S. workforce, dragging its cloud jobs below its share of the U.S.
  workforce.


©2012 IDC                                    #233532                                    13
 Phoenix: This DMA's vertical mix is a story of cloud-intense industries (e.g.,
  professional services, banking) being cancelled out by non-cloud-intense
  industries (e.g., discrete manufacturing) and lower-than-average investment in
  private IT cloud services. Combined, these factors drop the DMA's share of
  cloud-created jobs below its share of all U.S. jobs.

 Washington, D.C.: Although this DMA has a higher-than-average investment in
  private IT cloud services than many of the other DMAs, its vertical mix (high
  government, high communications and media) helps drive its share of U.S.
  cloud-created jobs below its share of all U.S. jobs.


CONCLUSIONS
The study results seem to indicate one of the beauties of cloud computing — it frees
enterprises from the constraints of the client/server model, where up-front
investments in infrastructure are required to pursue technological solutions to
business problems. Emerging markets, small cities, and small businesses have as
much access to the benefits of cloud computing as large enterprises or developed
nations. The availability of private IT cloud services as an option where public cloud
IT services are not fully available or where there are infrastructure challenges is a
nice hedge for emerging markets.

Beyond this, and not measured in this study, is the use that cloud computing can be
put to beyond mere capital cost avoidance. Organizations large and small can host
their own cloud services for their own customers. IT cloud services can support other
industry services offered in the cloud, from egovernment and online health records to
product development and design, logistics, and billing. And here may be an even
bigger payoff for local economies than the adoption of IT cloud services alone.


Copyright Notice

External Publication of IDC Information and Data — Any IDC information that is to be
used in advertising, press releases, or promotional materials requires prior written
approval from the appropriate IDC Vice President or Country Manager. A draft of the
proposed document should accompany any such request. IDC reserves the right to
deny approval of external usage for any reason.

Copyright 2012 IDC. Reproduction without written permission is completely forbidden.


14                                           #233532                                     ©2012 IDC

Mais conteúdo relacionado

Mais procurados

IDC Report Extracting-Value-from-Chaos
IDC Report Extracting-Value-from-ChaosIDC Report Extracting-Value-from-Chaos
IDC Report Extracting-Value-from-ChaosLarry Levine
 
The Cloud: Time for Delivery
The Cloud: Time for DeliveryThe Cloud: Time for Delivery
The Cloud: Time for DeliveryCapgemini
 
15527769_Pedro Martins_Final Report_edit
15527769_Pedro Martins_Final Report_edit15527769_Pedro Martins_Final Report_edit
15527769_Pedro Martins_Final Report_editPedro Martins
 
Organizing for digital why digital dexterity matters - capgemini consulting
Organizing for digital   why digital dexterity matters - capgemini consultingOrganizing for digital   why digital dexterity matters - capgemini consulting
Organizing for digital why digital dexterity matters - capgemini consultingRick Bouter
 
Digital Organization
Digital OrganizationDigital Organization
Digital OrganizationCapgemini
 
Monthly Technology Brief
Monthly Technology Brief Monthly Technology Brief
Monthly Technology Brief Capgemini
 
The untapped network
The untapped networkThe untapped network
The untapped networkJohn Nelson
 
Microsoft Whitepaper: Cloud Computing Guide for Construction
Microsoft Whitepaper: Cloud Computing Guide for ConstructionMicrosoft Whitepaper: Cloud Computing Guide for Construction
Microsoft Whitepaper: Cloud Computing Guide for ConstructionDWP Information Architects Inc.
 
Rising to the New Challenges of Transactional Services in the Public Sector
Rising to the New Challenges of Transactional Services in the Public SectorRising to the New Challenges of Transactional Services in the Public Sector
Rising to the New Challenges of Transactional Services in the Public SectorCapgemini
 
Cloud Computing: What's Its Business Potential for Your Company?
Cloud Computing: What's Its Business Potential for Your Company?Cloud Computing: What's Its Business Potential for Your Company?
Cloud Computing: What's Its Business Potential for Your Company?white paper
 
Accelerating Time to Market with Next Generation Cloud Platforms by Michael M...
Accelerating Time to Market with Next Generation Cloud Platforms by Michael M...Accelerating Time to Market with Next Generation Cloud Platforms by Michael M...
Accelerating Time to Market with Next Generation Cloud Platforms by Michael M...Khazret Sapenov
 
CIO Summit 2013 - David McNally
CIO Summit 2013 - David McNallyCIO Summit 2013 - David McNally
CIO Summit 2013 - David McNallyIDGnederland
 
Employing cloud ian moyse - workbooks - whitepaper
Employing cloud   ian moyse - workbooks - whitepaperEmploying cloud   ian moyse - workbooks - whitepaper
Employing cloud ian moyse - workbooks - whitepaperITpreneurs
 
Microsoft in the enterprise
Microsoft in the enterpriseMicrosoft in the enterprise
Microsoft in the enterpriseIDGnederland
 
It Trends 2008 (Tin180 Com)
It Trends   2008 (Tin180 Com)It Trends   2008 (Tin180 Com)
It Trends 2008 (Tin180 Com)Tin180 VietNam
 

Mais procurados (17)

IDC Report Extracting-Value-from-Chaos
IDC Report Extracting-Value-from-ChaosIDC Report Extracting-Value-from-Chaos
IDC Report Extracting-Value-from-Chaos
 
The Cloud: Time for Delivery
The Cloud: Time for DeliveryThe Cloud: Time for Delivery
The Cloud: Time for Delivery
 
15527769_Pedro Martins_Final Report_edit
15527769_Pedro Martins_Final Report_edit15527769_Pedro Martins_Final Report_edit
15527769_Pedro Martins_Final Report_edit
 
Organizing for digital why digital dexterity matters - capgemini consulting
Organizing for digital   why digital dexterity matters - capgemini consultingOrganizing for digital   why digital dexterity matters - capgemini consulting
Organizing for digital why digital dexterity matters - capgemini consulting
 
Digital Organization
Digital OrganizationDigital Organization
Digital Organization
 
Monthly Technology Brief
Monthly Technology Brief Monthly Technology Brief
Monthly Technology Brief
 
The untapped network
The untapped networkThe untapped network
The untapped network
 
Microsoft Whitepaper: Cloud Computing Guide for Construction
Microsoft Whitepaper: Cloud Computing Guide for ConstructionMicrosoft Whitepaper: Cloud Computing Guide for Construction
Microsoft Whitepaper: Cloud Computing Guide for Construction
 
Rising to the New Challenges of Transactional Services in the Public Sector
Rising to the New Challenges of Transactional Services in the Public SectorRising to the New Challenges of Transactional Services in the Public Sector
Rising to the New Challenges of Transactional Services in the Public Sector
 
Cloud Computing: What's Its Business Potential for Your Company?
Cloud Computing: What's Its Business Potential for Your Company?Cloud Computing: What's Its Business Potential for Your Company?
Cloud Computing: What's Its Business Potential for Your Company?
 
Accelerating Time to Market with Next Generation Cloud Platforms by Michael M...
Accelerating Time to Market with Next Generation Cloud Platforms by Michael M...Accelerating Time to Market with Next Generation Cloud Platforms by Michael M...
Accelerating Time to Market with Next Generation Cloud Platforms by Michael M...
 
CIO Summit 2013 - David McNally
CIO Summit 2013 - David McNallyCIO Summit 2013 - David McNally
CIO Summit 2013 - David McNally
 
Personalised Technology Stimulates Innovation in the Workplace
Personalised Technology Stimulates Innovation in the WorkplacePersonalised Technology Stimulates Innovation in the Workplace
Personalised Technology Stimulates Innovation in the Workplace
 
User empowerment and choice in downloading software
User empowerment and choice in downloading softwareUser empowerment and choice in downloading software
User empowerment and choice in downloading software
 
Employing cloud ian moyse - workbooks - whitepaper
Employing cloud   ian moyse - workbooks - whitepaperEmploying cloud   ian moyse - workbooks - whitepaper
Employing cloud ian moyse - workbooks - whitepaper
 
Microsoft in the enterprise
Microsoft in the enterpriseMicrosoft in the enterprise
Microsoft in the enterprise
 
It Trends 2008 (Tin180 Com)
It Trends   2008 (Tin180 Com)It Trends   2008 (Tin180 Com)
It Trends 2008 (Tin180 Com)
 

Destaque

2011 ibm-cmo
2011 ibm-cmo2011 ibm-cmo
2011 ibm-cmoraisinli
 
Erp cloud white paper final
Erp cloud white paper finalErp cloud white paper final
Erp cloud white paper finalraisinli
 
中国云计算发展之道
中国云计算发展之道中国云计算发展之道
中国云计算发展之道raisinli
 
2011 IBM全球CIO调研报告
2011 IBM全球CIO调研报告2011 IBM全球CIO调研报告
2011 IBM全球CIO调研报告raisinli
 
Citrix虚拟化之旅三(xen server 新手安装教程)
Citrix虚拟化之旅三(xen server 新手安装教程)Citrix虚拟化之旅三(xen server 新手安装教程)
Citrix虚拟化之旅三(xen server 新手安装教程)raisinli
 

Destaque (6)

2011 ibm-cmo
2011 ibm-cmo2011 ibm-cmo
2011 ibm-cmo
 
Erp cloud white paper final
Erp cloud white paper finalErp cloud white paper final
Erp cloud white paper final
 
中国云计算发展之道
中国云计算发展之道中国云计算发展之道
中国云计算发展之道
 
Nr crm
Nr crmNr crm
Nr crm
 
2011 IBM全球CIO调研报告
2011 IBM全球CIO调研报告2011 IBM全球CIO调研报告
2011 IBM全球CIO调研报告
 
Citrix虚拟化之旅三(xen server 新手安装教程)
Citrix虚拟化之旅三(xen server 新手安装教程)Citrix虚拟化之旅三(xen server 新手安装教程)
Citrix虚拟化之旅三(xen server 新手安装教程)
 

Semelhante a Idc cloud jobs_white_paper

Innovation and Business Opportunities in Cloud Computing
Innovation and Business Opportunities  in Cloud Computing Innovation and Business Opportunities  in Cloud Computing
Innovation and Business Opportunities in Cloud Computing Software Park Thailand
 
Cloud &amp; Mobile Computing
Cloud &amp; Mobile ComputingCloud &amp; Mobile Computing
Cloud &amp; Mobile ComputingRichard Masters
 
The cloud changing_the_business_ecosystem
The cloud changing_the_business_ecosystemThe cloud changing_the_business_ecosystem
The cloud changing_the_business_ecosystemSantiago Toribio Ayuga
 
Cloud Computing Opportunities for SMEs Towards AEC 2015
Cloud Computing Opportunities for SMEs  Towards AEC 2015Cloud Computing Opportunities for SMEs  Towards AEC 2015
Cloud Computing Opportunities for SMEs Towards AEC 2015Software Park Thailand
 
Private Cloud Landscape in India
Private Cloud Landscape in IndiaPrivate Cloud Landscape in India
Private Cloud Landscape in IndiaEMC Forum India
 
Cloud computing and What It Means for Digital Marketing
Cloud computing and What It Means for Digital MarketingCloud computing and What It Means for Digital Marketing
Cloud computing and What It Means for Digital Marketinggstweet99
 
Technology Trends 2012
Technology Trends 2012Technology Trends 2012
Technology Trends 2012NECIndia
 
Calculating the roi on cloud of cloud tweaks
Calculating the roi on cloud of cloud tweaksCalculating the roi on cloud of cloud tweaks
Calculating the roi on cloud of cloud tweaksdevoteam2
 
Enterprises are facing new challenges that can limit growth.
Enterprises are facing new challenges that can limit growth.Enterprises are facing new challenges that can limit growth.
Enterprises are facing new challenges that can limit growth.IBM India Smarter Computing
 
Technology Trends / AEC 2015 shaping IT workforce
Technology Trends / AEC 2015 shaping IT workforceTechnology Trends / AEC 2015 shaping IT workforce
Technology Trends / AEC 2015 shaping IT workforceIMC Institute
 
JISC RSC Conference 2012 - Consumerisation and the Cloud Opportunity Microsoft
JISC RSC Conference 2012 - Consumerisation and the Cloud Opportunity MicrosoftJISC RSC Conference 2012 - Consumerisation and the Cloud Opportunity Microsoft
JISC RSC Conference 2012 - Consumerisation and the Cloud Opportunity MicrosoftLee Stott
 
NJVC Implementation of Cloud Computing Solutions in Federal Agencies
NJVC Implementation of Cloud Computing Solutions in Federal AgenciesNJVC Implementation of Cloud Computing Solutions in Federal Agencies
NJVC Implementation of Cloud Computing Solutions in Federal AgenciesGovCloud Network
 
The Cloudy Future Of Government IT: Cloud Computing and The Public Sector Aro...
The Cloudy Future Of Government IT: Cloud Computing and The Public Sector Aro...The Cloudy Future Of Government IT: Cloud Computing and The Public Sector Aro...
The Cloudy Future Of Government IT: Cloud Computing and The Public Sector Aro...dannyijwest
 
Impact of cloud computing to Asian IT Industry
Impact of cloud computing  to Asian IT IndustryImpact of cloud computing  to Asian IT Industry
Impact of cloud computing to Asian IT IndustryThanachart Numnonda
 
How cloud computing might evolve.pptx
How cloud computing might evolve.pptxHow cloud computing might evolve.pptx
How cloud computing might evolve.pptxArslan Rao
 

Semelhante a Idc cloud jobs_white_paper (20)

Innovation and Business Opportunities in Cloud Computing
Innovation and Business Opportunities  in Cloud Computing Innovation and Business Opportunities  in Cloud Computing
Innovation and Business Opportunities in Cloud Computing
 
Cloud &amp; Mobile Computing
Cloud &amp; Mobile ComputingCloud &amp; Mobile Computing
Cloud &amp; Mobile Computing
 
The cloud changing_the_business_ecosystem
The cloud changing_the_business_ecosystemThe cloud changing_the_business_ecosystem
The cloud changing_the_business_ecosystem
 
Cloud Computing Opportunities for SMEs Towards AEC 2015
Cloud Computing Opportunities for SMEs  Towards AEC 2015Cloud Computing Opportunities for SMEs  Towards AEC 2015
Cloud Computing Opportunities for SMEs Towards AEC 2015
 
cloud.pptx
cloud.pptxcloud.pptx
cloud.pptx
 
Private Cloud Landscape in India
Private Cloud Landscape in IndiaPrivate Cloud Landscape in India
Private Cloud Landscape in India
 
Cloud Computing and Edge Computing(CTO Kieun Park) - Edge Computing Seminar
Cloud Computing and Edge Computing(CTO Kieun Park) - Edge Computing SeminarCloud Computing and Edge Computing(CTO Kieun Park) - Edge Computing Seminar
Cloud Computing and Edge Computing(CTO Kieun Park) - Edge Computing Seminar
 
Cloud computing and What It Means for Digital Marketing
Cloud computing and What It Means for Digital MarketingCloud computing and What It Means for Digital Marketing
Cloud computing and What It Means for Digital Marketing
 
Technology Trends 2012
Technology Trends 2012Technology Trends 2012
Technology Trends 2012
 
Calculating the roi on cloud of cloud tweaks
Calculating the roi on cloud of cloud tweaksCalculating the roi on cloud of cloud tweaks
Calculating the roi on cloud of cloud tweaks
 
Enterprises are facing new challenges that can limit growth.
Enterprises are facing new challenges that can limit growth.Enterprises are facing new challenges that can limit growth.
Enterprises are facing new challenges that can limit growth.
 
Technology Trends / AEC 2015 shaping IT workforce
Technology Trends / AEC 2015 shaping IT workforceTechnology Trends / AEC 2015 shaping IT workforce
Technology Trends / AEC 2015 shaping IT workforce
 
TOP 10 IDC Predictions 2012
TOP 10 IDC Predictions 2012TOP 10 IDC Predictions 2012
TOP 10 IDC Predictions 2012
 
Cloud Computing
Cloud ComputingCloud Computing
Cloud Computing
 
Eitc Infrastructure outlook 2021
Eitc Infrastructure outlook 2021Eitc Infrastructure outlook 2021
Eitc Infrastructure outlook 2021
 
JISC RSC Conference 2012 - Consumerisation and the Cloud Opportunity Microsoft
JISC RSC Conference 2012 - Consumerisation and the Cloud Opportunity MicrosoftJISC RSC Conference 2012 - Consumerisation and the Cloud Opportunity Microsoft
JISC RSC Conference 2012 - Consumerisation and the Cloud Opportunity Microsoft
 
NJVC Implementation of Cloud Computing Solutions in Federal Agencies
NJVC Implementation of Cloud Computing Solutions in Federal AgenciesNJVC Implementation of Cloud Computing Solutions in Federal Agencies
NJVC Implementation of Cloud Computing Solutions in Federal Agencies
 
The Cloudy Future Of Government IT: Cloud Computing and The Public Sector Aro...
The Cloudy Future Of Government IT: Cloud Computing and The Public Sector Aro...The Cloudy Future Of Government IT: Cloud Computing and The Public Sector Aro...
The Cloudy Future Of Government IT: Cloud Computing and The Public Sector Aro...
 
Impact of cloud computing to Asian IT Industry
Impact of cloud computing  to Asian IT IndustryImpact of cloud computing  to Asian IT Industry
Impact of cloud computing to Asian IT Industry
 
How cloud computing might evolve.pptx
How cloud computing might evolve.pptxHow cloud computing might evolve.pptx
How cloud computing might evolve.pptx
 

Último

trending-flavors-and-ingredients-in-salty-snacks-us-2024_Redacted-V2.pdf
trending-flavors-and-ingredients-in-salty-snacks-us-2024_Redacted-V2.pdftrending-flavors-and-ingredients-in-salty-snacks-us-2024_Redacted-V2.pdf
trending-flavors-and-ingredients-in-salty-snacks-us-2024_Redacted-V2.pdfMintel Group
 
Pitch Deck Teardown: Xpanceo's $40M Seed deck
Pitch Deck Teardown: Xpanceo's $40M Seed deckPitch Deck Teardown: Xpanceo's $40M Seed deck
Pitch Deck Teardown: Xpanceo's $40M Seed deckHajeJanKamps
 
Data Analytics Strategy Toolkit and Templates
Data Analytics Strategy Toolkit and TemplatesData Analytics Strategy Toolkit and Templates
Data Analytics Strategy Toolkit and TemplatesAurelien Domont, MBA
 
Effective Strategies for Maximizing Your Profit When Selling Gold Jewelry
Effective Strategies for Maximizing Your Profit When Selling Gold JewelryEffective Strategies for Maximizing Your Profit When Selling Gold Jewelry
Effective Strategies for Maximizing Your Profit When Selling Gold JewelryWhittensFineJewelry1
 
Cyber Security Training in Office Environment
Cyber Security Training in Office EnvironmentCyber Security Training in Office Environment
Cyber Security Training in Office Environmentelijahj01012
 
1911 Gold Corporate Presentation Apr 2024.pdf
1911 Gold Corporate Presentation Apr 2024.pdf1911 Gold Corporate Presentation Apr 2024.pdf
1911 Gold Corporate Presentation Apr 2024.pdfShaun Heinrichs
 
Memorándum de Entendimiento (MoU) entre Codelco y SQM
Memorándum de Entendimiento (MoU) entre Codelco y SQMMemorándum de Entendimiento (MoU) entre Codelco y SQM
Memorándum de Entendimiento (MoU) entre Codelco y SQMVoces Mineras
 
14680-51-4.pdf Good quality CAS Good quality CAS
14680-51-4.pdf  Good  quality CAS Good  quality CAS14680-51-4.pdf  Good  quality CAS Good  quality CAS
14680-51-4.pdf Good quality CAS Good quality CAScathy664059
 
Traction part 2 - EOS Model JAX Bridges.
Traction part 2 - EOS Model JAX Bridges.Traction part 2 - EOS Model JAX Bridges.
Traction part 2 - EOS Model JAX Bridges.Anamaria Contreras
 
The-Ethical-issues-ghhhhhhhhjof-Byjus.pptx
The-Ethical-issues-ghhhhhhhhjof-Byjus.pptxThe-Ethical-issues-ghhhhhhhhjof-Byjus.pptx
The-Ethical-issues-ghhhhhhhhjof-Byjus.pptxmbikashkanyari
 
Introducing the Analogic framework for business planning applications
Introducing the Analogic framework for business planning applicationsIntroducing the Analogic framework for business planning applications
Introducing the Analogic framework for business planning applicationsKnowledgeSeed
 
Unveiling the Soundscape Music for Psychedelic Experiences
Unveiling the Soundscape Music for Psychedelic ExperiencesUnveiling the Soundscape Music for Psychedelic Experiences
Unveiling the Soundscape Music for Psychedelic ExperiencesDoe Paoro
 
Healthcare Feb. & Mar. Healthcare Newsletter
Healthcare Feb. & Mar. Healthcare NewsletterHealthcare Feb. & Mar. Healthcare Newsletter
Healthcare Feb. & Mar. Healthcare NewsletterJamesConcepcion7
 
Jewish Resources in the Family Resource Centre
Jewish Resources in the Family Resource CentreJewish Resources in the Family Resource Centre
Jewish Resources in the Family Resource CentreNZSG
 
20200128 Ethical by Design - Whitepaper.pdf
20200128 Ethical by Design - Whitepaper.pdf20200128 Ethical by Design - Whitepaper.pdf
20200128 Ethical by Design - Whitepaper.pdfChris Skinner
 
Go for Rakhi Bazaar and Pick the Latest Bhaiya Bhabhi Rakhi.pptx
Go for Rakhi Bazaar and Pick the Latest Bhaiya Bhabhi Rakhi.pptxGo for Rakhi Bazaar and Pick the Latest Bhaiya Bhabhi Rakhi.pptx
Go for Rakhi Bazaar and Pick the Latest Bhaiya Bhabhi Rakhi.pptxRakhi Bazaar
 
business environment micro environment macro environment.pptx
business environment micro environment macro environment.pptxbusiness environment micro environment macro environment.pptx
business environment micro environment macro environment.pptxShruti Mittal
 
Onemonitar Android Spy App Features: Explore Advanced Monitoring Capabilities
Onemonitar Android Spy App Features: Explore Advanced Monitoring CapabilitiesOnemonitar Android Spy App Features: Explore Advanced Monitoring Capabilities
Onemonitar Android Spy App Features: Explore Advanced Monitoring CapabilitiesOne Monitar
 

Último (20)

trending-flavors-and-ingredients-in-salty-snacks-us-2024_Redacted-V2.pdf
trending-flavors-and-ingredients-in-salty-snacks-us-2024_Redacted-V2.pdftrending-flavors-and-ingredients-in-salty-snacks-us-2024_Redacted-V2.pdf
trending-flavors-and-ingredients-in-salty-snacks-us-2024_Redacted-V2.pdf
 
Pitch Deck Teardown: Xpanceo's $40M Seed deck
Pitch Deck Teardown: Xpanceo's $40M Seed deckPitch Deck Teardown: Xpanceo's $40M Seed deck
Pitch Deck Teardown: Xpanceo's $40M Seed deck
 
Data Analytics Strategy Toolkit and Templates
Data Analytics Strategy Toolkit and TemplatesData Analytics Strategy Toolkit and Templates
Data Analytics Strategy Toolkit and Templates
 
Effective Strategies for Maximizing Your Profit When Selling Gold Jewelry
Effective Strategies for Maximizing Your Profit When Selling Gold JewelryEffective Strategies for Maximizing Your Profit When Selling Gold Jewelry
Effective Strategies for Maximizing Your Profit When Selling Gold Jewelry
 
Cyber Security Training in Office Environment
Cyber Security Training in Office EnvironmentCyber Security Training in Office Environment
Cyber Security Training in Office Environment
 
WAM Corporate Presentation April 12 2024.pdf
WAM Corporate Presentation April 12 2024.pdfWAM Corporate Presentation April 12 2024.pdf
WAM Corporate Presentation April 12 2024.pdf
 
1911 Gold Corporate Presentation Apr 2024.pdf
1911 Gold Corporate Presentation Apr 2024.pdf1911 Gold Corporate Presentation Apr 2024.pdf
1911 Gold Corporate Presentation Apr 2024.pdf
 
Memorándum de Entendimiento (MoU) entre Codelco y SQM
Memorándum de Entendimiento (MoU) entre Codelco y SQMMemorándum de Entendimiento (MoU) entre Codelco y SQM
Memorándum de Entendimiento (MoU) entre Codelco y SQM
 
14680-51-4.pdf Good quality CAS Good quality CAS
14680-51-4.pdf  Good  quality CAS Good  quality CAS14680-51-4.pdf  Good  quality CAS Good  quality CAS
14680-51-4.pdf Good quality CAS Good quality CAS
 
The Bizz Quiz-E-Summit-E-Cell-IITPatna.pptx
The Bizz Quiz-E-Summit-E-Cell-IITPatna.pptxThe Bizz Quiz-E-Summit-E-Cell-IITPatna.pptx
The Bizz Quiz-E-Summit-E-Cell-IITPatna.pptx
 
Traction part 2 - EOS Model JAX Bridges.
Traction part 2 - EOS Model JAX Bridges.Traction part 2 - EOS Model JAX Bridges.
Traction part 2 - EOS Model JAX Bridges.
 
The-Ethical-issues-ghhhhhhhhjof-Byjus.pptx
The-Ethical-issues-ghhhhhhhhjof-Byjus.pptxThe-Ethical-issues-ghhhhhhhhjof-Byjus.pptx
The-Ethical-issues-ghhhhhhhhjof-Byjus.pptx
 
Introducing the Analogic framework for business planning applications
Introducing the Analogic framework for business planning applicationsIntroducing the Analogic framework for business planning applications
Introducing the Analogic framework for business planning applications
 
Unveiling the Soundscape Music for Psychedelic Experiences
Unveiling the Soundscape Music for Psychedelic ExperiencesUnveiling the Soundscape Music for Psychedelic Experiences
Unveiling the Soundscape Music for Psychedelic Experiences
 
Healthcare Feb. & Mar. Healthcare Newsletter
Healthcare Feb. & Mar. Healthcare NewsletterHealthcare Feb. & Mar. Healthcare Newsletter
Healthcare Feb. & Mar. Healthcare Newsletter
 
Jewish Resources in the Family Resource Centre
Jewish Resources in the Family Resource CentreJewish Resources in the Family Resource Centre
Jewish Resources in the Family Resource Centre
 
20200128 Ethical by Design - Whitepaper.pdf
20200128 Ethical by Design - Whitepaper.pdf20200128 Ethical by Design - Whitepaper.pdf
20200128 Ethical by Design - Whitepaper.pdf
 
Go for Rakhi Bazaar and Pick the Latest Bhaiya Bhabhi Rakhi.pptx
Go for Rakhi Bazaar and Pick the Latest Bhaiya Bhabhi Rakhi.pptxGo for Rakhi Bazaar and Pick the Latest Bhaiya Bhabhi Rakhi.pptx
Go for Rakhi Bazaar and Pick the Latest Bhaiya Bhabhi Rakhi.pptx
 
business environment micro environment macro environment.pptx
business environment micro environment macro environment.pptxbusiness environment micro environment macro environment.pptx
business environment micro environment macro environment.pptx
 
Onemonitar Android Spy App Features: Explore Advanced Monitoring Capabilities
Onemonitar Android Spy App Features: Explore Advanced Monitoring CapabilitiesOnemonitar Android Spy App Features: Explore Advanced Monitoring Capabilities
Onemonitar Android Spy App Features: Explore Advanced Monitoring Capabilities
 

Idc cloud jobs_white_paper

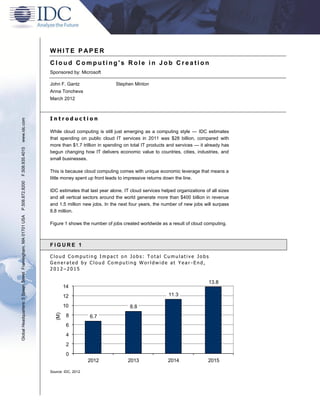
  • 1. WHITE P APER Cloud Computing's Role in Job Creation Sponsored by: Microsoft John F. Gantz Stephen Minton Anna Toncheva March 2012 Introduction www.idc.com While cloud computing is still just emerging as a computing style — IDC estimates that spending on public cloud IT services in 2011 was $28 billion, compared with more than $1.7 trillion in spending on total IT products and services — it already has F.508.935.4015 begun changing how IT delivers economic value to countries, cities, industries, and small businesses. This is because cloud computing comes with unique economic leverage that means a little money spent up front leads to impressive returns down the line. P.508.872.8200 IDC estimates that last year alone, IT cloud services helped organizations of all sizes and all vertical sectors around the world generate more than $400 billion in revenue and 1.5 million new jobs. In the next four years, the number of new jobs will surpass 8.8 million. Global Headquarters: 5 Speen Street Framingham, MA 01701 USA Figure 1 shows the number of jobs created worldwide as a result of cloud computing. FIGURE 1 Cloud Computing Impact on Jobs: Total Cumulative Jobs Generated by Cloud Computing Worldwide at Year -End, 2012–2015 13.8 14 12 11.3 10 8.8 (M) 8 6.7 6 4 2 0 2012 2013 2014 2015 Source: IDC, 2012
  • 2. This White Paper, commissioned by Microsoft, examines the impact cloud computing will have on employment around the world — by region, country, enterprise size class, and industry. It follows on research IDC has conducted on the economic impact of cloud computing since 2009 and the economic impact of IT since 2002. The Economic Leverage of Cloud Computing Cloud computing comes in many forms, from the use of third-party resources to store data to delivery of IT services within an enterprise based on virtualized infrastructure, self configuration, and automated provisioning. The former is an example of "public" 1 cloud computing; the latter is an example of "private" cloud computing. For four years now, IDC has been estimating the economic impact of public IT cloud services by taking conservative estimates of the degree to which they could increase IT innovation and then estimating the revenue and potential jobs driven by that innovation. The following factors play into that equation:  IDC estimates that, worldwide, 75% of IT spending is tied up with maintenance of legacy systems and routine upgrades, or "legacy drag." Cloud computing allows IT organizations to shift some of that legacy work to the cloud, freeing up budget to invest in IT innovation that supports business innovation.  Lower IT and business process costs driven by the economies of scale in infrastructure and talent of cloud computing also free up funds for new business investment.  The ratio of IT spending as a percentage of revenue is small for most organizations — 1% to 4%, generally. Conversely, business revenue, when driven by innovative IT, can be a significant multiple of IT investment. For this study, IDC expanded on earlier work by extending the analysis to include spending on private cloud services. In general, the payoff may not be as big because internally provided cloud services may be involved with legacy systems, but in some cases not. For example, in emerging geographies where adoption of public IT cloud services is not that far along and where the demands of legacy systems are less, private cloud services may offer greater economic benefit in the short term than public cloud services. As a result of extending this earlier work:  Increased business revenue from the IT innovation enabled by cloud could reach $1.1 trillion a year by 2015 across the countries studied.  IDC estimates that spending on public and private IT cloud services will generate nearly 14 million jobs worldwide by 2015. 1 IDC's definition of cloud computing can be found at http://blogs.idc.com/ie/?p=422. 2 #233532 ©2012 IDC
  • 3.  More than 50% of those jobs will accrue to small and medium-sized businesses, and more than 1 million jobs each will accrue to the banking, communications, and discrete manufacturing industries.  A majority of these jobs will be found in emerging markets because of their immense workforces — 1.2 billion workers in China and India alone. The Jobs Created The basic rationale for job growth is that IT innovation allows for business innovation, which leads to business revenue, which leads to job creation — a premise that is not 2 unique to this study. To create a model that analyzes the role of cloud in job creation, IDC calculated the number of cloud-generated jobs by weighing several factors, including available country workforce, unemployment rates, GDP, IT spend by industry and company size, industry mix by country and city, technology infrastructure by country and city, regulatory environment, and other factors. Much of this methodology is explained in the ensuing pages of this White Paper. In the IDC analysis, since the jobs created are the result of increased business revenue, we assume they match the industry mix by job function — marketing, sales, finance and administration, production, service, and so on. We also consider them net of jobs lost to cloud computing (e.g., in the IT organization itself). In discussions we have had with CIOs testing and experimenting with cloud computing, we find that most look at migration to cloud computing as a way to free up existing resources to work on more innovative projects, not to do away with the positions entirely. In that way, cloud computing differs from traditional outsourcing. On the other hand, cloud computing could certainly change the skills requirements in an IT organization. Jobs by Segment By enterprise size class, the jobs will be split fairly evenly between companies with fewer than 500 employees and companies with 500+ employees, as shown in Figure 2. 2 See, for example, the work of Professor Federico Etro of the University of Milan (http://www.intertic.org/Policy%20Papers/CC.pdf). ©2012 IDC #233532 3
  • 4. FIGURE 2 Cloud Jobs by Size Class: Total Cumulative Jobs Generated by Cloud Computing Worldwide, 2012–2015 8 7.5 7 6.3 6.1 6 5.1 5 4.7 4 (M) 4 3.6 3.1 3 2 1 0 2012 2013 2014 2015 SMEs (<500) Enterprise (500+) Source: IDC, 2012 In most geographies, organizations with fewer than 500 employees account for a majority of total employment — more than 70% in some cases — but at the same time, they account for only a third of IT spending. This lower level of automation means that jobs created as a result of deploying IT cloud services won't mirror workforce size class segmentation. At the same time, IDC believes that small and medium-sized companies — at least those with computers — will adopt cloud IT services faster than larger companies. A number of factors play into this:  The degree of "legacy drag" is less for smaller firms than larger firms.  Capital constraints make public IT cloud services more attractive to smaller firms than larger firms but also limit investments in private IT cloud services.  The concentration of small firms varies by industry, which will affect IT cloud service adoption. The final distribution of cloud-generated jobs, therefore, is the result of an equation with offsetting elements — high percentage of employment, low percentage of IT spending, higher-than-average public IT cloud service adoption by computerized firms. Jobs by Industry By industry, the jobs to some extent mirror the industries by size, but not entirely. In research conducted in 2010, IDC found that adoption of IT cloud services varied greatly by industry. For instance, professional services firms spent nearly five times 4 #233532 ©2012 IDC
  • 5. as much on public IT cloud services as a percentage of IT spending as the government and nearly two-and-a-half times as much as utility companies. FIGURE 3 Cloud Computing "Intensity": U.S. Spending on Public IT Cloud Services as a Percentage of IT Spending, 2011 Prof essional services Insurance Transportation Construction Education Process manuf acturing Securities and investment services Retail Resource industries Banking Total Discrete manuf acturing Communications and media Healthcare Wholesale Utilities Government 0 1 2 3 4 5 6 (% ) Source: U.S. Public IT Cloud Services by Industry, IDC #226222, December 2010 ©2012 IDC #233532 5
  • 6. The reasons for this difference in adoption of public IT cloud services by industry are complex. In some cases, the preponderance of small and medium-sized companies in a sector — for example, professional services and retail — will drive up adoption. In other cases, security issues will slow adoption in sectors, such as banking, that may typically be high users of IT. At the same time, they might increase adoption of private IT cloud services. Some specific insights from the document cited above are as follows:  Securities and investment services, typically early adopters of new technologies, are expected to be ahead of the average in the adoption of public IT cloud services as well. This should hold true across all geographies because of the global nature of the market.  Banking, on the other hand, because of regulation, privacy concerns, and security issues will be closer to the average, despite being a traditional early adopter of technology. On the other hand, banking will be an investor in private IT cloud services. There may be more variation across geographies depending on the concentration of small lenders and banks.  Insurance, generally less constrained by regulation than banking and yet a heavy user of IT, is already toward the top of the list in spending on public cloud services as a percentage of IT spending. On the other hand, it's one of the slower growth sectors in both IT and IT cloud services spending, with larger organizations slower to adopt cloud solutions than smaller organizations.  Professional services, a large sector in itself, is a sweet spot of public IT cloud services spending because it contains a multitude of information-dependent midsize companies that will adopt software-as-a-service components of cloud computing, not to mention large services companies adopting infrastructure as a service. This holds true across geographies — to the extent that the firms in this sector spend on IT at all.  Communications and media will run below the overall average in terms of spending on cloud services as a percentage of IT spending but will be a large — and fast-growing — sector when it comes to jobs. IDC expects the media segment to be one of the main users of storage on demand as a service to enable continuous service for content-heavy customer offerings. This sector already accounts for 20% of spending on public cloud storage in the United States. IDC expects this to hold true across geographies.  Healthcare is expected to be a little slow in adoption of public IT cloud services as a result of regulation, security issues, and "legacy drag," but healthcare reform and the rise of connected healthcare will lead providers toward the public cloud for specific functions such as email and portal development. Many of the countries studied have initiatives under way similar to those in the United States for electronic medical records, which are tailor-made for public IT cloud services. Healthcare will also adopt private IT services, but much of this may still be aimed at making legacy systems more efficient, not at new business initiatives. 6 #233532 ©2012 IDC
  • 7.  The education sector, a small vertical but with better-than-average cloud-related job growth, will see IT cloud services as an attractive way to deal with budget constraints. Many are worried about being locked into a single cloud vendor, but in many developed countries, they may find cloud computing is still a good way to face budget cuts. In less financially constrained geographies, IT cloud services will offer standardization and lower capital costs of expansion.  The manufacturing sector, even in developed countries, has a high percentage of small businesses, and adoption of cloud-based technologies is a viable way to simplify software management, improve service levels, and reduce capital costs. Thus far, customer relationship management (CRM) and collaboration have been the most popular cloud-based services in this sector. Over time, application development services and storage services will grow as manufacturers deal with infrastructure costs related to the growing use of digital models and virtual product testing. Process manufacturing has a higher percentage of IT spending devoted to IT cloud services today than discrete manufacturing, but that difference will narrow by 2015.  Like manufacturing, resource industries have a high concentration of small businesses and fewer security and regulatory constraints than many industries but just an average level of spending on IT cloud services as a percentage of IT spending. What's more, worldwide, the sector is not particularly fast growing in either IT spending or cloud-related jobs.  The retail sector, with lots of small businesses, relatively free of regulatory concerns, and with records and documents easily stored in the cloud and despite generally being slow to adopt new technologies, has been an early adopter of cloud computing. This may be abetted by a smaller sunk investment in legacy infrastructure compared with many other sectors.  Utility companies, low on the vertical "intensity" scale, have traditionally been late adopters of IT, and IDC expects the same in adoption of IT cloud services. Regulated in many areas of operation, they have less competitive pressure to drive new revenue through IT than many other vertical industries. What investments they make may be heavier on the private IT cloud services side since these investments can be folded into capital budgets. This will change over time with the development of smart grids, optimized consumption models, and retail energy marketing, but not fast enough for the segment to rise faster than other industries.  Government adoption of IT cloud services will be quite heterogeneous. We would expect to see more private IT cloud services at the federal level as large agencies offer services for their smaller entities, although services such as email, portal development, and collaboration will migrate to public IT cloud services. State, provincial, and local governments will be more likely candidates for public IT cloud services. Combine this varying intensity based on industry dynamics with varying sizes of the industries studied for this White Paper and you get some big differences by industry in cloud-related jobs, as seen in Table 1. ©2012 IDC #233532 7
  • 8. TABLE 1 Worldwide Cloud-Generated Jobs, 2012–2015 Selected 2012 Through Vertical 2012 2013 2014 2015 2015 CAGR (%) Banking 735,126 945,381 1,192,592 1,425,402 27.4 Communications 1,048,965 1,385,577 1,859,267 2,416,457 31.6 and media Discrete 631,497 818,679 1,054,258 1,308,262 28.8 manufacturing Education 347,598 452,584 580,606 723,671 29.0 Government 271,039 343,236 427,316 513,202 26.3 Healthcare 183,056 234,325 295,887 356,453 26.3 Insurance 344,057 442,562 559,401 673,440 27.7 Process 446,681 564,700 706,593 854,342 25.9 manufacturing Resource 127,719 171,886 229,344 296,547 32.7 industries Retail 351,486 440,404 540,495 639,281 24.2 Subtotal 4,487,223 5,799,334 7,445,760 9,207,056 28.5 All other 2,244,982 2,954,636 3,804,666 4,632,974 29.6 industries Total 6,732,204 8,753,969 11,250,426 13,840,030 28.8 Note: Public and private/hybrid cloud jobs are included. Source: IDC, 2012 For instance, note that banking and communications are not particularly early adopters of cloud computing, but they each will have more than 1 million cloud- related jobs by 2015. This is because they are big segments and spend a lot on IT. The government, on the other hand, which is the largest of the enumerated sectors when it comes to IT spending, is just middle of the pack in cloud-related jobs because of its slow pace adopting the new computing style. 8 #233532 ©2012 IDC
  • 9. Jobs by Geography: Overview The data tables that accompany this document show cloud-generated jobs by region, country, and select metropolitan areas in the United States and Canada. The factors determining the number of jobs that might be created in a particular geography are numerous and include:  The current and projected level of spending on IT  Current and projected spending on IT cloud services  IT as a percentage of GDP or output (i.e., the degree of current automation)  Percentage of IT work done on legacy systems and routine upgrades  Workforce levels by industry and/or size class  Economic base by industry and/or size class  The ratio of private IT cloud services spending to public IT cloud services spending For instance, in the U.S. metropolitan area splits, New York accounted for just over 9% of the U.S. cloud-generated jobs in 2011, yet only 6% of the U.S. workforce. But the workforce in New York is more concentrated in banking, communications, securities, and professional services than the workforces in most other cities, which increases New York's share of U.S. cloud-related jobs. Washington, D.C., on the other hand, has a higher concentration of government workers than many other cities, so while it commands more than 2% of the U.S. workforce, it accounts for less than 2% of the U.S. cloud-generated jobs. Because of the relatively high level of computerization in the United States and Canada, variations in share of total U.S. or Canada jobs of a designated market area (DMA) compared with overall employment are driven mostly by industry differentiation; there is some differentiation by IT spending level. By region, however, the differences are more subtle. Between emerging and developed countries, the numbers are driven more by the degree of IT spending and adoption levels of cloud, public and private, than industry makeup. ©2012 IDC #233532 9
  • 10. By Major Region The distribution of cloud-related jobs by region is a mix of employment by region crossed by investment in IT cloud services by region. The dynamics by major region are as follows:  North America (defined by IDC as the United States and Canada) is driven by the high adoption rate of IT cloud services in the United States. According to IDC's regional forecast, the United States accounted for 62% of worldwide spending for public IT cloud services last year, compared with 35% of worldwide IT spending. Canada, on the other hand will be a much slower adopter of public IT cloud services and therefore a more aggressive adopter of private IT cloud services. Coming from a smaller base, though, cloud-generated jobs will grow 50% faster in Canada than in the United States. Despite the region's high aggregate share of spending on IT cloud services, it will have the lowest total number of cloud- generated jobs in 2015. This is because it has the smallest workforce and a high "legacy drag" for both public and private cloud services.  EMEA, a complex mix of developed and emerging countries, has more cloud- created jobs than North America primarily because of its workforce, which is nearly four times as large. Last year, EMEA's spending in public IT cloud services was 40% of North America's, but its investment in private cloud was equal to or more than that of North America. This, coupled with the larger workforce, drove cloud-created jobs higher than North America.  Asia/Pacific, except for a few small countries that account for only about 5% of the total workforce, is dominated by two countries in terms of job creation — China and India. The region is a more aggressive adopter of public IT cloud services than one might think, accounting for 12% of such services worldwide (compared with 25% of IT spending). In addition, the region has two other factors in favor of cloud-based job creation: (1) infrastructure challenges will help spur investment in private IT cloud services, and (2) in such an emerging market, spending on IT cloud services will be subject to less "legacy drag" than in developing regions. But, of course, the primary reason for such high job numbers is the immense workforce in the region. Figure 4 compares the regions in total cloud-created jobs in 2015. For context, we have broken out China and India from the rest of Asia/Pacific. 10 #233532 ©2012 IDC
  • 11. FIGURE 4 Cloud Computing Jobs by Region: Total Cumulative Jobs Generated by Cloud Computing Worldwide at Year -End 2015 7 6.75 6 5 4 (M) 2.87 3 2.07 2 1.17 1 0 North America EMEA Asia/Pacif ic* China and India * Except China and India Source: IDC, 2012 U.S. Metropolitan Areas Part of this study was to develop a picture of cloud-generated job creation in 13 major metropolitan areas, also called designated market areas (DMAs). As with countries and regions, this was primarily an exercise in understanding IT spending by vertical in each DMA, the potential for spending on both public and private cloud computing, and the dynamics of the local economy. For the most part, the cloud jobs created in each DMA are proportional to the DMA's share of the U.S. total workforce, but not exactly. Figure 5 shows how each DMA varies from its share of the U.S. workforce. ©2012 IDC #233532 11
  • 12. FIGURE 5 Cloud Jobs Versus Total Jobs: Percent of U.S. Cloud -Generated Jobs – Percent of Total U.S. Workforce Atlanta Boston Chicago Dallas Denver Detroit Houston Los Angeles Minneapolis New York Philadelphia Phoenix Washington, D.C. -0.5 0.0 0.5 1.0 1.5 2.0 2.5 3.0 3.5 (%) Source: IDC, 2012 These differences are the result of three factors: (1) IT spending less than or more than the DMA's share of the U.S. workforce, (2) its mix of spending on public and private cloud, and (3) its industry mix (refer back to Figure 3). For example, by DMA:  Atlanta: While this DMA's vertical industry set is less public cloud intense than the United States as a whole (e.g., higher on utilities and lower on professional services), its IT spending and investment in private IT cloud services are above the U.S. average, making its share of U.S. cloud-related jobs higher than its share of the U.S. workforce.  Boston: The vertical industry mix is such that this DMA has the same public cloud intensity as the United States — its educational and financial sectors are offset by the healthcare and government sectors — but its general level of computerization is high, driving its share of cloud-created jobs higher than its share of the U.S. workforce. 12 #233532 ©2012 IDC
  • 13.  Chicago: IT spending and spending on cloud services are higher as a percentage of the U.S. total than its share of workforce, and the vertical mix is more cloud intense than the U.S. as a whole (higher in banking, professional services, process manufacturing, etc.).  Dallas: While this DMA's vertical makeup is a little less cloud intense than the U.S. average (lower professional services) and its investment in private cloud services will lag some of the other DMAs, its level of computerization compared to its workforce is enough to drive its share of cloud-created jobs up to its share of the U.S. workforce.  Denver: The same dynamic is at work for Denver as for Dallas, except Denver's investment in private cloud IT services will be higher and its vertical "intensity" lower, primarily because of an unusually large communications and media sector.  Detroit: Jobs created by cloud computing are a smaller share of the U.S. total than this DMA's workforce is of the U.S. workforce. This is the result of lower- than-average vertical intensity (more retail and utilities, fewer professional and financial services) and lower investment in private IT cloud services.  Houston: Although the vertical mix in this DMA is a little different, the general dynamics are the same as those of Dallas.  Los Angeles: This DMA has a share of U.S. cloud-generated jobs a little ahead of its share of the total workforce despite a mix of vertical industries that will adopt cloud computing more slowly than the U.S. average (particularly communications and media). This is because of a better-than-average expected investment in private cloud computing and an IT spending per employee that is higher than the U.S. average.  Minneapolis: In this DMA, cloud-created jobs are a lower percentage of total U.S. cloud jobs than the Minneapolis workforce is of the total U.S. workforce, mostly because of lower-than-average investment in private IT cloud services. In its vertical mix, cloud-intense verticals and verticals that aren't cloud-intense balance each other to make the total mix about the same as the United States in vertical intensity.  New York: Almost all factors that would increase this DMA's share of cloud- created jobs beyond its share of the total U.S. workforce are at play: verticals heavy in financial and professional services and lower in utilities and discrete manufacturing, higher-than-average investment in private IT cloud services, and a general level of IT spending much higher than share of the total U.S. workforce.  Philadelphia: Although this DMA has a good mix of verticals, especially professional services, education, and process manufacturing, its level of IT spending as a percentage of total U.S. spending is lower than its share of the total U.S. workforce, dragging its cloud jobs below its share of the U.S. workforce. ©2012 IDC #233532 13
  • 14.  Phoenix: This DMA's vertical mix is a story of cloud-intense industries (e.g., professional services, banking) being cancelled out by non-cloud-intense industries (e.g., discrete manufacturing) and lower-than-average investment in private IT cloud services. Combined, these factors drop the DMA's share of cloud-created jobs below its share of all U.S. jobs.  Washington, D.C.: Although this DMA has a higher-than-average investment in private IT cloud services than many of the other DMAs, its vertical mix (high government, high communications and media) helps drive its share of U.S. cloud-created jobs below its share of all U.S. jobs. CONCLUSIONS The study results seem to indicate one of the beauties of cloud computing — it frees enterprises from the constraints of the client/server model, where up-front investments in infrastructure are required to pursue technological solutions to business problems. Emerging markets, small cities, and small businesses have as much access to the benefits of cloud computing as large enterprises or developed nations. The availability of private IT cloud services as an option where public cloud IT services are not fully available or where there are infrastructure challenges is a nice hedge for emerging markets. Beyond this, and not measured in this study, is the use that cloud computing can be put to beyond mere capital cost avoidance. Organizations large and small can host their own cloud services for their own customers. IT cloud services can support other industry services offered in the cloud, from egovernment and online health records to product development and design, logistics, and billing. And here may be an even bigger payoff for local economies than the adoption of IT cloud services alone. Copyright Notice External Publication of IDC Information and Data — Any IDC information that is to be used in advertising, press releases, or promotional materials requires prior written approval from the appropriate IDC Vice President or Country Manager. A draft of the proposed document should accompany any such request. IDC reserves the right to deny approval of external usage for any reason. Copyright 2012 IDC. Reproduction without written permission is completely forbidden. 14 #233532 ©2012 IDC