
Recommended
Recommended
More Related Content
Similar to How Analytics Has Changed in the Last 10 Years (and How It’s Staye.docx
Similar to How Analytics Has Changed in the Last 10 Years (and How It’s Staye.docx (20)
More from pooleavelina
More from pooleavelina (20)
Recently uploaded
Recently uploaded (20)
How Analytics Has Changed in the Last 10 Years (and How It’s Staye.docx
- 1. How Analytics Has Changed in the Last 10 Years (and How It’s Stayed the Same) · Thomas H. Davenport June 22, 2017 · Summary · Save · Share · Comment · Print · 8.95Buy Copies Recommended · Blockchain: Tools for Preparing Your Team for the Future Book 49.95 View Details · Clean Edge Razor: Splitting Hairs in Product Positioning HBS Brief Case 8.95 View Details · Deutsche Allgemeinversicherung Photo by Ferdinand Stöhr Ten years ago, Jeanne Harris and I published the book Competing on Analytics, and we’ve just finished updating it for publication in September. One major reason for the update is that analytical technology has changed dramatically over the last decade; the sections we wrote on those topics have become woefully out of date. So revising our book offered us a chance to take stock of 10 years of change in analytics. Of course, not everything is different. Some technologies from a decade ago are still in broad use, and I’ll describe them here too. There has been even more stability in analytical leadership, change management, and culture, and in many cases those remain the toughest problems to address. But we’re here to talk
- 2. about technology. Here’s a brief summary of what’s changed in the past decade. The last decade, of course, was the era of big data. New data sources such as online clickstreams required a variety of new hardware offerings on premise and in the cloud, primarily involving distributed computing — spreading analytical calculations across multiple commodity servers — or specialized data appliances. Such machines often analyze data “in memory,” which can dramatically accelerate times-to- answer. Cloud-based analytics made it possible for organizations to acquire massive amounts of computing power for short periods at low cost. Even small businesses could get in on the act, and big companies began using these tools not just for big data but also for traditional small, structured data. Insight Center · Putting Data to Work Analytics are critical to companies’ performance. Along with the hardware advances, the need to store and process big data in new ways led to a whole constellation of open source software, such as Hadoop and scripting languages. Hadoop is used to store and do basic processing on big data, and it’s typically more than an order of magnitude cheaper than a data warehouse for similar volumes of data. Today many organizations are employing Hadoop-based data lakes to store different types of data in their original formats until they need to be structured and analyzed. Since much of big data is relatively unstructured, data scientists created ways to make it structured and ready for statistical analysis, with new (and old) scripting languages like Pig, Hive, and Python. More-specialized open source tools, such as Spark for streaming data and R for statistics, have also gained substantial popularity. The process of acquiring and using open source software is a major change in itself for established businesses. The technologies I’ve mentioned for analytics thus far are primarily separate from other types of systems, but many
- 3. organizations today want and need to integrate analytics with their production applications. They might draw from CRM systems to evaluate the lifetime value of a customer, for example, or optimize pricing based on supply chain systems about available inventory. In order to integrate with these systems, a component-based or “microservices” approach to analytical technology can be very helpful. This involves small bits of code or an API call being embedded into a system to deliver a small, contained analytical result; open source software has abetted this trend. Related Video The Explainer: Big Data and Analytics <span>What the two terms really mean -- and how to effectively use each.</span> · Save · Share See More Videos > This embedded approach is now used to facilitate “analytics at the edge” or “streaming analytics.” Small analytical programs running on a local microprocessor, for example, might be able to analyze data coming from drill bit sensors in an oil well drill and tell the bit whether to speed up or slow down. With internet of things data becoming popular in many industries, analyzing data near the source will become increasingly important, particularly in remote geographies where telecommunications constraints might limit centralization of data. Another key change in the analytics technology landscape involves autonomous analytics — a form of artificial intelligence or cognitive technology. Analytics in the past were created for human decision makers, who considered the output and made the final decision. But machine learning technologies can take the next step and actually make the decision or adopt the recommended action. Most cognitive technologies are statistics-based at their core, and they can dramatically improve the productivity and effectiveness of data analysis. Of course, as is often the case with information technology, the
- 4. previous analytical technologies haven’t gone away — after all, mainframes are still humming away in many companies. Firms still use statistics packages, spreadsheets, data warehouses and marts, visual analytics, and business intelligence tools. Most large organizations are beginning to explore open source software, but they still use substantial numbers of proprietary analytics tools as well. It’s often the case, for example, that it’s easier to acquire specialized analytics solutions — say, for anti-money laundering analysis in a bank — than to build your own with open source. In data storage there are similar open/proprietary combinations. Structured data in rows and columns requiring security and access controls can remain in data warehouses, while unstructured/prestructured data resides in a data lake. Of course, the open source software is free, but the people who can work with open source tools may be more expensive than those who are capable with proprietary technologies. The change in analytics technologies has been rapid and broad. There’s no doubt that the current array of analytical technologies is more powerful and less expensive than the previous generation. It enables companies to store and analyze both far more data and many different types of it. Analyses and recommendations come much faster, approaching real time in many cases. In short, all analytical boats have risen. However, these new tools are also more complex and in many cases require higher levels of expertise to work with. As analytics has grown in importance over the last decade, the commitments that organizations must make to excel with it have also grown. Because so many companies have realized that analytics are critical to their business success, new technologies haven’t necessarily made it easier to become — and remain — an analytical competitor. Using state-of-the-art analytical technologies is a prerequisite for success, but their widespread availability puts an increasing premium on nontechnical factors like analytical leadership, culture, and strategy.
- 5. What’s Your Data Strategy? · Leandro DalleMule · Thomas H. Davenport From the May–June 2017 Issue · Summary · Save · Share · Comment · Print · 8.95Buy Copies View more from the May–June 2017 Issue Explore the Archive More than ever, the ability to manage torrents of data is critical to a company’s success. But even with the emergence of data- management functions and chief data officers (CDOs), most companies remain badly behind the curve. Cross-industry studies show that on average, less than half of an organization’s structured data is actively used in making decisions—and less than 1% of its unstructured data is analyzed or used at all. More than 70% of employees have access to data they should not, and 80% of analysts’ time is spent simply discovering and preparing data. Data breaches are common, rogue data sets propagate in silos, and companies’ data technology often isn’t up to the demands put on it. Having a CDO and a data-management function is a start, but neither can be fully effective in the absence of a coherent strategy for organizing, governing, analyzing, and deploying an organization’s information assets. Indeed, without such strategic management many companies struggle to protect and leverage their data—and CDOs’ tenures are often difficult and short (just 2.4 years on average, according to Gartner). In this article we describe a new framework for building a robust data strategy that can be applied across industries and levels of data maturity. The framework draws on our implementation
- 6. experience at the global insurer AIG (where DalleMule is the CDO) and our study of half a dozen other large companies where its elements have been applied. The strategy enables superior data management and analytics—essential capabilities that support managerial decision making and ultimately enhance financial performance. The “plumbing” aspects of data management may not be as sexy as the predictive models and colorful dashboards they produce, but they’re vital to high performance. As such, they’re not just the concern of the CIO and the CDO; ensuring smart data management is the responsibility of all C-suite executives, starting with the CEO. Defense Versus Offense Our framework addresses two key issues: It helps companies clarify the primary purpose of their data, and it guides them in strategic data management. Unlike other approaches we’ve seen, ours requires companies to make considered trade-offs between “defensive” and “offensive” uses of data and between control and flexibility in its use, as we describe below. Although information on enterprise data management is abundant, much of it is technical and focused on governance, best practices, tools, and the like. Few if any data-management frameworks are as business-focused as ours: It not only promotes the efficient use of data and allocation of resources but also helps companies design their data-management activities to support their overall strategy. Data defense and offense are differentiated by distinct business objectives and the activities designed to address them. Data defense is about minimizing downside risk. Activities include ensuring compliance with regulations (such as rules governing data privacy and the integrity of financial reports), using analytics to detect and limit fraud, and building systems to prevent theft. Defensive efforts also ensure the integrity of data flowing through a company’s internal systems by identifying, standardizing, and governing authoritative data sources, such as fundamental customer and supplier information or sales data, in
- 7. a “single source of truth.” Data offense focuses on supporting business objectives such as increasing revenue, profitability, and customer satisfaction. It typically includes activities that generate customer insights (data analysis and modeling, for example) or integrate disparate customer and market data to support managerial decision making through, for instance, interactive dashboards. Offensive activities tend to be most relevant for customer- focused business functions such as sales and marketing and are often more real-time than is defensive work, with its concentration on legal, financial, compliance, and IT concerns. (An exception would be data fraud protection, in which seconds count and real-time analytics smarts are critical.) Every company needs both offense and defense to succeed, but getting the balance right is tricky. In every organization we’ve talked with, the two compete fiercely for finite resources, funding, and people. As we shall see, putting equal emphasis on the two is optimal for some companies. But for many others it’s wiser to favor one or the other. Some company or environmental factors may influence the direction of data strategy: Strong regulation in an industry (financial services or health care, for example) would move the organization toward defense; strong competition for customers would shift it toward offense. The challenge for CDOs and the rest of the C-suite is to establish the appropriate trade-offs between defense and offense and to ensure the best balance in support of the company’s overall strategy. Decisions about these trade-offs are rooted in the fundamental dichotomy between standardizing data and keeping it more flexible. The more uniform data is, the easier it becomes to execute defensive processes, such as complying with regulatory requirements and implementing data-access controls. The more flexible data is—that is, the more readily it can be transformed or interpreted to meet specific business needs—the more useful it is in offense. Balancing offense and defense, then, requires balancing data control and flexibility, as we will describe.
- 8. Single Source, Multiple Versions Before we explore the framework, it’s important to distinguish between information and data and to differentiate information architecture from data architecture. According to Peter Drucker, information is “data endowed with relevance and purpose.” Raw data, such as customer retention rates, sales figures, and supply costs, is of limited value until it has been integrated with other data and transformed into information that can guide decision making. Sales figures put into a historical or a market context suddenly have meaning—they may be climbing or falling relative to benchmarks or in response to a specific strategy. A company’s data architecture describes how data is collected, stored, transformed, distributed, and consumed. It includes the rules governing structured formats, such as databases and file systems, and the systems for connecting data with the business processes that consume it. Information architecture governs the processes and rules that convert data into useful information. For example, data architecture might feed raw daily advertising and sales data into information architecture systems, such as marketing dashboards, where it is integrated and analyzed to reveal relationships between ad spend and sales by channel and region. Many organizations have attempted to create highly centralized, control-oriented approaches to data and information architectures. Previously known as information engineering and now as master data management, these top-down approaches are often not well suited to supporting a broad data strategy. Although they are effective for standardizing enterprise data, they can inhibit flexibility, making it harder to customize data or transform it into information that can be applied strategically. In our experience, a more flexible and realistic approach to data and information architectures involves both a single source of truth (SSOT) and multiple versions of the truth (MVOTs). The SSOT works at the data level; MVOTs support the management of information. In the organizations we’ve studied, the concept of a single
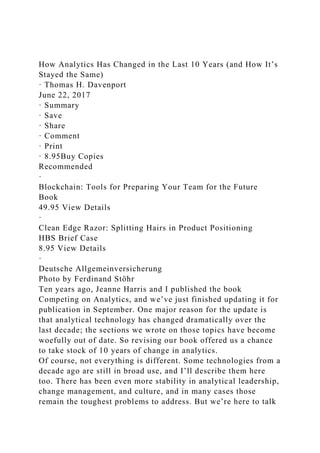
- 9. version of truth—for example, one inviolable primary source of revenue data—is fully grasped and accepted by IT and across the business. However, the idea that a single source can feed multiple versions of the truth (such as revenue figures that differ according to users’ needs) is not well understood, commonly articulated, or, in general, properly executed. The key innovation of our framework is this: It requires flexible data and information architectures that permit both single and multiple versions of the truth to support a defensive-offensive approach to data strategy. The Elements of Data Strategy DEFENSE OFFENSE KEY OBJECTIVES Ensure data security, privacy, integrity, quality, regulatory compliance, and governance Improve competitive position and profitability CORE ACTIVITIES Optimize data extraction, standardization, storage, and access Optimize data analytics, modeling, visualization, transformation, and enrichment DATA-MANAGEMENT ORIENTATION Control Flexibility ENABLING ARCHITECTURE SSOT (Single source of truth) MVOTs (Multiple versions of the truth) From “WHAT’S YOUR DATA STRATEGY?” BY LEANDRO DALLEMULE AND THOMAS H. DAVENPORT, MAY–JUNE 2017 © HBR.ORG Find this and other HBR graphics in our Visual Library
- 10. OK. Let’s parse that. The SSOT is a logical, often virtual and cloud-based repository that contains one authoritative copy of all crucial data, such as customer, supplier, and product details. It must have robust data provenance and governance controls to ensure that the data can be relied on in defensive and offensive activities, and it must use a common language—not one that is specific to a particular business unit or function. Thus, for example, revenue is reported, customers are defined, and products are classified in a single, unchanging, agreed-upon way within the SSOT. Not having an SSOT can lead to chaos. One large industrial company we studied had more than a dozen data sources containing similar supplier information, such as name and address. But the content was slightly different in each source. For example, one source identified a supplier as Acme; another called it Acme, Inc.; and a third labeled it ACME Corp. Meanwhile, various functions within the company were relying on differing data sources; often the functions weren’t even aware that alternative sources existed. Human beings might be able to untangle such problems (though it would be labor- intensive), but traditional IT systems can’t, so the company couldn’t truly understand its relationship with the supplier. Fortunately, artificial intelligence tools that can sift through such data chaos to assemble an SSOT are becoming available. The industrial company ultimately tapped one and saved substantial IT costs by shutting down redundant systems. The SSOT allowed managers to identify suppliers that were selling to multiple business units within the company and to negotiate discounts. In the first year, having an SSOT yielded $75 million in benefits. A New Data Architecture Can Pay for Itself When companies lack a robust SSOT-MVOTs data architecture, teams across the organization may create and store the data they need in siloed repositories that vary in depth, breadth, and formatting. Their data management is often done in isolation with inconsistent requirements. The process is inefficient and
- 11. expensive and can result in the proliferation of multiple uncontrolled versions of the truth that aren’t effectively reused. Because SSOTs and MVOTs concentrate, standardize, and streamline data-sourcing activities, they can dramatically cut operational costs. One large financial services company doing business in more than 200 countries consolidated nearly 130 authoritative data sources, with trillions of records, into an SSOT. This allowed the company to rationalize its key data systems; eliminate much supporting IT infrastructure, such as databases and servers; and cut operating expenses by automating previously manual data consolidation. The automation alone yielded a 190% return on investment with a two-year payback time. Many companies will find that they can fund their entire data management programs, including staff salaries and technology costs, from the savings realized by consolidating data sources and decommissioning legacy systems. The CDO and the data-management function should be fully responsible for building and operating the SSOT structure and using the savings it generates to fund the company’s data program. Most important is to ensure at the outset that the SSOT addresses broad, high-priority business needs, such as applications that benefit customers or generate revenue, so that the project quickly yields results and savings—which encourages organization-wide buy-in. Read more An SSOT is the source from which multiple versions of the truth are developed. MVOTs result from the business-specific transformation of data into information—data imbued with “relevance and purpose.” Thus, as various groups within units or functions transform, label, and report data, they create distinct, controlled versions of the truth that, when queried, yield consistent, customized responses according to the groups’ predetermined requirements. Consider how a supplier might classify its clients Bayer and Apple according to industry. At the SSOT level these companies
- 12. belong, respectively, to chemicals/pharmaceuticals and consumer electronics, and all data about the supplier’s relationship with them, such as commercial transactions and market information, would be mapped accordingly. In the absence of MVOTs, the same would be true for all organizational purposes. But such broad industry classifications may be of little use to sales, for example, where a more practical version of the truth would classify Apple as a mobile phone or a laptop company, depending on which division sales was interacting with. Similarly, Bayer might be more usefully classified as a drug or a pesticide company for the purposes of competitive analysis. In short, multiple versions of the truth, derived from a common SSOT, support superior decision making. A company’s position on the offense-defense spectrum is rarely static. At a global asset management company we studied, the marketing and finance departments both produced monthly reports on television ad spending—MVOTs derived from a common SSOT. Marketing, interested in analyzing advertising effectiveness, reported on spending after ads had aired. Finance, focusing on cash flow, captured spending when invoices were paid. The reports therefore contained different numbers, but each represented an accurate version of the truth. Procter & Gamble has adopted a similar approach to data management. The company long had a centralized SSOT for all product and customer data, and other versions of data weren’t allowed. But CDO Guy Peri and his team realized that the various business units had valid needs for customized interpretations of the data. The units are now permitted to create controlled data transformations for reporting that can be reliably mapped back to the SSOT. Thus the MVOTs diverge from the SSOT in consistent ways, and their provenance is clear.
- 13. 5 Ways Your Data Strategy Can Fail · Thomas C. Redman October 11, 2018 · Summary · Save · Share · Comment · Print Recommended · Harvard Business Review, January/February 2020 HBR Issues 19.95 View Details · Amazon.com, 2019 Case 8.95 View Details · Competing in the Age of AI: Strategy and Leadership When... Book 32.00 View Details Mint Images/Getty Images There are plenty of great ideas and techniques in the data space: from analytics to machine learning to data-driven decision making to improving data quality. Some of these ideas that have been around for a long time and are fully vetted, proving themselves again and again. Others have enjoyed wide socialization in the business, popular, and technical press. Indeed, The Economist proclaimed that data are now “the world’s most valuable asset.” With all these success stories and such a heady reputation, one might expect to see companies trumpeting sustained revenue growth, permanent reductions in cost structures, dramatic improvements in customer satisfaction, and other benefits. Except for very few, this hasn’t happened. Paradoxically, “data” appear everywhere but on the balance sheet and income
- 14. statement. Indeed, the cold reality is that for most, progress is agonizingly slow. It takes a lot to succeed with data. As the figure below depicts, a company must perform solid work on five components, each reasonably aligned with the other four. Missing any of these elements compromises the total effort. Find this and other HBR graphics in our Visual Library Let’s explore each component in turn. Quite obviously, to succeed in the data space, companies need data, properly defined, relevant to the tasks at hand, structured such that it is easy to find and understand, and of high-enough quality that it can be trusted. It helps if some of the data are “proprietary,” meaning that you have sole ownership of or access to them. For most companies, data is a real problem. The data is scattered in silos — stuck in departmental systems that don’t talk well with one another, the quality is poor, and the associated costs are high. Bad data makes it nearly impossible to become data-driven and adds enormous uncertainty to technological progress, including machine learning and digitization. Then, companies need a means to monetize that data, essentially a business model for putting the data to work, at profit. This is where selling the data directly, building it into products and services, using it as input for analytics, and making better decisions come to the fore. There are so many ways to put data to work that it is hard to select the best ones. A high-level direction such as “using analytics wherever possible” is not enough. You have to define how you plan to use analytics to create business advantage and then execute. Without a clear, top-down business direction, people, teams, and entire departments go off on their own. There is lots of activity but little sustained benefit. Organizational capabilities include talent, structure, and
- 15. culture. Some years ago, I noted that most organizations were singularly “unfit for data.” They lack the talent they need, they assign the wrong people to deal with quality, organizational silos make data sharing difficult, and while they may claim that “data is our most important asset,” they don’t treat it that way. If anything, this problem has grown more acute. Start with talent. It is obvious enough that if you want to push the frontiers of machine learning, you need a few world-class data scientists. Less obvious is the need for people who can rationalize business processes, build predictive models into them, and integrate the new technologies into the old. More generally, it is easy to bewail the shortage of top-flight technical talent, but just as important are skills up and down the organization chart, the management ability to pull it all together, and the leadership to drive execution at scale. Consider this example: Many companies see enormous potential in data-driven decision making. But to pursue such an objective, you have to teach people how to use data effectively (HBR’s current series on data skills will focus on this topic). Leadership must realize that earning even a fraction of the value data offer takes more than simply bolting an AI program into one department or asking IT to digitize operations. Insight Center · Scaling Your Team’s Data Skills Help your employees be more data-savvy. Structure and culture are also a concern. As noted, organizational silos make it difficult to share data, effectively limiting the scope of the effort. All organizations claim that they value data, but their leaders are hard-pressed to answer basic questions such as, “Which data is most important?” “How do you plan to make money from your data?” or “Do you have anything that is proprietary?” Some even refer to data as “exhaust” — the antithesis of a valued asset! Without an abundance of talent and an organizational structure and culture that value data, it is difficult for companies to grow successful efforts beyond the team and department levels.
- 16. Fourth, companies need technologies to deliver at scale and low cost. Here, I include both basic storage, processing, and communications technologies, as well as the more sophisticated architectures, analysis tools, and cognitive technologies that are the engines of monetization. Quite obviously companies need technology — you simply can’t scale and deliver without it. Facebook, Amazon, Netflix, and Google, who have succeeded with data, have built powerful platforms. Perhaps for these reasons, most companies begin their forays into the data space with technology. But from my vantage point, too many companies expect too much of technology, falling into the trap of viewing it as the primary driver of success. Technology is only one component. This article also appears in: · Strategic Analytics: The Insights You Need from HBR (Advance Edition) Book 22.95 View Details The last element is defense, essentially minimizing risk. Defense includes actions such as following the law and regulations, keeping valued data safe from loss or theft, meeting privacy requirements, maintaining relationships with customers, matching the moves of a nimble competitor, staying in front of a better-funded behemoth, and steering clear of legal and regulatory actions that stem from monopoly power. You’re unlikely to make much money from defense, but poor defense can cost you a lot of time, money, and trouble. Thus, data require a range of concerted effort. At a minimum, HR must find new talent and train everyone in the organization, tech departments must bring in new technologies and integrate them into existing infrastructures, privacy and security professionals must develop new policies and reach deep into the organization to enforce them, line organizations must deal with incredible disruption, everyone must contribute to data quality efforts, and leaders must set off in new, unfamiliar directions.
- 17. Adding to complications, data, technology, and people are very different sorts of assets, requiring different management styles. It’s a challenging transition. Many companies have tried to resolve their data quality issues with the latest technology as a shortcut (e.g., enterprise systems, data warehouses, cloud, blockchain), but these new systems have missed the mark. It is important to remember that the goal is not simply to get all you can out of your data. Rather, you want to leverage your data in ways that create new growth, cut waste, increase customer satisfaction, or otherwise improve company performance. And “data” may present your best chance of achieving such goals. Successful data programs require concerted, sustained, properly-informed, and coordinated effort. Thomas C. Redman, “the Data Doc,” is President of Data Quality Solution s. He helps companies and people, including start-ups, multinationals, executives, and leaders at all levels, chart their courses to data-driven futures. He places special emphasis on quality, analytics, and organizational capabilities.