Fact Sheet 2012
•
1 gostou•1,524 visualizações

Why Petrobras? Leadership in all segments of the value chain in Brazil; 20% of global deep water production; The most actively traded ADR on NYSE; Presence in 24 countries outside of Brazil, highlighting United States and West Coast of Africa; 125 production platforms, 15 refineries (12 in Brazil), 30,000 kilometers of pipelines and more than 8,000 service stations; Deep-water discoveries in Brazil represent one third of the worldwide discoveries in the last 5 years; Long history of replacing production and increasing reserves; Complete logistical integration between oil and gas producing basins, refineries, and a large and rapidly growing Brazilian market

Recomendados
Mais conteúdo relacionado
Destaque
Destaque (20)
Mais de Petrobras
Mais de Petrobras (20)
Último
Último (15)
Fact Sheet 2012
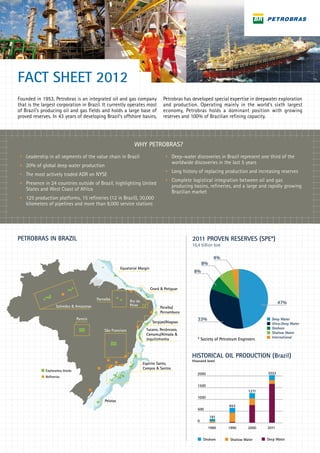
- 1. FACT SHEET 2012 Founded in 1953, Petrobras is an integrated oil and gas company Petrobras has developed special expertise in deepwater exploration that is the largest corporation in Brazil. It currently operates most and production. Operating mainly in the world’s sixth largest of Brazil’s producing oil and gas fields and holds a large base of economy, Petrobras holds a dominant position with growing proved reserves. In 43 years of developing Brazil’s offshore basins, reserves and more than 98% of Brasilian refining capacity. WHY PETROBRAS? ▪▪ Leadership in all segments of the value chain in Brazil. ▪▪ Deep-water discoveries in Brazil represent one third of the worldwide discoveries in the last 5 years. ▪▪ 20% of global deep water production. ▪▪ Long history of replacing production and increasing reserves. ▪▪ One of the most actively traded ADR on NYSE. ▪▪ Complete logistical integration between oil and gas ▪▪ Presence in 27 countries outside of Brazil, highlighting United producing basins, refineries, and a large and rapidly growing States and West Coast of Africa. Brazilian market. ▪▪ 125 production platforms, 15 refineries (12 in Brazil), 30,000 kilometers of pipelines and more than 8,000 service stations. PETROBRAS IN BRAZIL 2011 PROVEN RESERVES (SPE*) 16,4 billion boe 4% 8% Equatorial Margin 8% Ceará & Potiguar Parnaíba Rio do 47% Solimões & Amazonas Peixe Paraíba/ Pernambuco Parecis 33% Deep Water Sergipe/Alagoas Ultra-Deep Water Tucano, Recôncavo, Onshore São Francisco Camamu/Almada & Shallow Water International Jequitinhonha * Society of Petroleum Engineers HISTORICAL OIL PRODUCTION (Brazil) Thousand bbl/d Espírito Santo, Campos & Santos Exploratory blocks 2000 2022 Refineries 1500 1271 1000 Pelotas 653 500 181 0 1980 1990 2000 2011 Onshore Shallow Water Deep Water
- 2. What is Pre-Salt? Business and ManagEment Plan Located up to 300 km offshore 2012-2016 Water depths CAPEX 2012-2016 Projects under implementation: US$ 236.5 Billion US$ 208.7 Billion (833 projects) Total depth from 5,000 that can exceed 2,000 meters 980 Projects Projects under evaluation: to 7,000m US$ 27.8 Billion (147 projects) Post-Salt layer Salt layer: 2,000 to 5,000 meters 27.7% thick (US$ 65.5 Billion) Pre-Salt layer: New exploratory 5.8% frontier (US$ 13.8 Billion) 2.1% Large oil carbonatic reservoirs (US$ 5.0 Billion) 1.5% In 2005, Petrobras discovered the world’s largest new (US$ 3.6 Billion) oil basin in many years: The Pre-Salt layer. Located in the 1.6% Southeast coast of Brazil, the Pre-Salt layer has multi-billion 60.0% (US$ 3.8 Billion) barrels of high quality oil. (US$141.8 Billion) 1.3% Since then, 67 exploratory wells were already drilled and (US$ 3.0 Billion) 80% of them yielding hydrocarbon discoveries. E&P (Exploration&Production) Initial results indicate very large recoverable volumes, which RTM (Refining, transportation and Marketing) G&P (Gas & Power) have the potential to double Petrobras’ current proven reserves Petrochemical by 2020. Distribution These new discoveries will catapult the company in the coming Biofuel Corporate years to an entirely new level of reserves and production. CONSOLIDATED FINANCIAL RESULTS ADRs vs. Dow Jones Billion US$ Jan 06 =100 1S12 2011 2010 2009 450 PBR Net income 4.53 20.10 19.18 15.50 400 PBR/A Investments 20.71 43.16 45.08 35.13 350 DJ EBITDA 14.74 37.30 32.62 28.98 300 Net Debt 65.91 54.90 36.70 40.96 250 Shareholder’s Equity 167.66 177.11 183.40 94.96 200 Net debt/net capitalization 28% 24% 17% 31% 150 Net debt/EBITDA 2.24 1.47 1.03 1.20 100 50 EARNINGS PER ADR* DIVIDENDS PER ADR* 0 2006 2007 2008 2009 2010 2011 2012 4.3 1.4 4.2 3.9 1.2 3.5 1.1 3.0 0.9 NYSE (US$ per ADR) 0.7 Ticker PBR PBRA Last price* 18.77 18.14 Maximum 12 months 34.75 31.39 2007 2008 2009 2010 2011 2007 2008 2009 2010 2011 Minimum 12 months 17.64 16.99 * one ADR represents two shares *Dividends include the Interest on Own Capital (IOC) *june 29, 2012 www.petrobras.com.br/ir | investors@petrobras.com