2. San Francisco, June 11th
Networks have always supported the function and growth of our cities.
Historically, these have been massively tangible undertakings: The
roads and viaducts of ancient Rome. The highways, power grids and
subways of the modern city.
The networks we consider in this exhibit are on the surface seemingly
invisible. Yet they support vital urban functions as readily as our
physical infrastructure.
The digital revolution has layered a vast system of sensors, phones,
microcontrollers and cameras over our environment, enabling entirely
new ways to monitor, understand, and imagine our cities. These
systems have a value that go beyond their original purpose: The digital
exhaust of cellular networks reveals social and economic patterns,
miniaturized location tags highlight global flows of trash, and hybrid
electric bicycles with environmental sensors address a city’s pollution
and traffic problems. Taken together, the impact of digital networks on
cities will be as significant as any past human undertaking.
MIT’s senseable city lab recognizes this momentous shift and
is at the forefront of asking – if this is the future, what’s next?
Practicing anticipatory research, the Lab works with cities and
companies to predict what may be the greatest needs, questions and
opportunities that we face as we evolve alongside technology. Then, in
multidisciplinary teams, the Lab acts on these ideas, developing new
research methods and technologies to advance a sustainable vision of
the urban future.
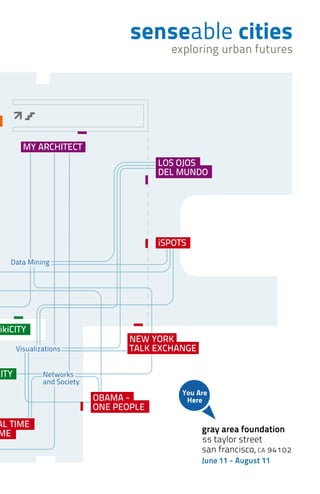
In this, the first retrospective of the lab’s work, we present 15 projects
that embody this anticipatory approach. Each project can be viewed
alone, but we have also sought to unveil the ‘connective tissue’
between them by assigning keywords to each project and using a
computer-based network analysis tool to cluster similar research topics
together.
Works in this exhibition illustrate a landmark opportunity for
broad-based engagement. Like the Internet, the networked city
invites participation from individuals, organizations, companies, and
governments to program and design the digital architectures that will
craft our urban future.
3. team:
carlo ratti director
assaf biderman associate director
christine outram project leader
rex britter -andrea cassi - xiaoji chen
jennifer dunnam - paula echeverri
myshkin ingawale - ari kardasis
e roon kang - sey min
max tomasinelli photographer
/2009
sustainability - mobility - tangible
The Copenhagen Wheel is a tangible new emblem for sustainable
urban mobility. Smart, responsive and elegant, it transforms
existing bicycles quickly into hybrid electric-bikes with
regeneration and real-time sensing capabilities. Its sleek red hub
not only contains a motor, batteries and an internal gear system
– helping people overcome hilly terrains and long distances -
but also includes environmental and location sensors that can
map pollution levels, traffic congestion and road conditions in
real-time. When displayed to riders, the cycling community and
municipalities, this data can help to foster a cycling community,
and help cities make more informed environmental and traffic
policy decisions.
4. team:
carlo ratti director - assaf biderman associate director
dietmar offenhuber team leader - eugenio morello team leader,
concept musstanser tinauli team leader, first phase - kristian
kloeckl team leader, second phase - lewis girod engineering -
jennifer dunnam - e roon kang - kevin nattinger - avid boustani
- david lee programming - alan anderson - clio andris - chris
chung - lorenzo davolli - kathryn dineen - natalia duque
ciceri - samantha earl - sarabjit kaur - sarah neilson - giovanni
de niederhausern - jill passano - elizabeth ramaccia - renato
rinaldi - francisca rojas - louis sirota - malima wolf - armin
linke video advisors: rex britter - stephen miles - tim gutowski
lead volunteers: tim pritchard - jodee fenton - lance albertson
- chad johansen - christie rodgers shannon cheng - jon dreher
- andy smith - richard auger - michael cafferty - shalini ghandi
/2009
sustainability - sensors - feedback loop
Imagine a future where immense amounts of trash don’t
accumulate on the peripheries of our cities: a future where
we understand the ‘removal-chain’ in as much detail as we
understand the ‘supply-chain’. Trash_Track reveals the final
journal of our everyday objects by attaching tiny, custom-
made sensors to pieces of garbage. By visualizing the travel
paths of the trash – both on a national and international scale
- and displaying it to citizens, municipalities and waste removal
companies, Trash_Track offers a ‘feedback loop’ of information
that can be used to reduce inefficiencies in the system, build
more sustainable infrastructures and promote behavior change
towards a zero waste future.
5. team:
carlo ratti director
assaf biderman associate director
giovanni de niederhausern
shaocong zhou
e roon kang
thanks: jodee fenton - tim pritchard
/2009
tangible - mobility - real time information
The EyeStop project represents the next-generation of tangible
urban transportation infrastructure. This new network of bus
shelters provides interactive services for transport users and
real-time information about bus arrivals and departures. Using
an E-ink screen, riders can plan a bus trip on an interactive
map, surf the Web, post ads and community announcements,
monitor their real-time exposure to pollutants and use their
mobile devices as an interface with the bus shelter. Unlike
the typical mass-produced bus stop, EyeStop is designed in
accordance with the physical characteristics of its surroundings.
A computer program generates a unique design for each bus
stop, providing both optimal sheltering for users and maximum
sunlight exposure for power generation.
6. team:
carlo ratti director
assaf biderman associate director
giusy di lorenzo team leader francisco pereira - fabio
pinelli - pedro correia - e roon kang - jennifer dunnam
shaocong zhou - cynthia breazeal director - mikey siegel
fardad faridi - ryan wistort - paula aguilera - jonathan
williams - chuhee lee team leader - charles lee research
engineer
/2009
data mining - mobility - real time information
The AIDA project (Affective, Intelligent Driving Agent) is an
intelligent navigation system that mimics the friendly expertise
of a driving companion who is familiar with both the driver and
the city. Instead of focusing solely on determining routes to a
specified waypoint, this mobility aid analyzes driver behavior
and uses data mining techniques in order to identify the set
of goals the driver would like to achieve. AIDA will predict the
route that the driver will likely follow. It will also keep track
of real-time information such as traffic congestion; special
events that may cause delays; and the location of gas stations
or other common destinations so that it can provide the right
information at the right time to the driver.
7. MIT Media Lab / Smart Cities
team:
carlo ratti director and team
william j. mitchell director and team
dennis frenchman director and team
carlorattiassociati architectural design
studio fm milano graphic design
agence ter landscape architecture
city of zaragoza & expoagua zaragoza 2008 client
arup madrid engineering
lumiartecnia international engineering
siemens lead contractor
typsa site supervision
/2008
sensors - display - real time information
Created by a multidisciplinary team of architects, engineers and
computer scientists from across the globe, The Digital Water
Pavilion was built in 2008 for the EXPOaqua in Zaragoza Spain.
The building functions as an information center for visitors, yet
it is also a sophisticated machine and an interactive and playful
water display. A series of 3000 electromagnetic valves and an
equal number of sensors control the water-walls of the pavilion.
The sensors detect your approach and will automatically stop the
water from flowing from the valves in front of you - allowing you
to enter. In essence, the pavilion represents the dream of digital
architecture – to harness technology to create buildings that are
responsive and configurable to people’s needs.
8. /2009
tangible - display - real time information
Olympic & Expo structures – with their ponderous
monumentality, and their conspicuous expenditure on
immovable objects – are outmoded. In contrast, The Cloud, a
proposal for a public viewing platform for the London 2012
Olympics is as light as air itself. A tribute to an information
age of bits, atoms and sensors the surface of the structure is
made up of digital pixels that can display important Olympic
moments or real-time environmental and weather conditions
to the people of London. From the viewing platform, you
are floating above the city, witnessing the euphoria of the
Olympics and all that takes place below.
team:
architects: carlo ratti, walter nicolino, alex haw -
graphic design: studio fm milano artist: tomas saraceno -
structural engineers: schlaich bergermann und partner
landscape architects: agence ter google -
m&e, environmental, control, digital and site engineering:
arup - visualizations: gmj
9. /2010
display - tangible - feedback loop
Flyfire aims to transform any ordinary space into a highly
immersive and interactive display environment. It sets out to
explore how a display system can be built using a large number
of self-organizing micro helicopters. Each helicopter contains
small LEDs and acts as a smart pixel. Through precisely
controlled movements, the helicopters perform elaborate and
synchronized motions and form an elastic display surface
for any desired scenario. With the self-stabilizing and precise
controlling technology from the ARES Lab at MIT, the motion
of the pixels is adaptable in real time. The Flyfire canvas can
transform itself from one shape to another or morph a two-
dimensional photographic image into an articulated shape.
team:
carlo ratti director
assaf biderman associate director
e roon kang team lead: second phase
carnaven chiu visual designer
caitlin zacharias
shaocong zhou
emilio frazzoli director
erich mueller
10. /2005
visualizations - network and society
real time information
By October 2005, MIT’s entire campus was blanketed with
almost 3,000 WiFi hotspots. The iSpots project analyzes
people’s use of this network and extracts patterns of activity
that reveal how they live, work and study on MIT’s campus.
We found that with a high rate of laptop ownership and the
availability of pervasive wireless access, people on campus
have been untethered from their desks and now do work in
a greater variety of places and employ a more flexible use of
time. As many cities around the world consider public wireless
initiatives, the analysis of the MIT environment could provide
valuable insights for the future. Is today’s MIT tomorrow’s city?
11. /2006
real time information - network and society
visualizations
In today’s world, wireless mobile communications devices are
creating new dimensions of interconnectedness between people,
places, and urban infrastructure. This ubiquitous connectivity
within the urban population can be observed and interpreted in
real-time, through aggregated mobile call records collected from
communication networks. In the visualizations of Real Time
Rome we synthesize anonymous data from various real-time
telecommunication and transportation networks to understand
patterns of daily life in Rome. These real-time maps help us
understand how neighborhoods are used in the course of a day,
how the distribution of buses and taxis correlates with densities
of people, how goods and services are distributed in the city, or
how different social groups inhabit the city.
team:
carlo ratti director
andres sevtsuk curator
burak arikan - assaf biderman - francesco calabrese -
filippo dal fiore - saba ghole - daniel gutierrez - sonya
huang - sriram krishnan - justin moe - francisca rojas
najeeb marc tarazi
12. visualizations - network and society - data mining
In the information age, telecommunication infrastructures such as
the Internet and the telephone bind people together by eviscerating
the constraints of distance. The New York Talk Exchange illustrates
the global exchange of information in real time between New York
and cities around the world by visualizing volumes of long distance
telephone and IP (Internet Protocol) data. This type of data mining
and visualization technique reveals the relationships that New
Yorkers have with the rest of the world and uncovers some of the
social networks that exist within the city. Additionally, it shows
which cities across the globe have the strongest relationships with
New York and how these relationships shift with the time of the
day, week, and year.
/2008
13. team:
carlo ratti director
assaf biderman associate director
andrea vaccari project leader
mauro martino interaction designer
special thanks to:
jon reades data analysis
francisca rojas text analysis
caitlin zacharias text analysis
visualizations - network and society
real time information
The historic election of Barack Obama as the 44th President of
the United States captivated Americans and foreigners alike.
Millions traveled to Washington D.C. from near and far in order
to witness the inaugural ceremony on January 20, 2009. For this
special occasion, we created a visualization of cellphone calling
activity characterizing the crowd that gathered in in the nation’s
capital to explore: Where did people come from for President
Obama’s Inauguration Day? When did the crowd gather and when
did it disperse? The resulting visualizations reveal that the 2009
Inauguration was a multi-day, city-wide event that gathered
people from across the United States and around the world.
/2009
14. /2009
visualizations - network and society - data mining
Los Ojos del Mundo (The World’s Eyes) provides insights into
the social and transportation networks of Spain by analyzing
digital photos that are shared publicly on the web by visitors.
Through data mining and visualization techniques, this project
uncovers how the presence and flow of tourists shifts and ebbs
over time and space. As photos pile up to reflect the intensity
of tourist activity, the geo-located images reveal where tourists
travel, where they come from and what they are interested in
capturing and sharing from their visit. The analysis and mapping
of this image data allows us to understand the attractiveness
of leisure cities and their points of interest. In contrast, through
the absence of images in certain locales, Los Ojos del Mundo also
identifies the unphotographed regions of Spain still free from the
tourist buzz.
15. team:
carlo ratti director
assaf biderman associate director
carnaven chiu project leader
/2009
data mining - visualizations - network and society
My Architect offers a global view of the presence and work of
a selection of the world’s greatest architects today. It shows
that famous buildings of the 21st century lead a “double life,”
- existing in both physical and digital worlds. Although these
worlds do not share the same spatial or temporal dimensions,
the anonymous citizen constantly projects the physical world
onto the digital world by using websites such as Flickr, Twitter,
Facebook and Wikipedia to upload their experience and photos
of famous buildings. The visualization here aggregates these
digital annotations and provides a visual repository of the
buildings that citizens visit and document across the globe.
16. team:
carlo ratti director
assaf biderman - francesco calabrese
kristian kloeckl - bernd resch
andrea vaccari
/2007
feedback loop - network and society
real time information
In past decades, real-time control systems have been
developed in a variety of engineering applications. In doing so,
they have dramatically increased the efficiency of systems
through energy savings, regulation of dynamics, increased
robustness and disturbance tolerance. The wiki-city platform
aims to have cities become real-time control systems through
utilizing hand held personal devices – cellphones and the like
– and through distributing ambient sensors and computers in
our urban environment. Our first experiment with deploying a
wikicity platform is shown here in the city of Rome.
17. team:
carlo ratti director
assaf biderman associate director
christine outram project leader
euro beinat - filippo dal fiore - andrea vaccari -
francesco calabreseaaron koblin - bartosz hawelka
/2009
feedback loop - network and society
real time information
What if the dynamics of a city could be made visible in real-
time? We would not only see buildings and squares, but also
the aggregated flows that animate them. We could understand
which neighborhoods were the most crowded at any given
moment, so as to better allocate energy and other scarce
resources; we could reconstruct commuting patterns, enabling
better management of traffic congestion; we could measure the
city’s response to exceptional events, prompting better action
during emergency relief. Currentcity in Amsterdam seeks to
make this vision a reality. By partnering with mobile operators
and other aggregated data providers around the world our goal
is to build groundbreaking user applications that help to create
solutions to address long-standing city management problems in
innovative ways.
18. mit ��-���
�� Massachusetts Avenue
Cambridge, ma �����
http://senseable.mit.edu
�� taylor street
san francisco, ca �����
http://www.gaffta.org/