CDC Obesity Maps
•Download as PPT, PDF•
3 likes•16,349 views

The document shows obesity rate trends among U.S. adults from 1990 to 2009 based on data from the Behavioral Risk Factor Surveillance System. The maps add new percentage categories over time, showing obesity rates increasing and spreading to more areas, with rates at or above 30% becoming more common in later years.

Recommended
More Related Content
What's hot
What's hot (20)
Viewers also liked
Viewers also liked (20)
Similar to CDC Obesity Maps
Similar to CDC Obesity Maps (20)
More from National Resource Center for Paraprofessionals
More from National Resource Center for Paraprofessionals (20)
Recently uploaded
Recently uploaded (20)
CDC Obesity Maps
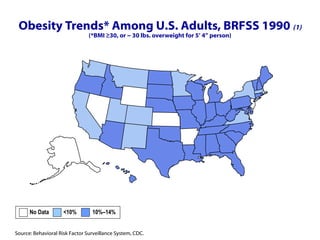
- 1. Obesity Trends* Among U.S. Adults, BRFSS 1990 (1) (*BMI ≥30, or ~ 30 lbs. overweight for 5’ 4” person) No Data <10% 10%–14%
- 2. Obesity Trends* Among U.S. Adults, BRFSS 1991 (*BMI ≥30, or ~ 30 lbs. overweight for 5’ 4” person) No Data <10% 10%–14% 15%–19%
- 3. Obesity Trends* Among U.S. Adults, BRFSS 1992 (*BMI ≥30, or ~ 30 lbs. overweight for 5’ 4” person) No Data <10% 10%–14% 15%–19%
- 4. Obesity Trends* Among U.S. Adults, BRFSS 1993 (*BMI ≥30, or ~ 30 lbs. overweight for 5’ 4” person) No Data <10% 10%–14% 15%–19%
- 5. Obesity Trends* Among U.S. Adults, BRFSS 1994 (*BMI ≥30, or ~ 30 lbs. overweight for 5’ 4” person) No Data <10% 10%–14% 15%–19%
- 6. Obesity Trends* Among U.S. Adults, BRFSS 1995 (*BMI ≥30, or ~ 30 lbs. overweight for 5’ 4” person) No Data <10% 10%–14% 15%–19%
- 7. Obesity Trends* Among U.S. Adults, BRFSS 1996 (*BMI ≥30, or ~ 30 lbs. overweight for 5’ 4” person) No Data <10% 10%–14% 15%–19%
- 8. Obesity Trends* Among U.S. Adults, BRFSS 1997 (*BMI ≥30, or ~ 30 lbs. overweight for 5’ 4” person) No Data <10% 10%–14% 15%–19% ≥20%
- 9. Obesity Trends* Among U.S. Adults, BRFSS 1998 (*BMI ≥30, or ~ 30 lbs. overweight for 5’ 4” person) No Data <10% 10%–14% 15%–19% ≥20%
- 10. Obesity Trends* Among U.S. Adults, BRFSS 1999 (*BMI ≥30, or ~ 30 lbs. overweight for 5’ 4” person) No Data <10% 10%–14% 15%–19% ≥20%
- 11. Obesity Trends* Among U.S. Adults, BRFSS 2000 (*BMI ≥30, or ~ 30 lbs. overweight for 5’ 4” person) No Data <10% 10%–14% 15%–19% ≥20%
- 12. Obesity Trends* Among U.S. Adults, BRFSS 2001 (*BMI ≥30, or ~ 30 lbs. overweight for 5’ 4” person) No Data <10% 10%–14% 15%–19% 20%–24% ≥25%
- 13. Obesity Trends* Among U.S. Adults, BRFSS 2002 (*BMI ≥30, or ~ 30 lbs. overweight for 5’ 4” person) No Data <10% 10%–14% 15%–19% 20%–24% ≥25%
- 14. Obesity Trends* Among U.S. Adults, BRFSS 2003 (*BMI ≥30, or ~ 30 lbs. overweight for 5’ 4” person) No Data <10% 10%–14% 15%–19% 20%–24% ≥25%
- 15. Obesity Trends* Among U.S. Adults, BRFSS 2004 (*BMI ≥30, or ~ 30 lbs. overweight for 5’ 4” person) No Data <10% 10%–14% 15%–19% 20%–24% ≥25%
- 16. Obesity Trends* Among U.S. Adults, BRFSS 2005 (*BMI ≥30, or ~ 30 lbs. overweight for 5’ 4” person) No Data <10% 10%–14% 15%–19% 20%–24% 25%–29% ≥30%
- 17. Obesity Trends* Among U.S. Adults, BRFSS 2006 (*BMI ≥30, or ~ 30 lbs. overweight for 5’ 4” person) No Data <10% 10%–14% 15%–19% 20%–24% 25%–29% ≥30%
- 18. Obesity Trends* Among U.S. Adults, BRFSS 2007 (*BMI ≥30, or ~ 30 lbs. overweight for 5’ 4” person) No Data <10% 10%–14% 15%–19% 20%–24% 25%–29% ≥30%
- 19. Obesity Trends* Among U.S. Adults, BRFSS 2008 (*BMI ≥30, or ~ 30 lbs. overweight for 5’ 4” person) No Data <10% 10%–14% 15%–19% 20%–24% 25%–29% ≥30%
- 20. Obesity Trends* Among U.S. Adults, BRFSS 2009 (*BMI ≥30, or ~ 30 lbs. overweight for 5’ 4” person) No Data <10% 10%–14% 15%–19% 20%–24% 25%–29% ≥30%
Editor's Notes
- For many years CDC has demonstrated through data and graphic maps the continuing rise in obesity. The data shown in the following maps were collected through CDC’s Behavioral Risk Factor Surveillance System (BRFSS). In 1990, among states participating in the Behavioral Risk Factor Surveillance System, ten states had a prevalence of obesity less than 10% and no states had prevalence equal to or greater than 15%.
- In 2009, only one state (Colorado) and the District of Columbia had a prevalence of obesity less than 20%. Thirty-three states had a prevalence equal to or greater than 25%; nine of these states (Alabama, Arkansas, Kentucky, Louisiana, Mississippi, Missouri, Oklahoma, Tennessee, and West Virginia) had a prevalence of obesity equal to or greater than 30% (1)