Enviar pesquisa
Carregar
Updated Year to Date Comparison
•
Transferir como PPTX, PDF
•
0 gostou
•
315 visualizações
N
njhousehelper
Seguir
Tecnologia
Diversão e humor
Denunciar
Compartilhar
Denunciar
Compartilhar
1 de 15
Baixar agora
Recomendados
Year To Date Comparison
njhousehelper
Palm Springs Area Listings Sold By Calendar Quarter (Through March 2010)
SDM: Music Venture
Houston Market Report July 2010
Prudential Gary Greene Realtors
Houston Market Report August 2010
Prudential Gary Greene Realtors
Strategic Valuation of Pizza Market leaders
axvacho
Houston Market Report February 2010
Prudential Gary Greene Realtors
Houston Market Report May 2010
Prudential Gary Greene Realtors
Houston Market Report January 2010
Prudential Gary Greene Realtors
Houston Market Report June 2010
Prudential Gary Greene Realtors
Houston Market Report March 2010
Prudential Gary Greene Realtors
Houston Market Report April 2010
Prudential Gary Greene Realtors
Google Earnings Slides 2009 Q2
earningreport earningreport
Q3 2009 Earning Report of Knoll Inc.
earningreport earningreport
omnicom group Q4 2008 Investor Presentation
finance22
Finance Stocks And Bonds (Portfolio)
lyleslj
nordstrom 2003annualreport
finance43
Ohl Apr Eng
Ohl Apr Eng
Arteris S.A.
Q2 2009 Earning Report of Knoll Inc.
earningreport earningreport
Federal Budget Outlays
brucekaufman
Release 1 t11 (eng)
Release 1 t11 (eng)
BRMALLS
Piaggio Group - First Half 2010 Financial Results
PIAGGIO GROUP INVESTOR RELATIONS
Guía ep c 9.2.1
Guía ep c 9.2.1
eftirados1996
gannett 1998ar
gannett 1998ar
finance30
Houston marketreport sep12_sf
Toni Moss
Q3 2009 Earning Report of Google Inc.
earningreport earningreport
Shoal Point Growth Chart
chrislaval
alcoa 1Q08 Analyst Presentation
finance8
Sales Presentation
Sales Presentation
sjpfeufer
Introduce Moodle
Introduce Moodle
Brian
Solvay
Solvay
stevcall
Mais conteúdo relacionado
Mais procurados
Houston Market Report June 2010
Prudential Gary Greene Realtors
Houston Market Report March 2010
Prudential Gary Greene Realtors
Houston Market Report April 2010
Prudential Gary Greene Realtors
Google Earnings Slides 2009 Q2
earningreport earningreport
Q3 2009 Earning Report of Knoll Inc.
earningreport earningreport
omnicom group Q4 2008 Investor Presentation
finance22
Finance Stocks And Bonds (Portfolio)
lyleslj
nordstrom 2003annualreport
finance43
Ohl Apr Eng
Ohl Apr Eng
Arteris S.A.
Q2 2009 Earning Report of Knoll Inc.
earningreport earningreport
Federal Budget Outlays
brucekaufman
Release 1 t11 (eng)
Release 1 t11 (eng)
BRMALLS
Piaggio Group - First Half 2010 Financial Results
PIAGGIO GROUP INVESTOR RELATIONS
Guía ep c 9.2.1
Guía ep c 9.2.1
eftirados1996
gannett 1998ar
gannett 1998ar
finance30
Houston marketreport sep12_sf
Toni Moss
Q3 2009 Earning Report of Google Inc.
earningreport earningreport
Shoal Point Growth Chart
chrislaval
alcoa 1Q08 Analyst Presentation
finance8
Mais procurados
(19)
Houston Market Report June 2010
Houston Market Report March 2010
Houston Market Report April 2010
Google Earnings Slides 2009 Q2
Q3 2009 Earning Report of Knoll Inc.
omnicom group Q4 2008 Investor Presentation
Finance Stocks And Bonds (Portfolio)
nordstrom 2003annualreport
Ohl Apr Eng
Ohl Apr Eng
Q2 2009 Earning Report of Knoll Inc.
Federal Budget Outlays
Release 1 t11 (eng)
Release 1 t11 (eng)
Piaggio Group - First Half 2010 Financial Results
Guía ep c 9.2.1
Guía ep c 9.2.1
gannett 1998ar
gannett 1998ar
Houston marketreport sep12_sf
Q3 2009 Earning Report of Google Inc.
Shoal Point Growth Chart
alcoa 1Q08 Analyst Presentation
Destaque
Sales Presentation
Sales Presentation
sjpfeufer
Introduce Moodle
Introduce Moodle
Brian
Solvay
Solvay
stevcall
Photofraphy by Solve Sundsbo
Rossica Hristova
Chuong 7 doi moi tu duy va cai cach the che
Le Thuy Hanh
IBM SaaS Interact With Colleague Via Updates Files
Chris Sparshott
Cloud Computing and ROI
Chris Sparshott
Profile Digimarketingjsc
Le Thuy Hanh
Microtravel Profile
Microtravel Profile
Le Thuy Hanh
ESG Brochure
ESG Brochure
nathanielsteiner
Thoicuatiepthiso Lamgiaututainguyeninternet
Le Thuy Hanh
SUN Solaris Zones WebSphere Portal licensing
Chris Sparshott
Wikipedia and the Global Brain
Dan Bolser
My mother puts peanut butter in the freezer and forgets to change her clothes
Annette Kurman, APR, MBA, BSN
Lecture 3 GNSSM
Lecture 3 GNSSM
batence1986
Newmedia - Xu huong truyen thong so
Le Thuy Hanh
Chuong 3 bat on thi truong tai chinh
Le Thuy Hanh
The DUST Project
The DUST Project
ktegenborg
Breaking thinking.vietnam.dtnbs
Le Thuy Hanh
Domino must gather information
Chris Sparshott
Destaque
(20)
Sales Presentation
Sales Presentation
Introduce Moodle
Introduce Moodle
Solvay
Solvay
Photofraphy by Solve Sundsbo
Chuong 7 doi moi tu duy va cai cach the che
IBM SaaS Interact With Colleague Via Updates Files
Cloud Computing and ROI
Profile Digimarketingjsc
Microtravel Profile
Microtravel Profile
ESG Brochure
ESG Brochure
Thoicuatiepthiso Lamgiaututainguyeninternet
SUN Solaris Zones WebSphere Portal licensing
Wikipedia and the Global Brain
My mother puts peanut butter in the freezer and forgets to change her clothes
Lecture 3 GNSSM
Lecture 3 GNSSM
Newmedia - Xu huong truyen thong so
Chuong 3 bat on thi truong tai chinh
The DUST Project
The DUST Project
Breaking thinking.vietnam.dtnbs
Domino must gather information
Semelhante a Updated Year to Date Comparison
Sales Analysis Tool
Sales Analysis Tool
Demand Metric
2008 Annual Newspaper Ad Expenditures
Juan Varela
Naa Annual Newspaper Ad Expenditures 09
Juan Varela
Ctia Survey Midyear 2009 Graphics
Marketingfacts
Q1 2009 Earning Report of Eagle Materials Inc.
earningreport earningreport
Q1 2009 Earning Report of Eagle Materials Inc.
earningreport earningreport
loews 2 CNA Lilienthal Mense
finance14
Market watch jan 2019 frank yu oakville
Frank Yu
Sales and Marketing Executive Dashboard
Demand Metric
Caída Publicidad EEUU 2009
Juan Varela
BBB2005Annual
BBB2005Annual
finance44
BBB2005Annual
BBB2005Annual
finance44
Q1 2009 Earning Report of Raytheon Co.
earningreport earningreport
symantec Q209EarningsSupplementalData
finance40
Q209EarningsSupplementalData
finance40
SYMCQ109
SYMCQ109
finance40
SYMCQ109
SYMCQ109
finance40
SYMQ408_supp
SYMQ408_supp
finance40
Market Watch - September 2019
Michelle Makos
Q309EarningsSupplementalFINALII
finance40
Semelhante a Updated Year to Date Comparison
(20)
Sales Analysis Tool
Sales Analysis Tool
2008 Annual Newspaper Ad Expenditures
Naa Annual Newspaper Ad Expenditures 09
Ctia Survey Midyear 2009 Graphics
Q1 2009 Earning Report of Eagle Materials Inc.
loews 2 CNA Lilienthal Mense
Market watch jan 2019 frank yu oakville
Sales and Marketing Executive Dashboard
Caída Publicidad EEUU 2009
BBB2005Annual
BBB2005Annual
BBB2005Annual
BBB2005Annual
Q1 2009 Earning Report of Raytheon Co.
symantec Q209EarningsSupplementalData
Q209EarningsSupplementalData
SYMCQ109
SYMCQ109
SYMCQ109
SYMCQ109
SYMQ408_supp
SYMQ408_supp
Market Watch - September 2019
Q309EarningsSupplementalFINALII
Último
What is DBT - The Ultimate Data Build Tool.pdf
MounikaPolabathina
Use of FIDO in the Payments and Identity Landscape: FIDO Paris Seminar.pptx
LoriGlavin3
The State of Passkeys with FIDO Alliance.pptx
LoriGlavin3
What's New in Teams Calling, Meetings and Devices March 2024
Stephanie Beckett
SAP Build Work Zone - Overview L2-L3.pptx
NavinnSomaal
Scanning the Internet for External Cloud Exposures via SSL Certs
Rizwan Syed
The Fit for Passkeys for Employee and Consumer Sign-ins: FIDO Paris Seminar.pptx
LoriGlavin3
From Family Reminiscence to Scholarly Archive .
Alan Dix
Generative AI for Technical Writer or Information Developers
Raghuram Pandurangan
DevoxxFR 2024 Reproducible Builds with Apache Maven
Hervé Boutemy
A Deep Dive on Passkeys: FIDO Paris Seminar.pptx
LoriGlavin3
Unleash Your Potential - Namagunga Girls Coding Club
Kalema Edgar
Merck Moving Beyond Passwords: FIDO Paris Seminar.pptx
LoriGlavin3
How AI, OpenAI, and ChatGPT impact business and software.
Curtis Poe
Developer Data Modeling Mistakes: From Postgres to NoSQL
ScyllaDB
Connect Wave/ connectwave Pitch Deck Presentation
Slibray Presentation
Moving Beyond Passwords: FIDO Paris Seminar.pdf
LoriGlavin3
Dev Dives: Streamline document processing with UiPath Studio Web
UiPathCommunity
DevEX - reference for building teams, processes, and platforms
Sergiu Bodiu
Nell’iperspazio con Rocket: il Framework Web di Rust!
Commit University
Último
(20)
What is DBT - The Ultimate Data Build Tool.pdf
Use of FIDO in the Payments and Identity Landscape: FIDO Paris Seminar.pptx
The State of Passkeys with FIDO Alliance.pptx
What's New in Teams Calling, Meetings and Devices March 2024
SAP Build Work Zone - Overview L2-L3.pptx
Scanning the Internet for External Cloud Exposures via SSL Certs
The Fit for Passkeys for Employee and Consumer Sign-ins: FIDO Paris Seminar.pptx
From Family Reminiscence to Scholarly Archive .
Generative AI for Technical Writer or Information Developers
DevoxxFR 2024 Reproducible Builds with Apache Maven
A Deep Dive on Passkeys: FIDO Paris Seminar.pptx
Unleash Your Potential - Namagunga Girls Coding Club
Merck Moving Beyond Passwords: FIDO Paris Seminar.pptx
How AI, OpenAI, and ChatGPT impact business and software.
Developer Data Modeling Mistakes: From Postgres to NoSQL
Connect Wave/ connectwave Pitch Deck Presentation
Moving Beyond Passwords: FIDO Paris Seminar.pdf
Dev Dives: Streamline document processing with UiPath Studio Web
DevEX - reference for building teams, processes, and platforms
Nell’iperspazio con Rocket: il Framework Web di Rust!
Updated Year to Date Comparison
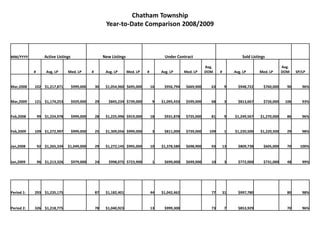
1.
Chatham Township
Year-to-Date Comparison 2008/2009 Active Listings New Listings Under Contract Sold Listings MM/YYYY Avg. Avg. # Avg. LP Med. LP # Avg. LP Med. LP # Avg. LP Med. LP DOM # Avg. LP Med. LP DOM SP/LP Mar,2008 102 $1,217,871 $999,000 30 $1,054,960 $695,000 16 $956,794 $669,900 63 9 $948,722 $760,000 90 96% Mar,2009 121 $1,174,253 $929,000 29 $845,234 $739,000 9 $1,095,433 $599,000 68 3 $813,667 $726,000 106 93% Feb,2008 99 $1,224,978 $999,000 28 $1,225,996 $919,000 18 $931,878 $735,000 81 9 $1,249,567 $1,270,000 86 96% Feb,2009 109 $1,272,997 $999,000 25 $1,309,056 $999,000 3 $811,000 $739,000 109 1 $1,220,500 $1,220,500 29 98% Jan,2008 92 $1,265,334 $1,049,000 29 $1,272,145 $995,000 10 $1,378,580 $698,900 93 13 $809,738 $605,000 70 100% Jan,2009 96 $1,213,326 $979,000 24 $998,075 $723,900 1 $699,000 $699,000 10 3 $772,000 $731,000 48 99% Period 1: 293 $1,235,175 87 $1,182,401 44 $1,042,462 77 31 $997,780 80 98% Period 2: 326 $1,218,775 78 $1,040,923 13 $999,300 73 7 $853,929 70 96%
2.
Chatham Borough
Year-to-Date Comparison 2008/2009 MM/YYY Y Active Listings New Listings Under Contract Sold Listings Avg. Avg. # Avg. LP Med. LP # Avg. LP Med. LP # Avg. LP Med. LP DOM # Avg. LP Med. LP DOM SP/LP Mar,2008 61 $863,400 $659,000 20 $760,125 $625,000 8 $759,688 $649,500 39 5 $515,600 $475,000 61 97% Mar,2009 68 $895,791 $619,000 18 $950,906 $639,900 8 $539,988 $549,000 84 2 $522,000 $494,000 49 98% Feb,2008 58 $869,340 $699,000 25 $846,152 $699,000 9 $679,767 $639,000 25 8 $592,188 $520,000 35 98% Feb,2009 59 $841,804 $599,900 19 $874,138 $619,000 2 $550,000 $485,000 56 6 $680,917 $472,000 94 95% Jan,2008 45 $834,496 $664,000 14 $723,686 $624,900 5 $538,580 $499,000 76 6 $775,250 $458,000 33 99% Jan,2009 50 $831,488 $569,900 9 $881,654 $659,000 4 $774,950 $499,900 82 2 $1,066,500 $838,000 14 100% Period 1: 164 $857,570 59 $787,931 22 $676,741 42 19 $629,842 41 98% Period 2: 177 $859,631 46 $905,648 14 $608,550 79 10 $726,250 69 97%
3.
Denville
Year-to-Date Comparison 2008/2009 Active Listings New Listings Under Contract Sold Listings MM/YYYY Avg. Avg. # Avg. LP Med. LP # Avg. LP Med. LP # Avg. LP Med. LP DOM # Avg. LP Med. LP DOM SP/LP Mar,2008 154 $625,565 $499,900 34 $582,590 $435,000 14 $450,150 $350,000 112 12 $412,758 $415,000 119 96% Mar,2009 154 $577,039 $469,000 46 $543,971 $409,000 12 $412,920 $329,900 109 7 $245,143 $290,000 98 93% Feb,2008 151 $605,317 $479,900 33 $477,744 $429,000 14 $446,312 $405,000 87 8 $457,337 $355,000 84 95% Feb,2009 135 $583,965 $475,000 30 $499,357 $449,000 9 $516,525 $389,000 64 10 $414,489 $345,000 83 95% Jan,2008 147 $632,076 $539,900 32 $691,700 $599,900 12 $458,025 $439,900 89 6 $597,417 $595,000 127 97% Jan,2009 139 $579,255 $475,000 26 $577,696 $497,500 10 $349,682 $299,900 117 10 $382,980 $323,900 108 94% Period 1: 452 $620,918 99 $582,909 40 $451,169 96 26 $469,088 110 96% Period 2: 428 $579,943 102 $539,446 31 $422,600 99 27 $384,840 96 94%
4.
East Hanover
Year-to-Date Comparison 2008/2009 Active Listings New Listings Under Contract Sold Listings MM/YYYY Avg. Avg. # Avg. LP Med. LP # Avg. LP Med. LP # Avg. LP Med. LP DOM # Avg. LP Med. LP DOM SP/LP Mar,2008 52 $632,825 $539,000 13 $509,715 $495,000 10 $622,490 $599,000 103 8 $526,063 $455,000 85 97% Mar,2009 66 $577,485 $499,000 15 $637,120 $643,900 9 $479,922 $439,900 72 3 $495,000 $365,000 74 96% Feb,2008 45 $662,547 $625,000 15 $644,540 $599,000 3 $455,000 $455,000 116 2 $635,000 $540,000 296 95% Feb,2009 61 $559,997 $499,900 9 $571,178 $499,900 4 $421,475 $378,000 63 3 $490,000 $485,000 45 92% Jan,2008 37 $647,435 $599,000 6 $665,600 $729,900 5 $583,940 $550,000 186 5 $550,400 $502,000 151 95% Jan,2009 59 $556,171 $499,999 18 $486,639 $424,900 2 $656,000 $537,000 81 2 $490,000 $460,000 42 95% Period 1: 134 $646,840 34 $596,706 18 $582,200 128 15 $548,700 135 96% Period 2: 186 $564,989 42 $558,498 15 $487,813 71 8 $491,875 55 94%
5.
Florham Park
Year-to-Date Comparison 2008/2009 Active Listings New Listings Under Contract Sold Listings MM/YYYY # Avg. LP Med. LP # Avg. LP Med. LP # Avg. LP Med. LP Avg. DOM # Avg. LP Med. LP Avg. DOM SP/LP Mar,2008 52 $632,825 $539,000 13 $509,715 $495,000 10 $622,490 $599,000 103 8 $526,063 $455,000 85 97% Mar,2009 66 $577,485 $499,000 15 $637,120 $643,900 9 $479,922 $439,900 72 3 $495,000 $365,000 74 96% Feb,2008 45 $662,547 $625,000 15 $644,540 $599,000 3 $455,000 $455,000 116 2 $635,000 $540,000 296 95% Feb,2009 61 $559,997 $499,900 9 $571,178 $499,900 4 $421,475 $378,000 63 3 $490,000 $485,000 45 92% Jan,2008 37 $647,435 $599,000 6 $665,600 $729,900 5 $583,940 $550,000 186 5 $550,400 $502,000 151 95% Jan,2009 59 $556,171 $499,999 18 $486,639 $424,900 2 $656,000 $537,000 81 2 $490,000 $460,000 42 95% Period 1: 134 $646,840 34 $596,706 18 $582,200 128 15 $548,700 135 96% Period 2: 186 $564,989 42 $558,498 15 $487,813 71 8 $491,875 55 94%
6.
Hanover
Year-to-Date Comparison 2008/2009 Active Listings New Listings Under Contract Sold Listings MM/YYYY Avg. Avg. # Avg. LP Med. LP # Avg. LP Med. LP # Avg. LP Med. LP DOM # Avg. LP Med. LP DOM SP/LP Mar,2008 64 $610,234 $549,900 23 $618,670 $539,000 7 $646,943 $549,900 207 6 $485,150 $499,900 130 94% Mar,2009 80 $619,511 $534,900 19 $536,768 $484,000 7 $431,543 $425,000 39 6 $408,000 $360,000 100 93% Feb,2008 48 $587,277 $549,900 9 $488,256 $475,000 3 $455,267 $457,800 91 6 $504,989 $480,000 133 97% Feb,2009 71 $630,730 $549,954 21 $572,692 $499,000 6 $493,633 $405,000 62 6 $488,817 $385,000 59 91% Jan,2008 59 $562,993 $529,900 11 $544,364 $550,000 7 $476,954 $469,990 10 11 $590,677 $575,000 81 97% Jan,2009 71 $634,730 $599,000 16 $648,939 $529,000 8 $475,188 $405,000 104 4 $372,375 $330,000 106 95% Period 1: 171 $587,490 43 $572,366 17 $543,122 142 23 $540,795 107 96% Period 2: 222 $627,966 60 $581,622 21 $465,910 70 16 $429,400 86 93%
7.
Harding
Year-to-Date Comparison 2008/2009 MM/YYYY Active Listings New Listings Under Contract Sold Listings Avg. Avg. # Avg. LP Med. LP # Avg. LP Med. LP # Avg. LP Med. LP DOM # Avg. LP Med. LP DOM SP/LP Mar,2008 53 $3,060,751 $2,250,000 9 $2,076,433 $1,479,000 2 $3,345,000 $2,300,000 369 0 $0 $0 0 0% Mar,2009 74 $3,180,531 $1,999,000 12 $1,485,223 $1,049,000 0 $0 $0 0 3 $1,758,333 $2,137,500 175 80% Feb,2008 53 $3,145,205 $2,250,000 10 $2,835,300 $2,149,000 3 $2,275,000 $1,800,000 122 1 $1,375,000 $1,375,000 106 81% Feb,2009 74 $3,298,292 $2,149,000 12 $2,002,233 $1,425,000 2 $3,272,500 $2,950,000 245 1 $3,250,000 $3,250,000 0 84% Jan,2008 56 $2,917,014 $2,095,000 11 $2,859,091 $2,149,000 2 $1,104,950 $509,900 65 2 $1,965,000 $480,000 52 98% Jan,2009 72 $3,471,674 $2,399,000 9 $2,692,000 $2,399,000 2 $2,198,000 $521,000 55 1 $717,500 $717,500 49 93% Period 1: 162 $3,038,694 30 $2,616,363 7 $2,246,414 176 3 $1,768,333 70 92% Period 2: 220 $3,315,425 33 $2,002,348 4 $2,735,250 150 5 $1,848,500 115 83%
8.
Madison
Year-to-Date Comparison 2008/2009 Active Listings New Listings Under Contract Sold Listings MM/YYYY Avg. Ave. # Avg. LP Med. LP # Avg. LP Med. LP # Avg. LP Med. LP DOM # Avg. LP Med. LP DOM SP/LP Mar,2008 85 $824,475 $649,000 19 $845,589 $587,500 15 $751,679 $829,000 67 9 $635,239 $624,900 56 95% Mar,2009 101 $1,051,238 $699,000 31 $1,026,403 $589,000 9 $572,322 $499,000 54 9 $559,967 $505,000 85 96% Feb,2008 89 $813,964 $685,000 32 $775,890 $699,900 13 $879,762 $679,000 28 3 $537,500 $545,000 73 95% Feb,2009 92 $1,007,945 $725,000 29 $1,047,723 $989,000 15 $844,253 $699,000 56 4 $742,125 $822,500 117 90% Jan,2008 77 $836,712 $649,000 22 $794,977 $599,000 9 $667,533 $624,900 71 6 $1,040,817 $710,000 64 93% Jan,2009 79 $986,444 $679,000 16 $780,106 $675,000 4 $684,050 $449,000 105 8 $542,875 $545,000 65 95% Period 1: 251 $824,502 73 $799,783 37 $776,213 54 18 $754,142 62 94% Period 2: 272 $1,017,776 76 $982,686 28 $733,960 62 21 $588,153 83 94%
9.
Millburn Township
Year-to-Date Comparison 2008/2009 Active Listings New Listings Under Contract Sold Listings MM/YYYY Ave. Ave. # Avg. LP Med. LP # Avg. LP Med. LP # Avg. LP Med. LP DOM # Avg. LP Med. LP DOM SP/LP Mar,2008 157 $1,638,609 $1,150,000 62 $1,309,508 $1,024,000 21 $1,400,984 $995,000 39 19 $1,197,763 $752,500 66 96% Mar,2009 154 $1,551,603 $1,166,000 52 $1,235,985 $890,000 19 $868,547 $699,000 45 10 $1,281,250 $850,000 139 92% Feb,2008 138 $1,691,593 $1,199,000 41 $1,619,534 $1,388,000 31 $1,424,642 $995,000 45 11 $1,363,541 $740,000 84 97% Feb,2009 124 $1,689,310 $1,274,000 34 $1,451,568 $884,000 13 $1,406,531 $1,095,000 56 7 $695,214 $739,000 55 98% Jan,2008 126 $1,701,979 $999,000 42 $1,779,307 $1,075,000 15 $1,006,300 $765,000 103 20 $1,285,375 $970,000 52 95% Jan,2009 112 $1,816,162 $1,349,000 33 $1,607,570 $1,349,000 13 $1,359,685 $850,000 128 6 $1,437,583 $1,310,000 65 95% Period 1: 421 $1,674,943 145 $1,533,250 67 $1,323,568 56 50 $1,269,279 64 96% Period 2: 390 $1,671,363 119 $1,400,625 45 $1,165,849 72 23 $1,143,674 94 95%
10.
Morristown
Year-to-Date Comparison 2008/2009 Active Listings New Listings Under Contract Sold Listings MM/YYYY # Avg. LP Med. LP # Avg. LP Med. LP # Avg. LP Med. LP Ave. DOM # Avg. LP Med. SP Avg. DOM SP/LP Mar,2008 155 $475,101 $425,000 31 $399,835 $398,000 17 $407,894 $389,000 107 15 $430,033 $428,000 97 96% Mar,2009 154 $482,923 $409,900 30 $448,443 $418,000 13 $391,862 $415,000 73 6 $416,667 $415,000 107 93% Feb,2008 177 $479,379 $435,900 45 $433,418 $429,900 18 $421,622 $375,000 86 10 $474,803 $375,000 94 97% Feb,2009 156 $519,855 $415,000 32 $568,666 $429,000 13 $490,808 $374,900 85 8 $378,125 $315,000 71 98% Jan,2008 182 $482,718 $443,000 59 $453,520 $449,900 10 $375,350 $354,900 129 23 $414,607 $359,900 99 97% Jan,2009 149 $502,755 $400,000 26 $529,231 $370,000 9 $373,322 $329,900 133 9 $605,278 $415,000 279 81% Period 1: 514 $479,271 135 $434,492 45 $406,153 103 48 $431,968 97 97% Period 2: 459 $501,913 88 $516,030 35 $423,846 93 23 $477,065 162 90%
11.
Morris Plains
Year-to-Date Comparison 2008/2009 Active Listings New Listings Under Contract Sold Listings MM/YYYY # Avg. LP Med. LP # Avg. LP Med. LP # Avg. LP Med. LP Avg. DOM # Avg. LP Med. LP Avg. DOM SP/LP Mar,2008 34 $531,032 $499,800 8 $508,325 $484,800 3 $337,933 $284,900 86 5 $452,800 $445,000 98 96% Mar,2009 47 $465,117 $465,000 10 $489,850 $450,000 4 $410,900 $289,000 163 4 $413,250 $400,000 22 97% Feb,2008 33 $522,403 $498,800 5 $522,720 $4,999,800 3 $481,000 $389,000 113 4 $473,125 $467,500 55 96% Feb,2009 50 $462,676 $464,900 12 $506,642 $465,000 7 $440,557 $435,000 68 0 $0 $0 0 0% Jan,2008 39 $543,238 $524,000 16 $508,944 $498,800 6 $608,950 $499,900 66 3 $730,167 $632,500 121 98% Jan,2009 48 $461,298 $450,000 11 $473,854 $539,000 3 $542,600 $579,000 70 3 $440,000 $445,000 40 93% Period 1: 106 $532,837 29 $511,148 12 $484,208 83 12 $528,917 89 96% Period 2: 145 $463,011 33 $490,624 14 $453,950 96 7 $424,714 30 95%
12.
Morris Township
Year-to-Date Comparison 2008/2009 Active Listings New Listings Under Contract Sold Listings MM/YYYY # Avg. LP Med. LP # Avg. LP Med. LP # Avg. LP Med. LP Avg. DOM # Avg. LP Med. LP Avg. DOM SP/LP Mar,2008 228 $714,269 $599,000 64 $722,373 $649,000 31 $673,039 $589,900 43 23 $632,409 $570,000 104 94% Mar,2009 185 $711,657 $599,000 51 $660,759 $609,000 18 $554,428 $499,000 104 11 $693,000 $599,000 114 93% Feb,2008 202 $719,432 $580,000 48 $691,581 $565,000 21 $759,481 $599,900 100 13 $653,655 $582,500 75 93% Feb,2009 172 $721,025 $575,000 44 $673,809 $575,000 15 $586,693 $469,900 64 10 $517,400 $485,000 100 94% Jan,2008 193 $722,364 $598,000 52 $675,692 $575,000 19 $672,447 $598,000 81 12 $501,417 $455,000 90 95% Jan,2009 158 $747,791 $599,000 31 $667,245 $549,000 15 $646,567 $550,000 129 7 $453,286 $485,000 60 97% Period 1: 623 $718,451 164 $698,559 106 $698,448 70 48 $605,415 93 94% Period 2: 515 $725,872 126 $666,912 36 $593,304 99 28 $570,357 96 94%
13.
Parsippany
Year-to-Date Comparison 2008/2009 Active Listings New Listings Under Contract Sold Listings MM/YYYY # Avg. LP Med. LP # Avg. LP Med. LP # Avg. LP Med. LP Avg. DOM # Avg. LP Med. LP Avg. DOM SP/LP Mar,2008 365 $463,148 $455,000 95 $436,124 $439,900 27 $416,309 $419,990 69 25 $423,038 $390,000 99 96% Mar,2009 281 $454,879 $439,000 82 $466,278 $449,000 33 $399,109 $399,500 74 15 $286,123 $265,000 84 93% Feb,2008 330 $476,382 $459,900 67 $419,318 $399,900 31 $453,019 $434,900 81 23 $415,371 $419,000 100 95% Feb,2009 351 $440,797 $425,000 54 $444,354 $399,000 22 $354,732 $379,000 101 10 $309,804 $290,000 105 86% Jan,2008 330 $494,651 $474,900 92 $449,694 $454,900 25 $514,980 $464,900 106 29 $379,703 $360,000 74 96% Jan,2009 251 $439,122 $424,999 51 $421,432 $439,000 18 $367,649 $345,000 106 13 $361,019 $389,000 66 97% Period 1: 1025 $477,551 254 $436,606 116 $459,740 85 77 $404,427 90 96% Period 2: 783 $455,314 187 $447,716 34 $377,978 90 38 $317,977 83 93%
14.
Randolph
Year-to-Date Comparison 2008/2009 Active Listings New Listings Under Contract Sold Listings MM/YYYY # Avg. LP Med. LP # Avg. LP Med. LP # Avg. LP Med. LP Avg. DOM # Avg. LP Med. LP Avg. DOM SP/LP Mar,2008 186 $670,688 $535,000 46 $664,800 $529,900 20 $658,180 $579,000 87 17 $542,735 $430,000 133 95% Mar,2009 172 $591,959 $519,900 51 $617,198 $569,900 14 $435,457 $419,000 97 7 $652,643 $645,000 81 95% Feb,2008 169 $658,306 $535,000 41 $607,027 $535,000 18 $548,217 $458,000 133 9 $567,822 $415,000 57 96% Feb,2009 153 $601,160 $519,900 34 $580,541 $495,000 14 $637,936 $599,900 108 12 $511,042 $498,000 92 95% Jan,2008 150 $656,019 $517,000 45 $721,113 $579,900 9 $561,422 $455,000 99 15 $600,033 $610,000 101 97% Jan,2009 150 $605,168 $539,900 31 $621,523 $575,000 9 $561,508 $619,900 62 8 $497,422 $410,000 80 93% Period 1: 505 $662,187 132 $666,053 123 $597,538 107 41 $569,205 $469,205 105 96% Period 2: 475 $599,094 116 $607,610 33 $542,732 93 27 $543,718 $543,718 86 94%
15.
Summit
Year-to-Date Comparison 2008/2009 Active Listings New Listings Under Contract Sold Listings MM/YYYY Avg. Avg. # Avg. LP Med. LP # Avg. LP Med. LP # Avg. LP Med. LP DOM # Avg. LP Med. LP DOM SP/LP Mar,2008 171 $1,155,882 $799,000 43 $1,296,540 $1,085,000 29 $1,247,031 $835,000 48 21 $954,238 $660,000 80 95% Mar,2009 213 $1,205,798 $825,000 60 $1,202,666 $949,500 20 $866,440 $559,000 67 7 $504,893 $470,000 106 93% Feb,2008 168 $1,157,352 $785,000 41 $1,537,271 $1,145,000 26 $900,208 $699,000 81 11 $706,523 $505,000 101 96% Feb,2009 189 $1,226,459 $799,000 43 $1,062,646 $850,000 10 $799,300 $395,000 96 7 $899,732 $995,000 88 96% Jan,2008 172 $998,026 $700,000 58 $893,000 $599,000 20 $812,300 $509,000 60 14 $847,714 $540,000 32 100% Jan,2009 168 $1,326,918 $760,000 37 $1,340,773 $799,000 4 $722,500 $585,000 89 8 $1,218,325 $619,000 110 94% Period 1: 511 $1,103,232 142 $1,201,221 101 $1,010,871 63 46 $862,581 70 97% Period 2: 570 $1,248,347 140 $1,196,160 36 $829,759 78 22 $889,953 102 94%
Baixar agora