Boston consulting group’s 2014 global wealth report
1. Boston Consulting Group’s 2014 Global Wealth Report
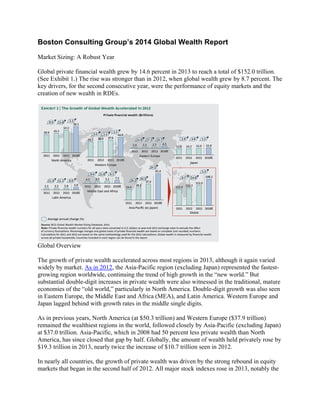
Market Sizing: A Robust Year
Global private financial wealth grew by 14.6 percent in 2013 to reach a total of $152.0 trillion.
(See Exhibit 1.) The rise was stronger than in 2012, when global wealth grew by 8.7 percent. The
key drivers, for the second consecutive year, were the performance of equity markets and the
creation of new wealth in RDEs.
Global Overview
The growth of private wealth accelerated across most regions in 2013, although it again varied
widely by market. As in 2012, the Asia-Pacific region (excluding Japan) represented the fastest-
growing region worldwide, continuing the trend of high growth in the “new world.” But
substantial double-digit increases in private wealth were also witnessed in the traditional, mature
economies of the “old world,” particularly in North America. Double-digit growth was also seen
in Eastern Europe, the Middle East and Africa (MEA), and Latin America. Western Europe and
Japan lagged behind with growth rates in the middle single digits.
As in previous years, North America (at $50.3 trillion) and Western Europe ($37.9 trillion)
remained the wealthiest regions in the world, followed closely by Asia-Pacific (excluding Japan)
at $37.0 trillion. Asia-Pacific, which in 2008 had 50 percent less private wealth than North
America, has since closed that gap by half. Globally, the amount of wealth held privately rose by
$19.3 trillion in 2013, nearly twice the increase of $10.7 trillion seen in 2012.
In nearly all countries, the growth of private wealth was driven by the strong rebound in equity
markets that began in the second half of 2012. All major stock indexes rose in 2013, notably the
2. S&P 500 (17.9 percent), the Nikkei 225 (56.7 percent), and the Euro Stoxx 50 (14.7 percent).
This performance was spurred by relative economic stability in Europe and the U.S. and signs of
recovery in some European countries, such as Ireland, Spain, and Portugal. A further factor,
despite the tapering of quantitative easing in the U.S., was generally supportive monetary policy
by central banks. In an exception, the MSCI Emerging Markets Index fell by 5 percent.
Globally, the growth of private wealth was driven primarily by returns on existing assets. (See
Exhibit 2.) The amount of wealth held in equities grew by 28.0 percent, with increases in bonds
(4.1 percent) and cash and deposits (8.8 percent) lagging behind considerably. As a result, asset
allocation shifted significantly toward a higher share of equities.
Currency developments were more relevant to private wealth growth in 2013 than in 2012.
Driven by the slowdown in quantitative easing, the U.S. dollar gained value against many
currencies, particularly those in emerging markets, as well as against the Japanese yen.
As in previous years, strong growth in gross domestic product (GDP) in RDEs was an important
driver of wealth. The BRIC countries, overall, achieved average nominal GDP growth of nearly
10 percent in 2013.
Looking ahead, global private wealth is projected to post a compound annual growth rate
(CAGR) of 5.4 percent over the next five years to reach an estimated $198.2 trillion by the end
of 2018. The Asia-Pacific region and its new wealth will account for about half of the total
growth. (See Exhibit 3.) Continued strong GDP growth and high savings rates in RDEs will be
key drivers of the rise in global wealth.
3. Assuming constant consumption and savings rates, North America will fall to a position as the
second-largest wealth market in 2018 (a projected $59.1 trillion), being overtaken by Asia-
Pacific (excluding Japan) with a projected $61.0 trillion. Western Europe should follow with a
projected $44.6 trillion.
Millionaires
As the debate over the global polarization of wealth rages on, one thing is certain: more people
are becoming wealthy. The total number of millionaire households (in U.S. dollar terms) reached
16.3 million in 2013, up strongly from 13.7 million in 2012 and representing 1.1 percent of all
households globally. The U.S. had the highest number of millionaire households (7.1 million), as
well as the highest number of new millionaires (1.1 million). (See Exhibit 4.) Robust wealth
creation in China was reflected by its rise in millionaire households from 1.5 million in 2012 to
2.4 million in 2013, surpassing Japan. Indeed, the number of millionaire households in Japan fell
from 1.5 million to 1.2 million, driven by the 15 percent fall in the yen against the dollar.
4. The highest density of millionaire households was in Qatar (175 out of every 1,000 households),
followed by Switzerland (127) and Singapore (100). The U.S. had the largest number of
billionaires, but the highest density of billionaire households was in Hong Kong (15.3 per
million), followed by Switzerland (8.5 per million).
Wealth held by all segments above $1 million is projected to grow by at least 7.7 percent per
year through 2018, compared with an average of 3.7 percent per year in segments below $1
million. Ultra-high-net-worth (UHNW) households, those with $100 million or more, held $8.4
trillion in wealth in 2013 (5.5 percent of the global total), an increase of 19.7 percent over 2012.
At an expected CAGR of 9.1 percent over the next five years, UHNW households are projected
to hold $13.0 trillion in wealth (6.5 percent of the total) by the end of 2018.
Wealth managers must develop winning client-acquisition strategies and differentiated, segment-
specific value propositions in order to succeed with HNW and UHNW clients and meet their
ever-increasing needs.
Regional Variation
Strong equity markets helped countries in the old world, which have large existing asset bases, to
match the rapid growth in assets in the new world, which relies more on new wealth creation
spurred by GDP growth and high savings rates. For example, private wealth grew by double
digits in the U.S. and Australia, while some emerging markets, such as Brazil, showed
substantially weaker growth. China will continue to consolidate its position as the second-
wealthiest nation, after the U.S. (See Exhibit 5.)
5. North America. Private wealth in North America rose by 15.6 percent in 2013 to $50.3 trillion,
driven by the strong growth of wealth held in equities and moderate nominal GDP growth of 3.5
percent. Wealth grew by 16.3 percent in the U.S., while growth in Canada was considerably
slower at 8.4 percent owing to weaker stock-market returns and a lower share of directly held
equities.
The amount of wealth held in equities in North America grew by a robust 29.1 percent,
compared with increases of 3.6 percent for bonds and 5.1 percent for cash and deposits. The
strong performance of stocks was achieved despite worries about the so-called fiscal cliff at the
beginning of the year and the tapering in quantitative easing toward the end of the year. Positive
factors included an improving job market in the U.S. and a stabilizing economic outlook in
Europe.
With a projected CAGR of 3.3 percent, private wealth in North America will reach an estimated
$59.1 trillion by the end of 2018. The majority of this growth will come from existing assets
rather than from new wealth.
Western Europe. Private wealth in Western Europe rose by 5.2 percent to $37.9 trillion in 2013,
the subpar performance partly reflecting low GDP growth. The amount of wealth held in equities
rose by 17.1 percent, compared with 2.3 percent for cash and deposits and a decline of 3.1
percent in bonds.
6. The extent of economic recovery in Western Europe varied across the region. Some countries
outside the euro zone showed signs of steady recovery, with good-to-moderate nominal GDP
growth rates (3.5 percent in the U.K., 2.5 percent in Sweden, and 1.9 percent in Switzerland).
However, except for Germany (2.3 percent), GDP growth in the euro zone remained hindered by
the lingering downturn, illustrated by France (1.2 percent), Italy (–1.0 percent) and Spain (–0.1
percent).
Since stocks in all major markets performed strongly, growth in private wealth was highest in
countries with a relatively high share of equity allocation. These included Switzerland (wealth
growth of 10.4 percent, equity share of 38.4 percent) and the U.K. (wealth growth of 8.1 percent,
equity share of 49.3 percent). Switzerland also remained a top destination for wealth booked
offshore. (See “Trends in Offshore Banking.”) Countries with lower equity allocations benefited
less from stock market rallies. These included France (wealth growth of 5.5 percent, equity share
of 23.0 percent) and Italy (wealth growth of 0.7 percent, equity share of 9.5 percent).
Trends in Offshore Banking
Private wealth booked across borders reached $8.9 trillion in 2013, an increase of 10.4 percent
over 2012 but below the increase in total global private wealth of 14.6 percent. As a result, the
share of offshore wealth declined slightly from 6.1 percent to 5.9 percent.
Offshore wealth is projected to grow at a solid CAGR of 6.8 percent to reach $12.4 trillion by the
end of 2018. The offshore model will continue to thrive because wealth management clients—
particularly in the high-net-worth (HNW) segment, with at least $1 million in wealth, and in the
ultra-high-net-worth (UHNW) segment, with at least $100 million—will continue to leverage the
differentiated value propositions that offshore centers provide. These include access to
innovative products, highly professional investment and client-relationship teams, and security
(most relevant for emerging markets). Indeed, the latest tensions between Russia and Ukraine, as
well as the escalated conflict in Syria, have highlighted the need for domiciles that offer high
levels of political and economic stability.
In 2013, Switzerland remained the leading offshore booking center with $2.3 trillion in assets,
representing 26 percent of global offshore assets. (See the accompanying exhibit.) However, the
country remains under heavy pressure because of its significant exposure to assets originating in
developed economies—some of which are expected to be repatriated following government
actions to minimize tax evasion.
7. In the long run, Switzerland’s position as the world’s largest offshore center is being challenged
by the rise of Singapore and Hong Kong, which currently account for about 16 percent of global
offshore assets and benefit strongly from the ongoing creation of new wealth in the region.
Assets booked in Singapore and Hong Kong are projected to grow at CAGRs of 10.2 percent and
11.3 percent, respectively, through 2018, and are expected to account collectively for 20 percent
of global offshore assets at that point in time.
Overall, repatriation flows back to Western Europe and North America, in line with the
implementation of stricter tax regulations, will continue to put pressure on many offshore
booking domiciles. Reacting to these developments, private banks have started to revisit their
international wealth-management portfolios. Some have acquired businesses from competitors—
through either asset or share deals—while others have decided to abandon selected markets or to
serve only the top end of HNW and UHNW clients. The goal is to exit subscale activities in
many of their booking centers and markets, and in so doing to reduce complexity in their
business and operating models.
Nonetheless, players that have decided to leave selected markets have not always obtained the
results they hoped for. An alternative and potentially more effective course of action—one
already embraced by some leading players—would be to establish an “international” or “small
markets” desk that addresses all non-core markets.
The key to success is to clearly differentiate products and service levels by market and client
segment. For core growth markets, full-service offerings that include segment-tailored products
8. (including optimal tax treatment) should be featured. All other markets (and client segments)
should be limited to standard offerings.
Equities continued to perform positively after the European Central Bank pledged to do
“whatever it takes” to save the euro and launched the Outright Monetary Transactions (OMT)
program in the second half of 2012. With a projected CAGR of 3.3 percent, private wealth in
Western Europe will grow to an estimated $44.6 trillion by the end of 2018.
Eastern Europe. Private wealth in Eastern Europe rose by 17.2 percent to $2.7 trillion in 2013.
The strong performance was driven by growth of 21.9 percent in Russia, where wealth held in
equities returned 22.6 percent, boosted by international rather than local stocks. This trend offset
relatively weak nominal GDP growth of 6.7 percent (compared with 12.3 percent in 2012). As in
other regions, the amount of wealth held in equities grew the strongest, rising by 22.2 percent
compared with 12.3 percent for bonds and 16.0 percent for cash and deposits.
Private wealth grew at a slower rate in the more central European countries, such as Poland (9.8
percent), the Czech Republic (4.4 percent), and Hungary (3.6 percent).
With a projected CAGR of 10.7 percent, the highest rate of all the regions, private wealth in
Eastern Europe will grow to an estimated $4.5 trillion by the end of 2018. This forecast assumes
that the current tensions between Russia and Ukraine will be resolved peacefully in 2014.
Asia-Pacific (excluding Japan). Private wealth in Asia-Pacific (excluding Japan) rose by 30.5
percent to $37.0 trillion in 2013. Strong nominal GDP growth in both China (9.6 percent) and
India (14.2 percent), as well as high savings rates in those countries—16.8 percent and 19.2
percent of GDP, respectively—were the principal drivers. The amount of wealth held in equities
gained 48.0 percent, compared with 30.4 percent for bonds and 21.3 percent for cash and
deposits.
For China, the remarkable 49.2 percent growth in private wealth was driven mainly by products
such as PRC trusts (up 81.5 percent), reflecting the country’s rapidly expanding shadow-banking
sector. Stock markets in China posted below-average performance, however, falling by 6.8
percent. This decline was influenced by increasing concerns about the country’s economic
outlook after the government announced that it would accept lower growth rates to make its
economic model more balanced and sustainable.
With a projected CAGR of 10.5 percent, private wealth in the overall region will expand to an
estimated $61.0 trillion by the end of 2018. At this pace, the region is expected to overtake
Western Europe as the second-wealthiest region in 2014, and North America as the wealthiest in
2018.
Japan. At constant exchange rates, private wealth in Japan rose by a modest 4.8 percent to $15.0
trillion in 2013. If the weakening yen is taken into account, however, private wealth in U.S.
dollars was lower in Japan in 2013 than in 2012. That said, the weaker yen supported the
Japanese export sector and led to an increase in nominal GDP growth from 0.5 percent in 2012 to
1.0 percent in 2013.
9. Japanese stock markets continued to perform extremely well, gaining 55.1 percent in 2013,
spurred by the generally positive outlook for equities globally, the yen depreciation, and fiscal
stimulus programs initiated by the government to fight deflation.
The amount of private wealth held in equities grew by 16.3 percent, compared with 1.8 percent
for cash and deposits and a fall of 11.4 percent for bonds (continuing a downward trend). With a
projected CAGR of 1.2 percent, the lowest rate of all the regions, private wealth in Japan will
grow to an estimated $15.9 trillion by the end of 2018.
Latin America. At constant exchange rates, private wealth in Latin America continued to
achieve double-digit growth in 2013, rising by 11.1 percent to $3.9 trillion. However, taking into
account the currency devaluations in many Latin American countries—such as Brazil (down 13
percent), Argentina (down 37 percent), and Chile (down 9 percent)—private wealth in the region
declined in 2013.
Below-average growth was observed in the larger countries in the region. Private wealth rose by
10.7 percent in Mexico and 5.6 percent in Brazil (where it was up 14.1 percent in 2012), driven
by a weakening of local bond and stock markets.
Regionwide, riding developments in other regions, the amount of private wealth held in equities
rose strongly by 19.6 percent, compared with 9.4 percent for bonds and 10.4 percent for cash and
deposits. There were significant differences between the changes in onshore wealth (up 7.1
percent) and offshore wealth (up 23.5 percent)—attributable mainly to net inflows from
countries such as Argentina and Venezuela and attractive returns from offshore investments.
With a projected CAGR of 8.8 percent, private wealth in Latin America will reach an estimated
$5.9 trillion by the end of 2018.
Middle East and Africa. Despite remaining tensions following the Arab Spring and the
escalation of the conflict in Syria, private wealth in the MEA region increased by 11.6 percent to
reach $5.2 trillion in 2013. Key drivers were generally high savings rates and continued strong
nominal GDP growth in oil-rich countries, such as Saudi Arabia (13.4 percent), Kuwait (13.6
percent), and the United Arab Emirates (12.8 percent).
As in all other regions, equities were the strongest contributor. The amount of wealth held in
equities rose by 30.5 percent across major MEA markets, compared with 6.4 percent for bonds
and 5.7 percent for cash and deposits. With a projected CAGR of 6.5 percent, private wealth in
the region will reach an estimated $7.2 trillion by the end of 2018.