SlideShare uma empresa Scribd logo
1 de 22
Baixar para ler offline
Review of Accounting and Finance
Emerald Article: Apparent audit failures and value relevance of earnings
and book value
Li Dang, Kevin F. Brown, B.D. McCullough


Article information:
To cite this document:
Li Dang, Kevin F. Brown, B.D. McCullough, (2011),"Apparent audit failures and value relevance of earnings and book value", Review
of Accounting and Finance, Vol. 10 Iss: 2 pp. 134 - 154
Permanent link to this document:
http://dx.doi.org/10.1108/14757701111129616
Downloaded on: 29-06-2012
References: This document contains references to 36 other documents
To copy this document: permissions@emeraldinsight.com
This document has been downloaded 973 times since 2011. *


Users who downloaded this Article also downloaded: *
Imen Khanchel El Mehdi, Souad Seboui, (2011),"Corporate diversification and earnings management", Review of Accounting and
Finance, Vol. 10 Iss: 2 pp. 176 - 196
http://dx.doi.org/10.1108/14757701111129634

Haidan Li, Yiming Qian, (2011),"Outside CEO directors on compensation committees: whose side are they on?", Review of Accounting
and Finance, Vol. 10 Iss: 2 pp. 110 - 133
http://dx.doi.org/10.1108/14757701111129607

Edward M. Werner, (2011),"The value relevance of pension accounting information: evidence from <IT>Fortune</IT> 200 firms",
Review of Accounting and Finance, Vol. 10 Iss: 4 pp. 427 - 458
http://dx.doi.org/10.1108/14757701111185362


Access to this document was granted through an Emerald subscription provided by Universidad Nacional de Cordoba

For Authors:
If you would like to write for this, or any other Emerald publication, then please use our Emerald for Authors service.
Information about how to choose which publication to write for and submission guidelines are available for all. Please visit
www.emeraldinsight.com/authors for more information.
About Emerald www.emeraldinsight.com
With over forty years' experience, Emerald Group Publishing is a leading independent publisher of global research with impact in
business, society, public policy and education. In total, Emerald publishes over 275 journals and more than 130 book series, as
well as an extensive range of online products and services. Emerald is both COUNTER 3 and TRANSFER compliant. The organization is
a partner of the Committee on Publication Ethics (COPE) and also works with Portico and the LOCKSS initiative for digital archive
preservation.
                                                                        *Related content and download information correct at time of download.
The current issue and full text archive of this journal is available at
                                                www.emeraldinsight.com/1475-7702.htm


RAF
10,2                                              Apparent audit failures
                                                   and value relevance of
                                                  earnings and book value
134
                                                                                      Li Dang
                                            Orfalea College of Business, California Polytechnic State University,
                                                             San Luis Obispo, California, USA
                                                                               Kevin F. Brown
                                                  Department of Accountancy, Raj Soin College of Business,
                                                     Wright State University, Dayton, Ohio, USA, and
                                                                              B.D. McCullough
                                                Department of Decision Sciences, LeBow College of Business,
                                                    Drexel University, Philadelphia, Pennsylvania, USA

                                     Abstract
                                     Purpose – The purpose of this paper is to examine the value relevance of accounting information in
                                     cases of apparent audit failures.
                                     Design/methodology/approach – The authors adopt the bootstrapping technique and compare the
                                     value relevance of key accounting information across samples of firms experiencing apparent audit
                                     failures with matched non-audit failure firms.
                                     Findings – Accounting information is found to be less value relevant for firms experiencing apparent
                                     audit failures, regardless of auditor reputation.
                                     Research limitations/implications – This study has limitations due to the ex ante research
                                     approach adopted. Future research could address this issue by possibly incorporating an “intervening”
                                     factor into the model to indicate how the market can differentiate audit failure firms from other firms.
                                     Originality/value – The paper gives support to the assertion that the market appears to rely less on
                                     accounting numbers when audit failures occur, even though formal allegations of audit failure may not
                                     appear until years after their occurrence. In addition to contributing to value-relevance research by
                                     providing empirical evidence for the market phenomenon around the time of material misstatements,
                                     the paper demonstrates an innovative application of bootstrapping to test for differences in R 2.
                                     Keywords Auditing, Accounting information, Earnings
                                     Paper type Research paper


                                     I. Introduction
                                     DeAngelo (1981, p. 186) defines audit quality as “the market-assessed joint probability
                                     that a given auditor will both (a) discover a breach in the client’s accounting system,
                                     and (b) report the breach.” However, assessment of quality for particular audit
                                     engagements remains somewhat murky, due to the nature of the audit process,
                                     the reporting of audit outcomes, and users’ response to the auditor’s reputation (i.e. a Big
Review of Accounting and Finance     vs non-Big dichotomous audit quality measurement). Previous studies have examined
Vol. 10 No. 2, 2011
pp. 134-154                          the association between audit quality and earnings response coefficients (Teoh and
q Emerald Group Publishing Limited
1475-7702
                                     Wong, 1993). The empirical results appear to support that the market responds
DOI 10.1108/14757701111129616        positively to reputable auditors.
However, whether auditor reputation could serve as a reliable proxy for audit                 Apparent
quality may be unknown due to the high-profile audit failures which occurred during the         audit failures
downturn in the financial markets a decade ago. Many notorious firms, for instance,
Enron, WorldCom, and Tyco, were audited by Big five auditors with reputations similar
or even superior to those of the non-Big five. Thus, one might conclude that an auditor’s
reputation may actually hinder the market’s ability to assess the reliability of accounting
information.                                                                                            135
    The purpose of this paper is to explore whether auditor reputation affects the value
relevance of accounting information in cases of apparent audit failures. For the purpose
of this study, apparent audit failures are defined as instances that an auditor issues
an unqualified opinion on materially misstated financial statements. Since apparent
audit failures indicate poor audit quality, they offer an opportunity to explore the
association between stock prices and accounting information given low audit quality.
Therefore, this study compares ex ante value relevance of accounting information of
publicly held US firms experiencing apparent audit failures with a matched group
of firms not experiencing such failures. Ex ante value relevance refers to value relevance
of accounting information prior to the discovery of audit failures. Matching audit
failure firms with non-audit failure firms allows audit quality to be evaluated on a
“service-by-service” basis, consistent with the suggestion of Lam and Chang (1994).
    This study differs from previous studies on market reactions to news of audit
failures, accounting scandals, or earnings restatements (Chaney and Philipich, 2002;
Dechow et al., 1996; Feroz et al., 1991). Instead of examining stock market reactions to the
news of audit failures, we focus on examining value relevance of accounting information
in the alleged periods of misstatement. Those alleged periods are the reporting periods
when audited financial statements contain material misstatements. We compare
firms experiencing apparent audit failures with matched firms without audit failures in
the same periods in order to find whether there is a difference in value relevance of
accounting information prior to audit failures becoming public. Therefore, this is an
exploratory study that aims to examine market reactions around the time when financial
statements contain misstatements. In addition, we divided our sample into sub-samples
classified by auditor types (i.e. Big 8/6/5/4 auditors vs non-Big 8/6/5/4 auditors) and
conduct the same comparisons to investigate whether such a difference is conditioned on
auditor reputation.
    Several sources are used to identify apparent audit failures (in these cases, an auditor
issues an unqualified opinion on materially misstated financial statements). These
sources include the US Securities and Exchange Commission’s (SEC’s) Accounting and
Auditing Enforcement Releases (AAERs), financial statements restatements because of
past misstatements, and litigation against auditors due to audit failures.
    Consistent with prior research (Collins et al., 1997, 1999; Rees, 1999; Rajgopal et al.,
2002), value relevance is measured by the explanatory power of contemporaneous
earnings and book values for stock prices (i.e. the regression of stock price on earnings
and book values). We apply a bootstrapping analysis to test data collected. The results of
this analysis indicate that the accounting information of firms experiencing apparent
audit failures is generally less value relevant than that of a matched group of firms not
experiencing such failures. Results of sub-sample comparisons further indicate that the
audit reputation may not be essential because the market appears to discount less
reliable accounting information. The remainder of this paper is organized as follows.
RAF    Section II describes prior research pertaining to market perceptions of audit quality.
10,2   Section III contains the development of the research hypothesis. Section IV discusses
       data collection and the research methodology. Section V presents statistical analysis and
       empirical results. Section VI provides concluding remarks.


136    II. Prior research
       Previous studies of audit failures have focused on market reactions to the
       announcements of earnings restatements, fraud class actions, and SEC enforcement
       actions (Liu et al., 2009; Akhigbe et al., 2005; Chaney and Philipich, 2002; Dechow et al.,
       1996; Bhagat et al., 1994; Francis et al., 1994; Kellogg, 1984). Overall, these studies
       have documented a negative market reaction to such announcements. For example,
       Francis et al. (1994) find a negative market response to the corrective disclosure of firms
       experiencing class action litigation. Feroz et al. (1991) document a 10 percent decline in
       stock prices at announcements of accounting violations. Akhigbe et al. (2005) find that
       earnings restatements lead to a negative market response and that the negative response
       is conditioned on the content of earnings management. Liu et al. (2009) find that
       shareholders are more likely to vote against the ratification of the auditor following an
       audit failure. In spite of these findings, none of these studies examine market reactions
       before accounting violations or audit failures became public knowledge.
           Chaney and Philipich (2002) examine the reputation effect of the Enron audit failure.
       Specifically, they investigate the impact of auditor reputation on the market prices of
       Arthur Andersen’s clients around the Enron bankruptcy. After Andersen’s reputation
       was damaged, its clients experienced a significant drop in their stock prices. The result
       of Chaney and Philipich (2002) appears to indicate that market perception of reliability of
       accounting information is conditioned on market perception of auditor reputation.
           Recently, Griffin et al. (2004) investigate the impact of class action litigation of audit
       failures on stock returns and earnings-returns relation in the alleged periods. They find
       that the market responds positively to releases of misleading accounting information. As
       Griffin et al. point out, the primary reason for this result is that the market initially accepts
       the misstated information. Furthermore, the ex post negative reaction to class action lawsuit
       announcement is conditioned on the returns-earnings relation in the alleged periods.
           In summary, except for Griffin et al (2004), most previous studies have focused on
       market reactions around news releases of audit failures instead of examining the market
       reaction to misstated earnings in the alleged periods. To yield additional insights
       for the literature, the purpose of this study is to explore value relevance of accounting
       information when financial statements contain material misstatements. Specifically, we
       examine the contemporaneous association between stock prices and misstated
       accounting information in the periods with alleged misstatement. This study differs
       from other audit failure studies in the following aspects:
           .
              Instead of focusing on ex post market reactions to audit failures, this study
              examines the market perception of the information quality ex ante.
           .
              Instead of using an event study approach, this study examines the association
              between stock prices and accounting information in a longer window.
           .
              This study also provides evidence on whether market perception of information
              quality in the alleged periods is conditioned on auditor reputation.
III. Development of hypothesis                                                                       Apparent
Because apparent audit failures are less ambiguous, they provide a unique way of                  audit failures
testing the market’s perception of accounting information quality ex ante driven by poor
audit quality. Using firms not experiencing apparent audit failures as benchmarks, this
study examines whether the value relevance of accounting information is different for
firms experiencing apparent audit failures from those of benchmarked firms. In this
study, value relevance indicates the extent to which accounting information explains the                   137
variation of market prices. When financial statement users perceive higher information
quality, therefore more reliable financial statements, accounting information such as
earnings and book values should explain more of the variation in stock prices.
    The Ohlson (1995) model is used to test the value relevance of accounting
information (Amir, 1996; Amir and Lev, 1996; Collins et al., 1997, 1999; Rees,
1999; Rajgopal et al., 2002). The Ohlson model relates a firm’s market value to its
contemporaneous accounting information. Specifically, this model provides a structure to
study the relationship between equity values and earnings, as well as its relationship with
book values (Stober, 1999). The degree of value relevance is measured by the R 2 of the
Ohlson model (Collins et al., 1997; Rees, 1999; Rajgopal et al., 2002). The R 2 measures
the degree of the variation in the dependent variable explained by independent variables.
If the perceived information quality (i.e. audit quality) is low, the association between stock
price and accounting information, hence the R 2 of the Ohlson model, should be weak
because accounting information will be viewed as less reliable.
    Owing to the exploratory nature of this study, we state our hypothesis in its null
form:
   H0. There is no difference between the explanatory power of earnings and book
       values for stock prices of firms experiencing apparent audit failures and firms
       not experiencing apparent audit failures.

IV. Data collection and methodology
Cases of apparent audit failures and the matched control group
Firms included in this study are selected from the SEC’s AAERs and restatements
of financial statements found in the Wall Street Journal Index and Lexis-Nexis
News Library for fiscal years ending between 1980 and 2000. The initial sample is
the combination of these two data sources. AAERs indicate firms whose financial
statements containing misstatements documented in the SEC sanctions against firms or
their auditors. We exclude AAER cases where quarterly misstatements are the focus of
the sanction because quarterly statements are only reviewed, but not audited,
by auditors. Restatements consist of firms that restated prior years’ financial statements
because of significant misstatements. These represent apparent audit failures because
auditors did not detect and/or report those material misstatements initially. We searched
keywords with the root “restat-” in Wall Street Journal Index and Lexis-Nexis News
Library. Quarterly restatements are also excluded from our sample. To ensure that the
search of the above two sources did not omit any audit failures; we also searched, as a
secondary source, news accounts of auditor litigation including the auditor litigation
database compiled by Palmrose (1999). Cases of litigation against auditors contain
allegations that auditors failed to detect and report material misstatements. Such cases
are included in this analysis due to possible lags in SEC scrutiny which would ordinarily
result in enforcement activity and/or restatements of prior financial statements.
RAF    Accordingly, litigation cases that provide substantial evidence of audit failure are
10,2   included as apparent audit failures. While lawsuits seeking damages from an auditor are
       not always indicative of the auditor’s failure to adhere to professional standards, such
       suits may reveal audit failures before subsequent issuance of an AAER. A careful review
       of the litigation news accounts helped to ensure that only apparent audit failures are
       captured in the sample.
138       In order to perform hypothesis testing, all accounting data for the years of the alleged
       audit failures that are necessary for testing the proposed relation are extracted from the
       COMPUSTAT database. All stock price information is obtained from the Center for
       Research in Security Prices (CRSP). The matched control group is selected based on
       established matching criteria. These criteria include the year of financial statements,
       auditor size (Big 8/6/5/4 vs non-Big 8/6/5/4), client industry, and client size. The required
       accounting data and price information are compiled for the matched control group from
       COMPUSTAT and CRSP, respectively.

       Model specification
       The model used to test the hypothesis is Ohlson’s (1995) valuation model (Amir, 1996;
       Amir and Lev, 1996; Collins et al., 1997, 1999). The Ohlson model is expressed as follows:

                                    P it ¼ a1 EPS it þ a2 BVPS it þ 1it                          ð1Þ
       where:
            Pit        ¼ closing stock price of firm i’s equity three months after fiscal year
                         end t[1];
             EPSit     ¼ firm i’s reported earnings per share before extraordinary items for
                         period t;
             BVPSit    ¼ firm i’s book value of equity per share at time t;
             1it       ¼ random error term with mean 0 and variance 1; and
             a1 and a2 ¼ the regression coefficients.

       Testing of hypothesis
       To test the hypothesis, comparisons are made between the apparent audit failure group of
       firms and the matched control group of firms not experiencing audit failures. For each
       comparison, two OLS regressions of the Ohlson model are performed: one regression for
       the audit failure group, and the other for the matched control group. If the R 2 for the audit
       failure group is statistically significantly lower than the R 2 for the matched control group,
       it suggests that value relevance of accounting information is lower in the alleged period
       and that the market appears to rely less on accounting information in the alleged
       period when there are material misstatements. If the R 2 for the audit failure group is equal
       to or higher than the R 2 for the matched control group, it suggests that the market may
       be “fooled” in the alleged period. Moreover, we examine whether value relevance of
       accounting information in the alleged period is conditioned on auditor reputation.
       For example, there might be a greater difference in value relevance of accounting
       information for firms audited by Big 8/6/5/4 auditors than those audited by non-Big
       8/6/5/4 auditors. Comparisons we use to test the hypothesis are summarized in Table I.
           Comparison 1 tests whether there is a difference in value relevance of accounting
       information between the audit failure group and the matched group, in general.
Comparisons 2 and 3 test whether value relevance differs within Big 8/6/5/4 and                        Apparent
non-Big 8/6/5/4 groups. Comparisons 4 and 5 directly test whether the difference in value           audit failures
relevance of accounting information between the audit failure group and the matched
group is conditioned on auditor size.

V. Analysis and results
Sample selection and characteristics                                                                             139
We searched both the SEC’s online archives and the Lexis-Nexis News Library for
AAERs. Between 1982 and 2000, AAERs No. 1 through No. 1357 were released. There
are 559 unique firms identified from those AAERs[2]. Of these 559 firms, 383 unique
firms are selected and the remaining 176 firms are deleted because the AAERs:
   (1) do not indicate the years misstated;
   (2) indicate the misstatement years are before 1980;
   (3) pertain to quarterly financial statements; or
   (4) indicate that the auditors are not responsible for the misstated financial
       statements.

Our search for financial restatements in the Wall Street Journal Index and the
Lexis-Nexis News Library yields 462 unique firms with restatements. Of those 462 firms,
273 unique firms meet the requirements for our analysis. The other 189 firms are deleted
for reasons discussed in (1) through (4) above. We then combine the 383 firms sanctioned
in the AAERs with the 273 firms disclosing subsequent restatements and find that
42 firms exist in both data sources. Therefore, we identify 614 firms that experienced
apparent audit failures from these two data sources.
    Since our analysis requires accounting data from COMPUSTAT, we first searched
for the ticker identification numbers for those 614 firms by their firm names
in COMPUSTAT. A total of 154 firms were deleted because they do not have
ticker identification numbers[3], leaving 460 firms remaining for further analysis.
An additional 297 firms that meet our data requirements are found in the auditor
litigation database compiled by Palmrose (1999)[4]. Since 74 of these firms are already
included in our 460-firm sample, our overall sample increased to 683 unique firms.
All these firms have materially misstated annual financial statements within the period
from 1980 to 2000, and their COMPUSTAT ticker identification numbers are available.
    As this study defines apparent audit failures as cases in which auditors provide
unqualified opinions on financial statements that contain material misstatements,
a search of the COMPUSTAT database[5] for those firms receiving unqualified opinions
was performed. Of the 683 firms, 442 firms (848 firm/years) have audit opinion


Comparison       Failure group (AF) auditors    Non-failure group (NAF) auditors

1                Both Big 8/6/5/4 and non-      Both Big 8/6/5/4 and non-Big 8/6/5/4 auditors
                 Big 8/6/5/4 auditors
2                Big 8/6/5/4 auditors           Big 8/6/5/4 auditors
3                Non-Big 8/6/5/4 auditors       Non-Big 8/6/5/4 auditors                                      Table I.
4                Big 8/6/5/4 auditors           Non-Big 8/6/5/4 auditors                        Comparisons used to test
5                Non-Big 8/6/5/4 auditors       Big 8/6/5/4 auditors                                     the hypothesis
RAF                         information available for the specified financial statement years. An additional 26 firms
10,2                        (69 firm/years) were deleted because auditors issued qualified opinions to those firms.
                            Therefore, 416 firms (779 firm/years) are eligible for inclusion as apparent audit failures.
                                The sample for this study was reduced further because of the absence of other data
                            required to test the hypothesis. To test the hypothesis, earnings per share, book value of
                            stockholders’ equity, and stock price data must be available from the COMPUSTAT and
140                         CRSP databases. Given these considerations, the resulting sample of apparent audit
                            failures is 346 firms (616 firm/years). Table II reports the sample size and the industry
                            distribution information of sample firms. Given the matched-pairs design used in this
                            study, each audit failure firm in the sample is matched with a control firm based on year of
                            misstated financial statements, industry (SIC code), company size (total assets), and auditor
                            type (Big 8/6/5/4 vs non-Big 8/6/5/4)[6]. To get the matched pairs, we searched for similar
                            size firms (with total assets within 10 percent) in the same industry (two- to four-digit SIC
                            code) in the alleged years[7]. If there is more than one similar size firm available, we select
                            the one with the closest SIC code. If there is no firm of similar size available in the same
                            industry, we select the firm with the closest total assets. In case there is no matched pair
                            available according to our matching criteria, we drop the audit failure observation.


                            Hypothesis testing
                            Prior accounting research has used a model’s R 2 statistic to measure the value relevance of
                            accounting information (Lang et al., 2003; Sami and Zhou, 2004; Francis and Schipper, 1999;
                            Nwaeze, 1998; Collins et al., 1997; Amir and Lev, 1996; Harris et al., 1994). These studies
                            have measured value relevance as the R 2 resulting from the regressions of stock prices on
                            per share values of earnings and book values of equity. These studies compare value
                            relevance measured by R 2 either over different time periods or across different samples.
                            In this study, R-squares are compared across audit failure and non-audit failure groups to
                            investigate whether there is a difference in value relevance between the group of firms
                            experiencing apparent audit failures and a matched group of firms that do not experience


                            Panel A: sample determination for apparent audit failure cases
                                                                     Number of firms          Number of firm/years
                            Audit failure cases                              416                    779
                            Less: observations without price data              70                   163
                            Sample for testing                               346                    616
                            Panel B: industry distribution for apparent audit failure cases
                            Industry                                     SIC code           Number of observations   Percentage
                            Agriculture, forestry, fishing                  01-09                       1                 0.29
                            Mining                                         10-14                      15                 4.34
                            Construction                                   15-17                       7                 2.02
                            Manufacturing                                  20-39                    127                 36.71
                            Transportation and public utilities            40-49                      31                 8.96
                            Wholesale trade                                50-51                      12                 3.47
                            Retail trade                                   52-59                      38                10.98
                            Finance, insurance, real estate                60-67                      28                 8.09
Table II.                   Services                                       70-89                      82                23.70
Sample determination        Public administration                          90-99                       5                 1.45
and industry distribution   Total                                                                   346                100.00
apparent audit failures. Except in Harris et al. (1994), Lang et al. (2003) and Sami and Zhou      Apparent
(2004), value-relevance studies have not included a formal test for the difference of R 2.
   Harris et al. (1994), Lang et al. (2003) and Sami and Zhou (2004) use the procedure
                                                                                                audit failures
demonstrated in Cramer (1987) to obtain the mean and the variance of R 2. Then, they
conduct a z-test to compare the means of two R 2. A major problem in using the Cramer
method in this context of a z-test is that it depends on the assumption of the normal
distribution of R 2. However, the distribution of R 2 is not normal, even asymptotically                    141
(Anderson, 2003, p. 155). As an example, Figure 1 shows an R 2 distribution given an R 2
of 0.9 for a regression model with ten independent variables (sample size ¼ 100). Visual
inspection of this figure reveals that the distribution of R 2 is not normal. An additional
complication is that calculation of the moments of R 2, which is required to apply
Cramer’s method, is prone to computational difficulties that may produce incorrect
results, even when the requisite formulae seem to be programmed correctly.
   Because of the difficulty and possible unreliability of using the Cramer procedure, this
study uses the bootstrap method to create tests for the difference in R 2. Bootstrapping is
a resampling method that requires fewer assumptions than traditional methods.
In general, it also provides more accurate results. For example, the bootstrap method
does not require normality of the distribution of the R 2 and it can provide a faster
convergence to the expected value of the parameter of interest.
   Since the models cannot be nested to formally test H0: R 2 ¼ R 2 against Ha: R 2 – R 2 ,
                                                               a        b              a    b
we employ the usual approach of comparing the confidence interval for R 2 and the     a
confidence interval for R 2 . Barr (1969) illustrates that the length of the confidence
                            b
intervals for the two-interval test must be constructed with the multiplier:
                                         pffiffiffiffiffiffiffiffiffiffiffiffiffiffiffi
                                    0      n1 þ n2
                                   z ¼ pffiffiffiffiffi pffiffiffiffiffi z0:975
                                          n1 þ n2
if the significance level of 0.05 is desired. When the sample sizes of the two samples are
the same, i.e. both have n observations, the multiplier becomes:
                                     pffiffiffiffiffi       pffiffiffi
                                 0     2n           2
                                z ¼ pffiffiffi z0:975 ¼      z0:975 :
                                     2 n           2
As a result, the percentage of the confidence intervals is 83.4 percent. Therefore,
comparing two 95 percent intervals is incorrect if a ¼ 0.05 is required[8].


                                           20


                                           15


                                           10


                                            5
                                                                                                        Figure 1.
                                                                                                 An example of an
                                                                                                   R 2 distribution
                      0.86       0.88                  0.92       0.94
RAF                    Descriptive statistics
10,2                   The sample selection procedure yields 616 firm/year observations of apparent audit failures,
                       which are matched with a control group in order to test the hypothesis. In the audit failure
                       group, 502 (114) firm/years were audited by Big 8/6/5/4 auditors (non-Big 8/6/5/4 auditors).
                       Table III illustrates the observations included in each comparison[9].
                           Table IV presents descriptive statistics, including the mean, median, and standard
142                    deviation for total assets (TA), stock prices (P), earnings per share (EPS), and book value
                       of equity per share (BVPS) for both groups in each comparison. Table IV also includes a
                       comparison of the means of these variables. Since the distributions of these variables
                       might not be normal, both a two-sample t-test and a nonparametric Wilcoxon test are
                       conducted. In general, the audit failure group and the matched control group are not
                       significantly different in total assets, which reflects a successful control for company
                       size. Because of the matching requirements, the audit failure and non-audit failure
                       groups exhibit different characteristics in firm size, as shown in comparison 4. As stated
                       earlier, in cases where there are no companies available in the same industries with
                       the similar firm sizes as audit failure observations, we select matched pairs with the
                       closest total assets. Consistent with the tendency of larger firms to have Big 8/6/5/4
                       auditors, comparison 4 shows that the average company size of the audit failure
                       group is significantly larger than that of the matched control group. In comparison 5,
                       the Wilcoxon test results show a significant difference in company size, while the
                       two-sample t-test does not indicate a significant difference. The control firms also appear
                       to earn more than the audit failure firms. With the exception of comparison 3, the
                       matched control groups have a higher EPS than the audit failure group.


                                                            Audit failure group               Matched control group

                       Comparison 1
                       Number of observations                      616                                616
                       Big 8/6/5/4                                 502                                502
                       Non-Big 8/6/5/4                             114                                114
                       Comparison 2
                       Number of observations                      502                                502
                       Big 8/6/5/4                                 502                                502
                       Non-Big 8/6/5/4                               0                                  0
                       Comparison 3
                       Number of observations                      114                                114
                       Big 8/6/5/4                                   0                                  0
                       Non-Big 8/6/5/4                             114                                114
                       Comparison 4
                       Number of observations                      463                                463
                       Big 8/6/5/4                                 463                                  0
                       Non-Big 8/6/5/4                               0                                463
Table III.             Comparison 5
Number of firm/year     Number of observations                      114                                114
observations in each   Big 8/6/5/4                                   0                                114
comparison             Non-Big 8/6/5/4                             114                                  0
Apparent
             Auditor failure group                Matched control group                Compare meansa
           Mean     Median        SD             Mean   Median        SD            t-test Wilcoxon test           audit failures
Comparison 1
TA    2,421.1010      135.5100 8,309.7470 1,860.2880 114.5100 6,508.7950 0.1875                 0.332
P        17.4288       12.2500    17.7024    18.3725 12.0630     22.4992 0.4135                 0.9602
EPS     20.0065         0.3450     7.0179     0.7458   0.5000     5.7049 0.0392                 0.0022                           143
BVPS      7.6564       12.2500     9.7234     8.6550   5.7230    16.2675 0.1913                 0.2421
Comparison 2
TA    2,958.4940      224.6000 9,121.2050 2,243.6640 182.2900 7,122.9120 0.1667                 0.2256
P        19.4984       14.7500    17.9248    21.2554 15.2500     23.8012 0.1867                 0.5052
EPS       0.01631       0.4900     7.7616     0.9306   0.7850     6.2850 0.0405                 0.0007
BVPS      8.7918        6.2610    10.2356     9.9054   6.9360    17.6025 0.2208                 0.3822
Comparison 3
TA       54.6836       16.7150     138.4634     172.0858    15.0150 1,447.4700 0.3904           0.9080
P         8.3157        4.0000      13.3492       5.6772     3.4380     6.6272 0.0605           0.2113
EPS     20.1072       2 0.0100       0.9703     20.0679      0.0200     1.0853 0.7734           0.8574
BVPS      3.1489        1.1916       4.3721       2.6570     1.7497     5.3825 0.4496           0.0890
Comparison 4
TA    3,008.3940      211.5500 9,391.1080 1,393.2470        64.5000 9,913.3340 0.0111           0.0000
P        19.6246       14.5000    18.3666    15.1947         8.8750    22.0622 0.0009           0.0000
EPS     20.0472         0.4700     8.0709     0.5576         0.3700     1.6394 0.1147           0.9536
BVPS      8.5995        6.1680    10.4589     7.8357         4.9530    13.6130 0.3386           0.0002
Comparison 5
TA       54.6836       16.7150     138.4634      46.9001    23.3100      70.6154   0.5932       0.0426
P         8.3157        4.0000      13.3492      10.3906     6.7500      14.9525   0.2691       0.0038
EPS     20.1072       2 0.0100       0.9703       0.1656     0.0900       1.3441   0.0796       0.0309
BVPS      3.1489        1.1916       4.3721       4.7300     3.3794       5.4881   0.0018       0.0000
Notes: All p-values less than or equal to 0.05 are shown in italics; aboth p-values of the two-sample t-test                 Table IV.
and the nonparametric two-sample Wilcoxon test are given; TA, total asset at the end of the fiscal year t;      Descriptive statistics for
P, stock price, three month after the end of the fiscal year t; EPS, earnings per share excluding               observations included in
extraordinary items for fiscal year t; BVPS, book value of equity per share at the end of the fiscal year t            hypothesis testing


Hypothesis testing using bootstrap confidence intervals
For the purpose of the current study, 1,000 bootstrap resamples were created by
sampling with replacement from each of the original samples. Each bootstrap resample
is the same size as the original sample[10]. For each bootstrap resample, there is one R 2
generated from the bootstrap regression, which is called R 2 *. Therefore, the 1,000
bootstrap resamples generated 1,000 R 2 *s[11].
    To test whether R 2 of the audit failure group and the matched control group differ, we
compare the 83.4 percent bootstrap percentile confidence intervals of R 2. Figures 2-6
show the histograms about the distribution of R 2 based on bootstrap resamples. The
histograms of R 2 *s sometimes indicate approximate normality, but other times show an
approximately normal central region with non-normality in the tail region. More
importantly, there are three cases where even the central region is obviously non-normal.
Of these three, two cases are the distributions of R 2 for the audit failure groups audited
by non-Big 8/6/5/4 auditors in comparisons 3 and 5, which exhibit an asymmetric
pattern because most R 2 from the bootstrap resamples are very close to zero. The third
case appears in comparison 5, where R 2 for the matched control group audited by Big
RAF                                         15
10,2

                                            10

144
                                  Density


                                             5


                                             0
                                                    0.10          0.15       0.20     0.25
                                                                         R2 star


                                            15


                                            10
                                  Density


                                             5


                                             0
                                                 0.20      0.25   0.30
                                                                   0.35     0.40   0.45    0.50
Figure 2.                                                            R2 star
                                  Notes: R2 *: audit failure group – both Big 8/6/5/4 and non-
Histograms for
                                  Big 8/6/5/4; R2 *: matched control group – both Big 8/6/5/4
comparison 1
                                  and non-Big 8/6/5/4


                 8/6/5/4 auditors appear to have a bimodal distribution, a probability distribution
                 characterized by two humps rather than the more common single hump that
                 characterizes the normal distribution. One hump is near 0.15 and the other is near 0.46.
                 Since we run bootstrap regressions by resampling the residuals from the original
                 regression, the bimodal distribution of R 2 appears to be driven by an outlier in the
                 residuals. Examining the regression output, we find one residual with an extreme value.
                 The bimodality exists when a highly influential point is included in some bootstrap
                 resamples but not in others. When we delete this outlier, the bimodal distribution of R 2
                 disappears. The histogram of R 2 after removing the outlier is shown in Figure 6.
15                                                                          Apparent
                                                                                                     audit failures

                            10
                  Density


                                                                                                                 145
                             5


                             0
                                        0.10    0.15         0.20   0.25      0.30
                                                       R2 star


                            15


                            10
                  Density


                             5


                             0
                                 0.25    0.30   0.35   0.40    0.45     0.50    0.55
                                                    R2 star                                                   Figure 3.
                  Notes: R2 *: audit failure group – Big 8/6/5/4; R2 *: matched
                                                                                                 Histograms comparison 2
                  control failure group – Big 8/6/5/4


As stated earlier, one advantage of bootstrap methods is that they do not require
distributions to be normal. Hence, the above descriptions of a non-normal pattern are not
troublesome. To create 83.4 percent bootstrap percentile confidence intervals, the 1,000 R 2 *s
from bootstrap regressions were sorted in an ascending order. The lower value of the
confidence interval is the 83rd (0.083*1,000) R 2 * and the upper value is the 917th
(0.917*1,000) R 2 *. The results of the bootstrap percentile confidence intervals are shown in
Table V. Comparisons of bootstrap percentile confidence intervals indicate that there are
significant differences in R 2 for the audit failure groups and the matched control groups[12].

Hypothesis testing using the Cramer procedure
To be consistent with prior literature (Harris et al., 1994; Lang et al., 2003; Sami and Zhou,
2004), we perform the test using the Cramer procedure. Cramer (1987) provides a procedure
RAF                                                      30
10,2
                                                         25


                                                         20
146
                                            Density


                                                         15


                                                         10


                                                          5


                                                          0
                                                              0.0         0.1         0.2       0.3   0.4
                                                                                        R2 star


                                                         15


                                                         10
                                               Density


                                                          5


                                                          0
                                                                    0.1         0.2
                                                                                0.3      0.4        0.5      0.6
Figure 4.                                                                      R2 star
                                             Notes: R2 *: audit failure group – non-Big 8/6/5/4; R2 *: matched
Histograms comparison 3
                                             control group – non-Big 8/6/5/4

                          to calculate the first moment and second moment of R 2. Once we have the mean and
                          variance of R 2, we can calculate the z-statistic as in Harris et al. (1994) and Lang et al. (2003)
                          and compare means of R 2 across two samples. The expression of a z-test can be modified
                          as follows since the number of observations of R 2 is only one for each sample:
                                                                                     
                                                                   E R2 2 E R 2
                                                                        1                   2
                                                            z ¼ rffiffiffiffiffiffiffiffiffiffiffiffiffiffiffiffiffiffiffiffiffiffiffiffiffiffiffiffiffiffiffiffiffiffiffi
                                                                                        
                                                                    V R 2 þ V R2
                                                                           1                   2
15                                                                       Apparent
                                                                                                 audit failures

                           10
                                                                                                             147
                 Density


                            5


                            0
                                  0.10     0.15    0.20        0.25       0.30
                                                  R2 star


                           15


                           10
                 Density


                            5


                            0
                                0.2      0.3       0.4         0.5         0.6
                                                   R2 star
                                                                                                          Figure 5.
                 Notes: R2 *: audit failure group – Big 8/6/5/4; R2 *: matched
                                                                                             Histograms comparison 4
                 control group – non-Big 8/6/5/4


The results using the Cramer procedure and z-test are presented in Table VI. These results
are similar to those reported by employing the bootstrap method. Therefore, our results
are robust[13]. As discussed in McCullough and Vinod (1993), caution should be given
when using the Cramer procedure to calculate the mean and standard deviation of the R 2.
For instance, we encountered computer operation overflows, resulting in incorrect
outputs, before we modified our programming to resolve such problems.
RAF                                  30                                                              15

10,2                                 25

                                     20                                                              10


                                                                                           Density
                           Density


                                     15
148
                                     10                                                               5

                                      5

                                      0                                                               0
                                          0.0   0.1   0.2             0.3     0.4                         0.0   0.1   0.2     0.3     0.4   0.5   0.6
                                                       R2 star                                                              R2 star


                                                                      15


                                                                      10
                                                            Density


                                                                       5


                                                                       0
                                                                            0.1     0.2   0.3      0.4          0.5   0.6
Figure 6.                                                                                  R2 star
                          Notes: R2 *: audit failure group – non-Big 8/6/5/4; R2 *: matched control group – Big 8/6/5/4; R2 *:
Histograms comparison 5
                          matched control group – Big 8/6/5/4; after removing the outlier

                          Sensitivity analysis
                          To ensure that our analyses are not affected by potentially confounding factors such
                          as negative earnings or financial distress, we perform several additional analyses.
                          First, as shown in the descriptive statistics, the audit failure group on average exhibits a
                          lower EPS compared with the matched control group. The frequency of losses in the
                          audit failure group is higher compared with the matched control group. Prior literature
                          (Collins et al., 1999; Burgstahler and Dichev, 1997; Hayn, 1995) has suggested that losses
                          are less informative for prices than profits. Therefore, the relation between stock
                          price and earnings and book values of firms in financial distress may be fundamentally
                          different from non-distressed firms. To ensure that our results are not driven by
                          the relatively higher frequency of losses or a greater degree of financial distress among
                          the firms in the audit failure group, we carry out two additional analyses. First,
                          we performed a second matching of non-audit failure firms to the audit failure group,
                          adding two additional matching criteria, return on assets (ROA) and leverage, to control
                          for the influence of financial distress. We also analyze the data after removing all these
                          observations with negative EPS and their pairs in the matched control group.
Apparent
Comparison                                     Failure group                Non-failure group
                                                                                                               audit failures
1             Auditor                         Both Big and non-Big 8/6/ Both Big and non-Big 8/6/
                                              5/4                       5/4
              83 percent bootstrap percentile (0.1344, 0.2234)               (0.3555, 0.4825)
              CI
2             Auditor                         Big 8/6/5/4               Big 8/6/5/4                                         149
              83 percent bootstrap percentile (0.1175, 0.2072)          (0.3520, 0.4877)
              CI
3             Auditor                         Non-Big 8/6/5/4           Non-Big 8/6/5/4
              83 percent bootstrap percentile (0.0068, 0.1161)          (0.2640, 0.5030)
              CI
4             Auditor                         Big 8/6/5/4               Non-Big 8/6/5/4
              83 percent bootstrap percentile (0.1229, 0.2207)          (0.3965, 0.6054)
              CI
5             Auditor                         Non-Big 8/6/5/4           Big 8/6/5/4
              83 percent bootstrap percentile (0.0068, 0.1161)          (0.2045, 0.3894)
              CI                                                                                                         Table V.
                                                                                                          Comparisons of bootstrap
Notes: All p-values less than or equal to 0.05 are shown in italics; regression model: P it ¼ a1 EPS it      percentile confidence
þa2 BVPS it                                                                                                       intervals for R 2


Also, in our original analyses, we include material misstatements that received both
“unqualified opinion” and “unqualified opinion with explanatory language” as audit
failure cases. Some of the “explanatory language” cases refer to an auditor’s substantial
doubts about a firm’s ability to continue as a going concern. Although the “going
concern” opinions are included in the audit failure group, insofar as the auditor’s opinion
on the fairness of the firm’s financial statements is not qualified, it is possible that
firms that receive going concern opinions are fundamentally different from the rest of
the firms in the sample. While we already control for financial distress factor by adding
ROA and financial leverage as two additional matching criteria, we perform additional
analyses after removing all firms with going concern opinions and their matched pairs in
the control group, in order to exclude the possibility that our results are driven by some
other confounding factor associated with the going concern opinion.
    Additionally, we find that a few audit failure firms changed their auditors during the
period their financial statements were misstated. It is possible that these firms might be
different from other firms because they might be priced differently due to the change in
auditors. Previous research (Teoh, 1992) has documented that auditor changes might
affect stock prices and therefore the association between stock prices and accounting
information. Schwartz and Menon (1985) examine the motivations for auditor switching
and consider financial distress as a factor that affects auditor switching. Also, there are
other factors, such as audit opinion qualification (Chow and Rice, 1982) that might
trigger auditor switching. Therefore, in addition to controlling for financial distress, we
also analyze the data without those firms that changed auditors during their
misstatement years. The results of all these additional analyses are consistent with our
original analyses, which support our hypothesis[14].
RAF
                          Comparison                            Failure group                          Non-failure group
10,2
                          1                  Auditor            Both Big and non-Big 8/6/5/4           Both Big and non-Big 8/6/5/4
                                             n                            616                                    616
                                             R2                             0.1714                                 0.4179
                                             Mean (R 2)                     0.1735                                 0.4190
150                                          SD (R 2)                       0.0264                                 0.0270
                                             z-statistic                    6.4977
                          2a                 Auditor                    Big 8/6/5/4                              Big 8/6/5/4
                                             n                            502                                     502
                                             R2                             0.1555                                   0.4129
                                             Mean (R 2)                     0.1582                                   0.4142
                                             SD (R 2)                       0.0286                                   0.0210
                                             z-statistic                    6.1826
                          3b                 Auditor                  Non-Big 8/6/5/4                         Non-Big 8/6/5/4
                                             n                            114                                    114
                                             R2                             0.0266                                 0.3555
                                             Mean (R 2)                     0.0353                                 0.3624
                                             SD (R 2)                       0.0369                                 0.0651
                                             z-statistic                    4.3668
                          4a                 Auditor                    Big 8/6/5/4                           Non-Big 8/6/5/4
                                             n                            463                                    463
                                             R2                             0.1628                                 0.4827
                                             Mean (R 2)                     0.1656                                 0.4839
                                             SD (R 2)                       0.0301                                 0.0291
                                             z-statistic                    7.6015
                          5b                 Auditor                  Non-Big 8/6/5/4                            Big 8/6/5/4
                                             n                           113c                                    113c
                                             R2                             0.0284                                   0.2862
                                             Mean (R 2)                     0.0381                                   0.2946
                                             SD (R 2)                       0.0369                                   0.0663
                                             z-statistic                    3.3805
                          Notes: All p-values less than or equal to 0.05 shown in italics; regression model:
                          P it ¼ a1 EPS it þ a2 BVPS it ; ain comparisons 2 and 4, audit failure group is the same group except
                          the number of observations differs; failure group in both comparisons represents firms audited by Big
                          auditors; in comparison 4, we dropped some failure group firms since we cannot find the matched pairs
                          audited by non-Big auditors; bin comparisons 3 and 5, audit failure group is the same group since it
Table VI.                 represents audit failure firms audited by non-Big auditors; cthe number of observations is due to
Comparison of R 2         deleting an outlier existing in the matched control group and its pair in the audit failure group; similar
using a z-test based      to the bootstrap testing results, z-statistic is not significant before deleting the outlier because the large
on the Cramer procedure   magnitude of the variance of the R 2 for the matched control group, 0.1939


                          VI. Limitations and conclusions
                          Limitations
                          This study has limitations due to the ex ante research approach adopted. Because of this ex
                          ante approach, our matching criteria have to rely on the “noisy” accounting measure, total
                          assets, in the alleged years. Therefore, the matching might not be effective in controlling
                          for size. Although our primary objective is to explore the market phenomenon around
                          the time of material misstatements, exploring why the market discounted accounting
                          information reported by audit failure firms even the news of these misstatements is also
an important question. Future research could address this issue by possibly incorporating           Apparent
an “intervening” factor into the model to indicate how the market can differentiate audit        audit failures
failure firms from other firms. Finally, our analysis is based on the pre-Sarbanes-Oxley
Act (SOX) period and therefore caution must be exercised when generalizing the findings
of this study to the post-SOX period.

Conclusions                                                                                               151
In this study, we examine whether there is a difference in value relevance of accounting
information between firms experiencing apparent audit failures and firms that have not
experienced apparent audit failures. The bootstrap method is used to test for differences
in R 2 across samples. The results suggest that the value relevance of earnings and book
values of equity is lower for firms experiencing apparent audit failures than those for
firms that have not experienced apparent audit failures. Although the market may
exhibit a lower level of confidence in accounting information from firms audited by
non-Big 8/6/5/4 auditors, the results provide evidence that the market generally exhibits
lower confidence in firms experiencing audit failure, regardless of their auditors’ size.
These empirical results show that the explanatory power of accounting information
of firms experiencing apparent auditor failures is lower than that of firms that have not
experienced apparent auditor failures.
    In our view, the market appears to rely less on accounting information reported by
firms experiencing apparent audit failures regardless of auditor size, even though an
apparent audit failure may not be confirmed by future actions and events until well after
its occurrence. Moreover, in comparison 4, accounting information provided by firms
experiencing audit failures and audited by Big 8/6/5/4 auditors is less value relevant
compared with firms audited by non-Big 8/6/5/4 auditors that have not experienced
audit failures. This result suggests the difference in value relevance between the
audit failure group and the matched groups is not conditioned on auditor size. Thus,
as illustrated in comparisons 1 through 5, the results indicate that there is a difference in
value relevance between the audit failure and the matched group ex ante.
    In addition to providing evidence suggesting that auditor size does not impact the
value relevance of accounting information in a dysfunctional manner, this study
demonstrates an innovative application of bootstrapping to test for differences in R 2 in
the context of value-relevance research. We believe this method may allow researchers
to make more precise conclusions when conducting future value-relevance studies.

Notes
 1. According to SEC requirements, before September 2002, Form 10-K had to be filed within
    90 days after the end of the company’s fiscal year.
 2. Several AAERs do not identify firm names. Further, some firms received multiple AAER
    sanctions. There are also some cases where the alleged impropriety involves a governmental
    entity.
 3. Having ticker identification numbers does not necessarily mean that these firms have all
    required data for specific years in question available in COMPUSTAT.
 4. Palmrose’s (1999) database provides tickers for those companies that have ticker
    identification numbers in COMPUSTAT. We exclude those cases of apparent audit failure
    which do not have tickers in the Palmrose (1999) database.
RAF     5. COMPUSTAT data item no. 149 provides both auditor and audit opinion information.
           However, it does not provide reasons why the qualified audit opinions were issued. We
10,2       include auditor opinions with a value 1 (unqualified opinion) and 4 (unqualified opinion with
           explanatory language).
        6. The matched-pairs control group also excludes firms with qualified audit opinions.
        7. By selecting matched pairs according to such criteria, we control for confounding factors
152        such as size, industry, and time period. Since total assets reported by audit failure firms in
           the alleged years could be noisy, control for size might not be very effective. However, we do
           not expect that any discrepancy in matching would cause significant problems given that
           “size” is matched within a ^10 percent range.
        8. For example, if the sample size for two samples are both 300, the multiplier for the confidence
           interval is:
                              pffiffiffiffiffiffiffiffiffiffiffiffiffiffiffi    pffiffiffi pffiffiffiffiffiffiffi        pffiffiffi
                            0  2 £ 300             2 · 300              2
                           z ¼ pffiffiffiffiffiffiffi · z0:975 ¼ pffiffiffiffiffiffiffi · z0:975 ¼      · z0:975 ¼ 0:834:
                               2 300               2 300               2

        9. Note that in comparison 4 in Table II, 39 of the 502 audit failure cases are dropped due to
           inability to match these firm/years with those of a non-Big 8/6/5/4 control group.
       10. For example, for the original sample size of 616 firm/years, the bootstrap resamples also will
           contain 616 observations, but will not be identical to the set of observations in the original
           sample.
       11. See McCullough and Vinod (1993) for details on implementing the bootstrap procedure.
       12. In comparison 5, the result is not significant before the outlier is removed. The confidence
           interval (0.0822, 0.5369) is wide when the outlier is included in the sample because of the
           bimodal distribution of R 2.
       13. If the results are different using these two methods, the bootstrap method should be more
           reliable since the z-test requires normality of the R 2 and the distribution of R 2 is not exactly
           normal.
       14. As a result of the more strict matching criteria, the sample size decreased in the second
           match. We deleted 195, 128, and 61 firm/years with negative EPS, with explanatory
           language and multiple auditors during the misstatement years, respectively. Results from
           these additional analyses are not tabulated.

       References
       Akhigbe, A., Kudla, R.J. and Madura, J. (2005), “Why are some corporate earnings restatements
             more damaging?”, Applied Financial Economics, Vol. 15 No. 5, pp. 327-36.
       Amir, E. (1996), “The effect of accounting aggregation on the value-relevance of financial
             disclosures: the case of SFAS No. 106”, The Accounting Review, Vol. 71 No. 4, pp. 573-90.
       Amir, E. and Lev, B. (1996), “Value-relevance of nonfinancial information: the wireless
             communications industry”, Journal of Accounting and Economics, Vol. 22, pp. 3-30.
       Anderson, T.W. (2003), An Introduction to Multivariate Analysis, Wiley, New York, NY,
             pp. 149-57.
       Barr, D.R. (1969), “Using confidence intervals to test hypotheses”, Journal of Quality Technology,
             Vol. 1, pp. 256-8.
       Bhagat, S., Brickley, J.A. and Coles, J.L. (1994), “The costs of inefficient bargaining and financial
             distress”, Journal of Financial Economics, Vol. 35 No. 2, pp. 221-47.
Burgstahler, D.C. and Dichev, I.D. (1997), “Earnings, adaptation and equity value”,                        Apparent
      The Accounting Review, Vol. 72 No. 2, pp. 187-215.
                                                                                                        audit failures
Chaney, P.K. and Philipich, K.L. (2002), “Shredded reputation: the cost of audit failure”, Journal of
      Accounting Research, Vol. 40 No. 4, pp. 1221-45.
Chow, C.W. and Rice, S.J. (1982), “Qualified auditor opinions and auditor switching”,
      The Accounting Review, Vol. 57 No. 2, pp. 326-35.
Collins, D.W., Maydew, E.L. and Weiss, I.S. (1997), “Changes in the value-relevance of earnings                  153
      and book values over the past forty years”, Journal of Accounting and Economics, Vol. 24,
      pp. 39-67.
Collins, D.W., Pincus, M. and Xie, H. (1999), “Equity valuation and negative earnings”,
      The Accounting Review, Vol. 74 No. 1, pp. 29-61.
Cramer, J.S. (1987), “Mean and variance of R 2 in small and moderate samples”, Journal of
      Econometrics, Vol. 35, pp. 253-66.
DeAngelo, L.E. (1981), “Auditor size and audit quality”, Journal of Accounting and Economics,
      Vol. 3, pp. 183-99.
Dechow, P.M., Sloan, R.G. and Sweeney, A.P. (1996), “Causes and consequences of earnings
      manipulation: an analysis of firms subject to enforcement actions by the SEC”,
      Contemporary Accounting Research, Vol. 13 No. 1, pp. 1-36.
Feroz, E.H., Park, K. and Pastena, V.S. (1991), “The financial and market effects of the SEC’s
      accounting and auditing enforcement releases”, Journal of Accounting Research, Vol. 29
      No. 3, pp. 107-42.
Francis, J. and Schipper, K. (1999), “Have financial statements lost their relevance?”, Journal of
      Accounting Research, Vol. 37, pp. 319-52.
Francis, J., Philbrick, D. and Schipper, K. (1994), “Shareholder litigation and corporate
      disclosures”, Journal of Accounting Research, Vol. 32 No. 2, pp. 137-64.
Griffin, P.A., Grundfest, J.A. and Perino, M.A. (2004), “Stock price response to news of securities
      fraud litigation: an analysis of sequential and conditional information”, ABACUS, Vol. 40
      No. 1, pp. 21-48.
Harris, T.S., Lang, M. and Moller, H.P. (1994), “The value relevance of German accounting
      measures: an empirical analysis”, Journal of Accounting Research, Vol. 32, pp. 187-209.
Hayn, C. (1995), “The information content of losses”, Journal of Accounting and Economics,
      Vol. 20, pp. 125-53.
Kellogg, R.L. (1984), “Accounting activities, security prices, and action lawsuits”, Journal of
      Accounting and Economics, Vol. 6 No. 3, pp. 185-204.
Lam, S. and Chang, S. (1994), “Auditor service quality and auditor size: evidence from initial
      public offerings in Singapore”, Journal of International Accounting Auditing and Taxation,
      Vol. 3 No. 1, pp. 103-14.
Lang, M., Raedy, J.S. and Yetman, M.H. (2003), “How representative are firms that are cross-listed
      in the United States? An analysis of accounting quality”, Journal of Accounting Research,
      Vol. 41, pp. 363-86.
Liu, L., Raghunandan, K. and Rama, D. (2009), “Financial restatements and shareholder
      ratifications of the auditor”, Auditing: A Journal of Practice  Theory, Vol. 28 No. 1,
      pp. 225-40.
McCullough, B.D. and Vinod, H.D. (1993), “Implementing the single bootstrap: some
      computational considerations”, Computational Economics, Vol. 6 No. 1, pp. 1-15.
RAF    Nwaeze, E.T. (1998), “Regulation and the valuation relevance of book value and earnings:
             evidence from the United States”, Contemporary Accounting Research, Vol. 15 No. 4,
10,2         pp. 547-73.
       Ohlson, J.A. (1995), “Earnings, book values, and dividends in equity valuation”, Contemporary
             Accounting Research, Vol. 11 No. 2, pp. 661-87.
       Palmrose, Z. (1999), Empirical Research in Auditor Litigation: Considerations and Data,
154          American Accounting Association, Sarasota, FL.
       Rajgopal, S., Venkatachalam, M. and Kotha, S. (2002), “The value-relevance of network
             advantages: the case of e-commerce firms”, Journal of Accounting Research, Vol. 41,
             pp. 135-62.
       Rees, W.P. (1999), “Influences on the value-relevance of equity and net income in the UK”,
             Managerial Finance, Vol. 25 No. 2, pp. 58-65.
       Sami, H. and Zhou, H. (2004), “A comparison of value relevance of accounting information in
             different segments of the Chinese stock market”, International Journal of Accounting,
             Vol. 39 No. 4, pp. 403-27.
       Schwartz, K.B. and Menon, K. (1985), “Auditor switches by failing firms”, The Accounting
             Review, Vol. 60 No. 2, pp. 248-61.
       Stober, T.L. (1999), “Empirical applications of the Ohlson (1995) and Feltham and Ohlson (1995,
             1996) valuation models”, Managerial Finance, Vol. 25 No. 12, pp. 3-16.
       Teoh, S.H. (1992), “Auditor independence, dismissal threats, and the market reaction to auditor
             switches”, Journal of Accounting Research, Vol. 30, pp. 1-25.
       Teoh, S.H. and Wong, T.J. (1993), “Perceived auditor quality and the earnings response
             coefficient”, The Accounting Review, Vol. 68 No. 2, pp. 346-66.

       Further reading
       Dechow, P.M. (1994), “Accounting earnings and cash flows as measures of firm performance: the
            role of accounting accruals”, Journal of Accounting and Economics, Vol. 18, pp. 3-42.

       About the authors
       Li Dang is an Associated Professor at California Polytechnic State University-San Luis Obispo.
       Her research interests and publications focus on audit quality, international accounting, and
       accounting information systems. She teaches financial accounting and accounting information
       systems courses. Li Dang is the corresponding author and can be contacted at: ldang@calpoly.edu
          Kevin F. Brown is an Associate Professor in the Department of Accountancy of the Raj Soin
       College of Business at Wright State University in Dayton, Ohio. He has published his research in
       several scholarly and professional journals, including Issues in Accounting Education, Journal of
       Accounting Education, and The CPA Journal. He has presented his research at numerous national
       conferences, including Annual Meetings of the American Accounting Association. His primary
       area of research is in auditing and his teaching areas include auditing and financial accounting.
          B.D. McCullough is a Professor of Decision Sciences at Drexel University. Before he joined the
       faculty at Drexel University, he was an Assistant Professor of Economics at Fordham University
       from 1989 to 1994 and a Senior Economist at the Federal Communications Commission from
       1995 to 2000. He is the Associate Editor for five journals and has authored or co-authored more
       than 50 scholarly publications.


       To purchase reprints of this article please e-mail: reprints@emeraldinsight.com
       Or visit our web site for further details: www.emeraldinsight.com/reprints

Mais conteúdo relacionado

Destaque

Network Ethics Conference, Lisbon
Network Ethics Conference, LisbonNetwork Ethics Conference, Lisbon
Network Ethics Conference, LisbonLisa Harris
 
Collaborative approaches to enhancing graduate employability in Sport: event ...
Collaborative approaches to enhancing graduate employability in Sport: event ...Collaborative approaches to enhancing graduate employability in Sport: event ...
Collaborative approaches to enhancing graduate employability in Sport: event ...The Higher Education Academy
 
10 a diversion, earthquakes and tsunamis
10   a diversion, earthquakes and tsunamis10   a diversion, earthquakes and tsunamis
10 a diversion, earthquakes and tsunamiskristentemkin
 
Tiphaine dumartinet contribution research- impact of blogs
Tiphaine dumartinet   contribution research- impact of blogsTiphaine dumartinet   contribution research- impact of blogs
Tiphaine dumartinet contribution research- impact of blogstdumartinet
 
Black Holes - Luka
Black Holes - LukaBlack Holes - Luka
Black Holes - Lukaihsl
 
The Amazing Ambidextrous Executive: Balancing Tensions at the Top
The Amazing Ambidextrous Executive: Balancing Tensions at the TopThe Amazing Ambidextrous Executive: Balancing Tensions at the Top
The Amazing Ambidextrous Executive: Balancing Tensions at the TopThe Clarion Group, Ltd.
 
METEOR - Liling
METEOR - LilingMETEOR - Liling
METEOR - Lilingihsl
 
The Origin of Wealth
The Origin of WealthThe Origin of Wealth
The Origin of Wealthsomanybooks
 
Re-imagining Communities of Practice: from the descriptive to the prospective...
Re-imagining Communities of Practice: from the descriptive to the prospective...Re-imagining Communities of Practice: from the descriptive to the prospective...
Re-imagining Communities of Practice: from the descriptive to the prospective...The Higher Education Academy
 
Sana
SanaSana
Sanaihsl
 

Destaque (16)

Network Ethics Conference, Lisbon
Network Ethics Conference, LisbonNetwork Ethics Conference, Lisbon
Network Ethics Conference, Lisbon
 
Collaborative approaches to enhancing graduate employability in Sport: event ...
Collaborative approaches to enhancing graduate employability in Sport: event ...Collaborative approaches to enhancing graduate employability in Sport: event ...
Collaborative approaches to enhancing graduate employability in Sport: event ...
 
10 a diversion, earthquakes and tsunamis
10   a diversion, earthquakes and tsunamis10   a diversion, earthquakes and tsunamis
10 a diversion, earthquakes and tsunamis
 
Tbl hc6
Tbl hc6Tbl hc6
Tbl hc6
 
Tiphaine dumartinet contribution research- impact of blogs
Tiphaine dumartinet   contribution research- impact of blogsTiphaine dumartinet   contribution research- impact of blogs
Tiphaine dumartinet contribution research- impact of blogs
 
Black Holes - Luka
Black Holes - LukaBlack Holes - Luka
Black Holes - Luka
 
Tbl hc6
Tbl hc6Tbl hc6
Tbl hc6
 
Discurso Academico 1
Discurso Academico 1Discurso Academico 1
Discurso Academico 1
 
Anita van Gils op DIA-symposium 22-2-2013
Anita van Gils op DIA-symposium 22-2-2013Anita van Gils op DIA-symposium 22-2-2013
Anita van Gils op DIA-symposium 22-2-2013
 
The Amazing Ambidextrous Executive: Balancing Tensions at the Top
The Amazing Ambidextrous Executive: Balancing Tensions at the TopThe Amazing Ambidextrous Executive: Balancing Tensions at the Top
The Amazing Ambidextrous Executive: Balancing Tensions at the Top
 
METEOR - Liling
METEOR - LilingMETEOR - Liling
METEOR - Liling
 
Hr archetecture
Hr archetectureHr archetecture
Hr archetecture
 
The Origin of Wealth
The Origin of WealthThe Origin of Wealth
The Origin of Wealth
 
Re-imagining Communities of Practice: from the descriptive to the prospective...
Re-imagining Communities of Practice: from the descriptive to the prospective...Re-imagining Communities of Practice: from the descriptive to the prospective...
Re-imagining Communities of Practice: from the descriptive to the prospective...
 
Sana
SanaSana
Sana
 
Inovacao experience cocreation
Inovacao experience cocreationInovacao experience cocreation
Inovacao experience cocreation
 

Semelhante a Apparent audit

Impact of audit evidence on auditor’s report
Impact of audit evidence on auditor’s reportImpact of audit evidence on auditor’s report
Impact of audit evidence on auditor’s reportAlexander Decker
 
Effect of Auditor Independence on Audit Quality: A Review of Literature
Effect of Auditor Independence on Audit Quality: A Review of LiteratureEffect of Auditor Independence on Audit Quality: A Review of Literature
Effect of Auditor Independence on Audit Quality: A Review of Literatureinventionjournals
 
1 2Cheat Sheet on Evidence and DocumentationACC491J.docx
1     2Cheat Sheet on Evidence and DocumentationACC491J.docx1     2Cheat Sheet on Evidence and DocumentationACC491J.docx
1 2Cheat Sheet on Evidence and DocumentationACC491J.docxhoney725342
 
Mandatory audit rotation and audit quality
Mandatory audit rotation and audit qualityMandatory audit rotation and audit quality
Mandatory audit rotation and audit qualityAlexander Decker
 
AUDITOR’S FEES AND AUDIT QUALITY OF DEPOSIT MONEY BANKS IN NIGERIA.pdf
AUDITOR’S FEES AND AUDIT QUALITY OF DEPOSIT MONEY BANKS IN NIGERIA.pdfAUDITOR’S FEES AND AUDIT QUALITY OF DEPOSIT MONEY BANKS IN NIGERIA.pdf
AUDITOR’S FEES AND AUDIT QUALITY OF DEPOSIT MONEY BANKS IN NIGERIA.pdfOsarenrenAigienohuwa1
 
© 1998 American Accounting AssociationAccounting HorizonsV.docx
© 1998 American Accounting AssociationAccounting HorizonsV.docx© 1998 American Accounting AssociationAccounting HorizonsV.docx
© 1998 American Accounting AssociationAccounting HorizonsV.docxgerardkortney
 
Mandatory audit firm and audit partner rotation
Mandatory audit firm and audit partner rotationMandatory audit firm and audit partner rotation
Mandatory audit firm and audit partner rotationAlexander Decker
 
Audit quality and auditors independence in nigeria
Audit quality and auditors independence in nigeriaAudit quality and auditors independence in nigeria
Audit quality and auditors independence in nigeriaAlexander Decker
 
Audit Firm Rotation and Audit Report Lag in Nigeria
Audit Firm Rotation and Audit Report Lag in NigeriaAudit Firm Rotation and Audit Report Lag in Nigeria
Audit Firm Rotation and Audit Report Lag in NigeriaIOSR Journals
 
31MARCH 2015 THE CPA JOURNALDemonstrating Professional.docx
31MARCH 2015  THE CPA JOURNALDemonstrating Professional.docx31MARCH 2015  THE CPA JOURNALDemonstrating Professional.docx
31MARCH 2015 THE CPA JOURNALDemonstrating Professional.docxgilbertkpeters11344
 
Earnings management and audit adjustments by Oriol Amat and Òscar Elvira
Earnings management and audit adjustments by Oriol Amat and Òscar ElviraEarnings management and audit adjustments by Oriol Amat and Òscar Elvira
Earnings management and audit adjustments by Oriol Amat and Òscar ElviraUPF Barcelona School of Management
 
Explain why inherent risk is set for audit objectives for.docx
Explain why inherent risk is set for audit objectives for.docxExplain why inherent risk is set for audit objectives for.docx
Explain why inherent risk is set for audit objectives for.docxwrite31
 
Supply Chain Metrics That Matter: A Focus on the High-Tech Industry - 2016
Supply Chain Metrics That Matter: A Focus on the High-Tech Industry - 2016Supply Chain Metrics That Matter: A Focus on the High-Tech Industry - 2016
Supply Chain Metrics That Matter: A Focus on the High-Tech Industry - 2016Lora Cecere
 
Introduction to assurance and financial statement auditing
Introduction to assurance and financial statement auditingIntroduction to assurance and financial statement auditing
Introduction to assurance and financial statement auditingMengsongNguon
 

Semelhante a Apparent audit (20)

Impact of audit evidence on auditor’s report
Impact of audit evidence on auditor’s reportImpact of audit evidence on auditor’s report
Impact of audit evidence on auditor’s report
 
Effect of Auditor Independence on Audit Quality: A Review of Literature
Effect of Auditor Independence on Audit Quality: A Review of LiteratureEffect of Auditor Independence on Audit Quality: A Review of Literature
Effect of Auditor Independence on Audit Quality: A Review of Literature
 
1 2Cheat Sheet on Evidence and DocumentationACC491J.docx
1     2Cheat Sheet on Evidence and DocumentationACC491J.docx1     2Cheat Sheet on Evidence and DocumentationACC491J.docx
1 2Cheat Sheet on Evidence and DocumentationACC491J.docx
 
Mandatory audit rotation and audit quality
Mandatory audit rotation and audit qualityMandatory audit rotation and audit quality
Mandatory audit rotation and audit quality
 
I0361064074
I0361064074I0361064074
I0361064074
 
AUDITOR’S FEES AND AUDIT QUALITY OF DEPOSIT MONEY BANKS IN NIGERIA.pdf
AUDITOR’S FEES AND AUDIT QUALITY OF DEPOSIT MONEY BANKS IN NIGERIA.pdfAUDITOR’S FEES AND AUDIT QUALITY OF DEPOSIT MONEY BANKS IN NIGERIA.pdf
AUDITOR’S FEES AND AUDIT QUALITY OF DEPOSIT MONEY BANKS IN NIGERIA.pdf
 
© 1998 American Accounting AssociationAccounting HorizonsV.docx
© 1998 American Accounting AssociationAccounting HorizonsV.docx© 1998 American Accounting AssociationAccounting HorizonsV.docx
© 1998 American Accounting AssociationAccounting HorizonsV.docx
 
Mandatory audit firm and audit partner rotation
Mandatory audit firm and audit partner rotationMandatory audit firm and audit partner rotation
Mandatory audit firm and audit partner rotation
 
JIGAR PPT.pptx
JIGAR PPT.pptxJIGAR PPT.pptx
JIGAR PPT.pptx
 
Nextcard Case Essay
Nextcard Case EssayNextcard Case Essay
Nextcard Case Essay
 
Audit quality and auditors independence in nigeria
Audit quality and auditors independence in nigeriaAudit quality and auditors independence in nigeria
Audit quality and auditors independence in nigeria
 
Audit Firm Rotation and Audit Report Lag in Nigeria
Audit Firm Rotation and Audit Report Lag in NigeriaAudit Firm Rotation and Audit Report Lag in Nigeria
Audit Firm Rotation and Audit Report Lag in Nigeria
 
31MARCH 2015 THE CPA JOURNALDemonstrating Professional.docx
31MARCH 2015  THE CPA JOURNALDemonstrating Professional.docx31MARCH 2015  THE CPA JOURNALDemonstrating Professional.docx
31MARCH 2015 THE CPA JOURNALDemonstrating Professional.docx
 
Acc 490 Preview Full Class
Acc 490 Preview Full ClassAcc 490 Preview Full Class
Acc 490 Preview Full Class
 
Earnings management and audit adjustments by Oriol Amat and Òscar Elvira
Earnings management and audit adjustments by Oriol Amat and Òscar ElviraEarnings management and audit adjustments by Oriol Amat and Òscar Elvira
Earnings management and audit adjustments by Oriol Amat and Òscar Elvira
 
Explain why inherent risk is set for audit objectives for.docx
Explain why inherent risk is set for audit objectives for.docxExplain why inherent risk is set for audit objectives for.docx
Explain why inherent risk is set for audit objectives for.docx
 
Supply Chain Metrics That Matter: A Focus on the High-Tech Industry - 2016
Supply Chain Metrics That Matter: A Focus on the High-Tech Industry - 2016Supply Chain Metrics That Matter: A Focus on the High-Tech Industry - 2016
Supply Chain Metrics That Matter: A Focus on the High-Tech Industry - 2016
 
Chap001.ppt
Chap001.pptChap001.ppt
Chap001.ppt
 
Introduction to assurance and financial statement auditing
Introduction to assurance and financial statement auditingIntroduction to assurance and financial statement auditing
Introduction to assurance and financial statement auditing
 
Chapter 2
Chapter 2Chapter 2
Chapter 2
 

Último

8447779800, Low rate Call girls in Dwarka mor Delhi NCR
8447779800, Low rate Call girls in Dwarka mor Delhi NCR8447779800, Low rate Call girls in Dwarka mor Delhi NCR
8447779800, Low rate Call girls in Dwarka mor Delhi NCRashishs7044
 
International Business Environments and Operations 16th Global Edition test b...
International Business Environments and Operations 16th Global Edition test b...International Business Environments and Operations 16th Global Edition test b...
International Business Environments and Operations 16th Global Edition test b...ssuserf63bd7
 
1911 Gold Corporate Presentation Apr 2024.pdf
1911 Gold Corporate Presentation Apr 2024.pdf1911 Gold Corporate Presentation Apr 2024.pdf
1911 Gold Corporate Presentation Apr 2024.pdfShaun Heinrichs
 
Market Sizes Sample Report - 2024 Edition
Market Sizes Sample Report - 2024 EditionMarket Sizes Sample Report - 2024 Edition
Market Sizes Sample Report - 2024 EditionMintel Group
 
TriStar Gold Corporate Presentation - April 2024
TriStar Gold Corporate Presentation - April 2024TriStar Gold Corporate Presentation - April 2024
TriStar Gold Corporate Presentation - April 2024Adnet Communications
 
Investment in The Coconut Industry by Nancy Cheruiyot
Investment in The Coconut Industry by Nancy CheruiyotInvestment in The Coconut Industry by Nancy Cheruiyot
Investment in The Coconut Industry by Nancy Cheruiyotictsugar
 
Guide Complete Set of Residential Architectural Drawings PDF
Guide Complete Set of Residential Architectural Drawings PDFGuide Complete Set of Residential Architectural Drawings PDF
Guide Complete Set of Residential Architectural Drawings PDFChandresh Chudasama
 
Call Us 📲8800102216📞 Call Girls In DLF City Gurgaon
Call Us 📲8800102216📞 Call Girls In DLF City GurgaonCall Us 📲8800102216📞 Call Girls In DLF City Gurgaon
Call Us 📲8800102216📞 Call Girls In DLF City Gurgaoncallgirls2057
 
PB Project 1: Exploring Your Personal Brand
PB Project 1: Exploring Your Personal BrandPB Project 1: Exploring Your Personal Brand
PB Project 1: Exploring Your Personal BrandSharisaBethune
 
Pitch Deck Teardown: Geodesic.Life's $500k Pre-seed deck
Pitch Deck Teardown: Geodesic.Life's $500k Pre-seed deckPitch Deck Teardown: Geodesic.Life's $500k Pre-seed deck
Pitch Deck Teardown: Geodesic.Life's $500k Pre-seed deckHajeJanKamps
 
FULL ENJOY Call girls in Paharganj Delhi | 8377087607
FULL ENJOY Call girls in Paharganj Delhi | 8377087607FULL ENJOY Call girls in Paharganj Delhi | 8377087607
FULL ENJOY Call girls in Paharganj Delhi | 8377087607dollysharma2066
 
Appkodes Tinder Clone Script with Customisable Solutions.pptx
Appkodes Tinder Clone Script with Customisable Solutions.pptxAppkodes Tinder Clone Script with Customisable Solutions.pptx
Appkodes Tinder Clone Script with Customisable Solutions.pptxappkodes
 
8447779800, Low rate Call girls in Saket Delhi NCR
8447779800, Low rate Call girls in Saket Delhi NCR8447779800, Low rate Call girls in Saket Delhi NCR
8447779800, Low rate Call girls in Saket Delhi NCRashishs7044
 
Kenya Coconut Production Presentation by Dr. Lalith Perera
Kenya Coconut Production Presentation by Dr. Lalith PereraKenya Coconut Production Presentation by Dr. Lalith Perera
Kenya Coconut Production Presentation by Dr. Lalith Pereraictsugar
 
8447779800, Low rate Call girls in Tughlakabad Delhi NCR
8447779800, Low rate Call girls in Tughlakabad Delhi NCR8447779800, Low rate Call girls in Tughlakabad Delhi NCR
8447779800, Low rate Call girls in Tughlakabad Delhi NCRashishs7044
 
Financial-Statement-Analysis-of-Coca-cola-Company.pptx
Financial-Statement-Analysis-of-Coca-cola-Company.pptxFinancial-Statement-Analysis-of-Coca-cola-Company.pptx
Financial-Statement-Analysis-of-Coca-cola-Company.pptxsaniyaimamuddin
 
Fordham -How effective decision-making is within the IT department - Analysis...
Fordham -How effective decision-making is within the IT department - Analysis...Fordham -How effective decision-making is within the IT department - Analysis...
Fordham -How effective decision-making is within the IT department - Analysis...Peter Ward
 
MAHA Global and IPR: Do Actions Speak Louder Than Words?
MAHA Global and IPR: Do Actions Speak Louder Than Words?MAHA Global and IPR: Do Actions Speak Louder Than Words?
MAHA Global and IPR: Do Actions Speak Louder Than Words?Olivia Kresic
 

Último (20)

8447779800, Low rate Call girls in Dwarka mor Delhi NCR
8447779800, Low rate Call girls in Dwarka mor Delhi NCR8447779800, Low rate Call girls in Dwarka mor Delhi NCR
8447779800, Low rate Call girls in Dwarka mor Delhi NCR
 
International Business Environments and Operations 16th Global Edition test b...
International Business Environments and Operations 16th Global Edition test b...International Business Environments and Operations 16th Global Edition test b...
International Business Environments and Operations 16th Global Edition test b...
 
1911 Gold Corporate Presentation Apr 2024.pdf
1911 Gold Corporate Presentation Apr 2024.pdf1911 Gold Corporate Presentation Apr 2024.pdf
1911 Gold Corporate Presentation Apr 2024.pdf
 
Market Sizes Sample Report - 2024 Edition
Market Sizes Sample Report - 2024 EditionMarket Sizes Sample Report - 2024 Edition
Market Sizes Sample Report - 2024 Edition
 
TriStar Gold Corporate Presentation - April 2024
TriStar Gold Corporate Presentation - April 2024TriStar Gold Corporate Presentation - April 2024
TriStar Gold Corporate Presentation - April 2024
 
Investment in The Coconut Industry by Nancy Cheruiyot
Investment in The Coconut Industry by Nancy CheruiyotInvestment in The Coconut Industry by Nancy Cheruiyot
Investment in The Coconut Industry by Nancy Cheruiyot
 
Guide Complete Set of Residential Architectural Drawings PDF
Guide Complete Set of Residential Architectural Drawings PDFGuide Complete Set of Residential Architectural Drawings PDF
Guide Complete Set of Residential Architectural Drawings PDF
 
Call Us ➥9319373153▻Call Girls In North Goa
Call Us ➥9319373153▻Call Girls In North GoaCall Us ➥9319373153▻Call Girls In North Goa
Call Us ➥9319373153▻Call Girls In North Goa
 
Call Us 📲8800102216📞 Call Girls In DLF City Gurgaon
Call Us 📲8800102216📞 Call Girls In DLF City GurgaonCall Us 📲8800102216📞 Call Girls In DLF City Gurgaon
Call Us 📲8800102216📞 Call Girls In DLF City Gurgaon
 
PB Project 1: Exploring Your Personal Brand
PB Project 1: Exploring Your Personal BrandPB Project 1: Exploring Your Personal Brand
PB Project 1: Exploring Your Personal Brand
 
Pitch Deck Teardown: Geodesic.Life's $500k Pre-seed deck
Pitch Deck Teardown: Geodesic.Life's $500k Pre-seed deckPitch Deck Teardown: Geodesic.Life's $500k Pre-seed deck
Pitch Deck Teardown: Geodesic.Life's $500k Pre-seed deck
 
FULL ENJOY Call girls in Paharganj Delhi | 8377087607
FULL ENJOY Call girls in Paharganj Delhi | 8377087607FULL ENJOY Call girls in Paharganj Delhi | 8377087607
FULL ENJOY Call girls in Paharganj Delhi | 8377087607
 
Appkodes Tinder Clone Script with Customisable Solutions.pptx
Appkodes Tinder Clone Script with Customisable Solutions.pptxAppkodes Tinder Clone Script with Customisable Solutions.pptx
Appkodes Tinder Clone Script with Customisable Solutions.pptx
 
8447779800, Low rate Call girls in Saket Delhi NCR
8447779800, Low rate Call girls in Saket Delhi NCR8447779800, Low rate Call girls in Saket Delhi NCR
8447779800, Low rate Call girls in Saket Delhi NCR
 
No-1 Call Girls In Goa 93193 VIP 73153 Escort service In North Goa Panaji, Ca...
No-1 Call Girls In Goa 93193 VIP 73153 Escort service In North Goa Panaji, Ca...No-1 Call Girls In Goa 93193 VIP 73153 Escort service In North Goa Panaji, Ca...
No-1 Call Girls In Goa 93193 VIP 73153 Escort service In North Goa Panaji, Ca...
 
Kenya Coconut Production Presentation by Dr. Lalith Perera
Kenya Coconut Production Presentation by Dr. Lalith PereraKenya Coconut Production Presentation by Dr. Lalith Perera
Kenya Coconut Production Presentation by Dr. Lalith Perera
 
8447779800, Low rate Call girls in Tughlakabad Delhi NCR
8447779800, Low rate Call girls in Tughlakabad Delhi NCR8447779800, Low rate Call girls in Tughlakabad Delhi NCR
8447779800, Low rate Call girls in Tughlakabad Delhi NCR
 
Financial-Statement-Analysis-of-Coca-cola-Company.pptx
Financial-Statement-Analysis-of-Coca-cola-Company.pptxFinancial-Statement-Analysis-of-Coca-cola-Company.pptx
Financial-Statement-Analysis-of-Coca-cola-Company.pptx
 
Fordham -How effective decision-making is within the IT department - Analysis...
Fordham -How effective decision-making is within the IT department - Analysis...Fordham -How effective decision-making is within the IT department - Analysis...
Fordham -How effective decision-making is within the IT department - Analysis...
 
MAHA Global and IPR: Do Actions Speak Louder Than Words?
MAHA Global and IPR: Do Actions Speak Louder Than Words?MAHA Global and IPR: Do Actions Speak Louder Than Words?
MAHA Global and IPR: Do Actions Speak Louder Than Words?
 

Apparent audit

  • 1. Review of Accounting and Finance Emerald Article: Apparent audit failures and value relevance of earnings and book value Li Dang, Kevin F. Brown, B.D. McCullough Article information: To cite this document: Li Dang, Kevin F. Brown, B.D. McCullough, (2011),"Apparent audit failures and value relevance of earnings and book value", Review of Accounting and Finance, Vol. 10 Iss: 2 pp. 134 - 154 Permanent link to this document: http://dx.doi.org/10.1108/14757701111129616 Downloaded on: 29-06-2012 References: This document contains references to 36 other documents To copy this document: permissions@emeraldinsight.com This document has been downloaded 973 times since 2011. * Users who downloaded this Article also downloaded: * Imen Khanchel El Mehdi, Souad Seboui, (2011),"Corporate diversification and earnings management", Review of Accounting and Finance, Vol. 10 Iss: 2 pp. 176 - 196 http://dx.doi.org/10.1108/14757701111129634 Haidan Li, Yiming Qian, (2011),"Outside CEO directors on compensation committees: whose side are they on?", Review of Accounting and Finance, Vol. 10 Iss: 2 pp. 110 - 133 http://dx.doi.org/10.1108/14757701111129607 Edward M. Werner, (2011),"The value relevance of pension accounting information: evidence from <IT>Fortune</IT> 200 firms", Review of Accounting and Finance, Vol. 10 Iss: 4 pp. 427 - 458 http://dx.doi.org/10.1108/14757701111185362 Access to this document was granted through an Emerald subscription provided by Universidad Nacional de Cordoba For Authors: If you would like to write for this, or any other Emerald publication, then please use our Emerald for Authors service. Information about how to choose which publication to write for and submission guidelines are available for all. Please visit www.emeraldinsight.com/authors for more information. About Emerald www.emeraldinsight.com With over forty years' experience, Emerald Group Publishing is a leading independent publisher of global research with impact in business, society, public policy and education. In total, Emerald publishes over 275 journals and more than 130 book series, as well as an extensive range of online products and services. Emerald is both COUNTER 3 and TRANSFER compliant. The organization is a partner of the Committee on Publication Ethics (COPE) and also works with Portico and the LOCKSS initiative for digital archive preservation. *Related content and download information correct at time of download.
  • 2. The current issue and full text archive of this journal is available at www.emeraldinsight.com/1475-7702.htm RAF 10,2 Apparent audit failures and value relevance of earnings and book value 134 Li Dang Orfalea College of Business, California Polytechnic State University, San Luis Obispo, California, USA Kevin F. Brown Department of Accountancy, Raj Soin College of Business, Wright State University, Dayton, Ohio, USA, and B.D. McCullough Department of Decision Sciences, LeBow College of Business, Drexel University, Philadelphia, Pennsylvania, USA Abstract Purpose – The purpose of this paper is to examine the value relevance of accounting information in cases of apparent audit failures. Design/methodology/approach – The authors adopt the bootstrapping technique and compare the value relevance of key accounting information across samples of firms experiencing apparent audit failures with matched non-audit failure firms. Findings – Accounting information is found to be less value relevant for firms experiencing apparent audit failures, regardless of auditor reputation. Research limitations/implications – This study has limitations due to the ex ante research approach adopted. Future research could address this issue by possibly incorporating an “intervening” factor into the model to indicate how the market can differentiate audit failure firms from other firms. Originality/value – The paper gives support to the assertion that the market appears to rely less on accounting numbers when audit failures occur, even though formal allegations of audit failure may not appear until years after their occurrence. In addition to contributing to value-relevance research by providing empirical evidence for the market phenomenon around the time of material misstatements, the paper demonstrates an innovative application of bootstrapping to test for differences in R 2. Keywords Auditing, Accounting information, Earnings Paper type Research paper I. Introduction DeAngelo (1981, p. 186) defines audit quality as “the market-assessed joint probability that a given auditor will both (a) discover a breach in the client’s accounting system, and (b) report the breach.” However, assessment of quality for particular audit engagements remains somewhat murky, due to the nature of the audit process, the reporting of audit outcomes, and users’ response to the auditor’s reputation (i.e. a Big Review of Accounting and Finance vs non-Big dichotomous audit quality measurement). Previous studies have examined Vol. 10 No. 2, 2011 pp. 134-154 the association between audit quality and earnings response coefficients (Teoh and q Emerald Group Publishing Limited 1475-7702 Wong, 1993). The empirical results appear to support that the market responds DOI 10.1108/14757701111129616 positively to reputable auditors.
  • 3. However, whether auditor reputation could serve as a reliable proxy for audit Apparent quality may be unknown due to the high-profile audit failures which occurred during the audit failures downturn in the financial markets a decade ago. Many notorious firms, for instance, Enron, WorldCom, and Tyco, were audited by Big five auditors with reputations similar or even superior to those of the non-Big five. Thus, one might conclude that an auditor’s reputation may actually hinder the market’s ability to assess the reliability of accounting information. 135 The purpose of this paper is to explore whether auditor reputation affects the value relevance of accounting information in cases of apparent audit failures. For the purpose of this study, apparent audit failures are defined as instances that an auditor issues an unqualified opinion on materially misstated financial statements. Since apparent audit failures indicate poor audit quality, they offer an opportunity to explore the association between stock prices and accounting information given low audit quality. Therefore, this study compares ex ante value relevance of accounting information of publicly held US firms experiencing apparent audit failures with a matched group of firms not experiencing such failures. Ex ante value relevance refers to value relevance of accounting information prior to the discovery of audit failures. Matching audit failure firms with non-audit failure firms allows audit quality to be evaluated on a “service-by-service” basis, consistent with the suggestion of Lam and Chang (1994). This study differs from previous studies on market reactions to news of audit failures, accounting scandals, or earnings restatements (Chaney and Philipich, 2002; Dechow et al., 1996; Feroz et al., 1991). Instead of examining stock market reactions to the news of audit failures, we focus on examining value relevance of accounting information in the alleged periods of misstatement. Those alleged periods are the reporting periods when audited financial statements contain material misstatements. We compare firms experiencing apparent audit failures with matched firms without audit failures in the same periods in order to find whether there is a difference in value relevance of accounting information prior to audit failures becoming public. Therefore, this is an exploratory study that aims to examine market reactions around the time when financial statements contain misstatements. In addition, we divided our sample into sub-samples classified by auditor types (i.e. Big 8/6/5/4 auditors vs non-Big 8/6/5/4 auditors) and conduct the same comparisons to investigate whether such a difference is conditioned on auditor reputation. Several sources are used to identify apparent audit failures (in these cases, an auditor issues an unqualified opinion on materially misstated financial statements). These sources include the US Securities and Exchange Commission’s (SEC’s) Accounting and Auditing Enforcement Releases (AAERs), financial statements restatements because of past misstatements, and litigation against auditors due to audit failures. Consistent with prior research (Collins et al., 1997, 1999; Rees, 1999; Rajgopal et al., 2002), value relevance is measured by the explanatory power of contemporaneous earnings and book values for stock prices (i.e. the regression of stock price on earnings and book values). We apply a bootstrapping analysis to test data collected. The results of this analysis indicate that the accounting information of firms experiencing apparent audit failures is generally less value relevant than that of a matched group of firms not experiencing such failures. Results of sub-sample comparisons further indicate that the audit reputation may not be essential because the market appears to discount less reliable accounting information. The remainder of this paper is organized as follows.
  • 4. RAF Section II describes prior research pertaining to market perceptions of audit quality. 10,2 Section III contains the development of the research hypothesis. Section IV discusses data collection and the research methodology. Section V presents statistical analysis and empirical results. Section VI provides concluding remarks. 136 II. Prior research Previous studies of audit failures have focused on market reactions to the announcements of earnings restatements, fraud class actions, and SEC enforcement actions (Liu et al., 2009; Akhigbe et al., 2005; Chaney and Philipich, 2002; Dechow et al., 1996; Bhagat et al., 1994; Francis et al., 1994; Kellogg, 1984). Overall, these studies have documented a negative market reaction to such announcements. For example, Francis et al. (1994) find a negative market response to the corrective disclosure of firms experiencing class action litigation. Feroz et al. (1991) document a 10 percent decline in stock prices at announcements of accounting violations. Akhigbe et al. (2005) find that earnings restatements lead to a negative market response and that the negative response is conditioned on the content of earnings management. Liu et al. (2009) find that shareholders are more likely to vote against the ratification of the auditor following an audit failure. In spite of these findings, none of these studies examine market reactions before accounting violations or audit failures became public knowledge. Chaney and Philipich (2002) examine the reputation effect of the Enron audit failure. Specifically, they investigate the impact of auditor reputation on the market prices of Arthur Andersen’s clients around the Enron bankruptcy. After Andersen’s reputation was damaged, its clients experienced a significant drop in their stock prices. The result of Chaney and Philipich (2002) appears to indicate that market perception of reliability of accounting information is conditioned on market perception of auditor reputation. Recently, Griffin et al. (2004) investigate the impact of class action litigation of audit failures on stock returns and earnings-returns relation in the alleged periods. They find that the market responds positively to releases of misleading accounting information. As Griffin et al. point out, the primary reason for this result is that the market initially accepts the misstated information. Furthermore, the ex post negative reaction to class action lawsuit announcement is conditioned on the returns-earnings relation in the alleged periods. In summary, except for Griffin et al (2004), most previous studies have focused on market reactions around news releases of audit failures instead of examining the market reaction to misstated earnings in the alleged periods. To yield additional insights for the literature, the purpose of this study is to explore value relevance of accounting information when financial statements contain material misstatements. Specifically, we examine the contemporaneous association between stock prices and misstated accounting information in the periods with alleged misstatement. This study differs from other audit failure studies in the following aspects: . Instead of focusing on ex post market reactions to audit failures, this study examines the market perception of the information quality ex ante. . Instead of using an event study approach, this study examines the association between stock prices and accounting information in a longer window. . This study also provides evidence on whether market perception of information quality in the alleged periods is conditioned on auditor reputation.
  • 5. III. Development of hypothesis Apparent Because apparent audit failures are less ambiguous, they provide a unique way of audit failures testing the market’s perception of accounting information quality ex ante driven by poor audit quality. Using firms not experiencing apparent audit failures as benchmarks, this study examines whether the value relevance of accounting information is different for firms experiencing apparent audit failures from those of benchmarked firms. In this study, value relevance indicates the extent to which accounting information explains the 137 variation of market prices. When financial statement users perceive higher information quality, therefore more reliable financial statements, accounting information such as earnings and book values should explain more of the variation in stock prices. The Ohlson (1995) model is used to test the value relevance of accounting information (Amir, 1996; Amir and Lev, 1996; Collins et al., 1997, 1999; Rees, 1999; Rajgopal et al., 2002). The Ohlson model relates a firm’s market value to its contemporaneous accounting information. Specifically, this model provides a structure to study the relationship between equity values and earnings, as well as its relationship with book values (Stober, 1999). The degree of value relevance is measured by the R 2 of the Ohlson model (Collins et al., 1997; Rees, 1999; Rajgopal et al., 2002). The R 2 measures the degree of the variation in the dependent variable explained by independent variables. If the perceived information quality (i.e. audit quality) is low, the association between stock price and accounting information, hence the R 2 of the Ohlson model, should be weak because accounting information will be viewed as less reliable. Owing to the exploratory nature of this study, we state our hypothesis in its null form: H0. There is no difference between the explanatory power of earnings and book values for stock prices of firms experiencing apparent audit failures and firms not experiencing apparent audit failures. IV. Data collection and methodology Cases of apparent audit failures and the matched control group Firms included in this study are selected from the SEC’s AAERs and restatements of financial statements found in the Wall Street Journal Index and Lexis-Nexis News Library for fiscal years ending between 1980 and 2000. The initial sample is the combination of these two data sources. AAERs indicate firms whose financial statements containing misstatements documented in the SEC sanctions against firms or their auditors. We exclude AAER cases where quarterly misstatements are the focus of the sanction because quarterly statements are only reviewed, but not audited, by auditors. Restatements consist of firms that restated prior years’ financial statements because of significant misstatements. These represent apparent audit failures because auditors did not detect and/or report those material misstatements initially. We searched keywords with the root “restat-” in Wall Street Journal Index and Lexis-Nexis News Library. Quarterly restatements are also excluded from our sample. To ensure that the search of the above two sources did not omit any audit failures; we also searched, as a secondary source, news accounts of auditor litigation including the auditor litigation database compiled by Palmrose (1999). Cases of litigation against auditors contain allegations that auditors failed to detect and report material misstatements. Such cases are included in this analysis due to possible lags in SEC scrutiny which would ordinarily result in enforcement activity and/or restatements of prior financial statements.
  • 6. RAF Accordingly, litigation cases that provide substantial evidence of audit failure are 10,2 included as apparent audit failures. While lawsuits seeking damages from an auditor are not always indicative of the auditor’s failure to adhere to professional standards, such suits may reveal audit failures before subsequent issuance of an AAER. A careful review of the litigation news accounts helped to ensure that only apparent audit failures are captured in the sample. 138 In order to perform hypothesis testing, all accounting data for the years of the alleged audit failures that are necessary for testing the proposed relation are extracted from the COMPUSTAT database. All stock price information is obtained from the Center for Research in Security Prices (CRSP). The matched control group is selected based on established matching criteria. These criteria include the year of financial statements, auditor size (Big 8/6/5/4 vs non-Big 8/6/5/4), client industry, and client size. The required accounting data and price information are compiled for the matched control group from COMPUSTAT and CRSP, respectively. Model specification The model used to test the hypothesis is Ohlson’s (1995) valuation model (Amir, 1996; Amir and Lev, 1996; Collins et al., 1997, 1999). The Ohlson model is expressed as follows: P it ¼ a1 EPS it þ a2 BVPS it þ 1it ð1Þ where: Pit ¼ closing stock price of firm i’s equity three months after fiscal year end t[1]; EPSit ¼ firm i’s reported earnings per share before extraordinary items for period t; BVPSit ¼ firm i’s book value of equity per share at time t; 1it ¼ random error term with mean 0 and variance 1; and a1 and a2 ¼ the regression coefficients. Testing of hypothesis To test the hypothesis, comparisons are made between the apparent audit failure group of firms and the matched control group of firms not experiencing audit failures. For each comparison, two OLS regressions of the Ohlson model are performed: one regression for the audit failure group, and the other for the matched control group. If the R 2 for the audit failure group is statistically significantly lower than the R 2 for the matched control group, it suggests that value relevance of accounting information is lower in the alleged period and that the market appears to rely less on accounting information in the alleged period when there are material misstatements. If the R 2 for the audit failure group is equal to or higher than the R 2 for the matched control group, it suggests that the market may be “fooled” in the alleged period. Moreover, we examine whether value relevance of accounting information in the alleged period is conditioned on auditor reputation. For example, there might be a greater difference in value relevance of accounting information for firms audited by Big 8/6/5/4 auditors than those audited by non-Big 8/6/5/4 auditors. Comparisons we use to test the hypothesis are summarized in Table I. Comparison 1 tests whether there is a difference in value relevance of accounting information between the audit failure group and the matched group, in general.
  • 7. Comparisons 2 and 3 test whether value relevance differs within Big 8/6/5/4 and Apparent non-Big 8/6/5/4 groups. Comparisons 4 and 5 directly test whether the difference in value audit failures relevance of accounting information between the audit failure group and the matched group is conditioned on auditor size. V. Analysis and results Sample selection and characteristics 139 We searched both the SEC’s online archives and the Lexis-Nexis News Library for AAERs. Between 1982 and 2000, AAERs No. 1 through No. 1357 were released. There are 559 unique firms identified from those AAERs[2]. Of these 559 firms, 383 unique firms are selected and the remaining 176 firms are deleted because the AAERs: (1) do not indicate the years misstated; (2) indicate the misstatement years are before 1980; (3) pertain to quarterly financial statements; or (4) indicate that the auditors are not responsible for the misstated financial statements. Our search for financial restatements in the Wall Street Journal Index and the Lexis-Nexis News Library yields 462 unique firms with restatements. Of those 462 firms, 273 unique firms meet the requirements for our analysis. The other 189 firms are deleted for reasons discussed in (1) through (4) above. We then combine the 383 firms sanctioned in the AAERs with the 273 firms disclosing subsequent restatements and find that 42 firms exist in both data sources. Therefore, we identify 614 firms that experienced apparent audit failures from these two data sources. Since our analysis requires accounting data from COMPUSTAT, we first searched for the ticker identification numbers for those 614 firms by their firm names in COMPUSTAT. A total of 154 firms were deleted because they do not have ticker identification numbers[3], leaving 460 firms remaining for further analysis. An additional 297 firms that meet our data requirements are found in the auditor litigation database compiled by Palmrose (1999)[4]. Since 74 of these firms are already included in our 460-firm sample, our overall sample increased to 683 unique firms. All these firms have materially misstated annual financial statements within the period from 1980 to 2000, and their COMPUSTAT ticker identification numbers are available. As this study defines apparent audit failures as cases in which auditors provide unqualified opinions on financial statements that contain material misstatements, a search of the COMPUSTAT database[5] for those firms receiving unqualified opinions was performed. Of the 683 firms, 442 firms (848 firm/years) have audit opinion Comparison Failure group (AF) auditors Non-failure group (NAF) auditors 1 Both Big 8/6/5/4 and non- Both Big 8/6/5/4 and non-Big 8/6/5/4 auditors Big 8/6/5/4 auditors 2 Big 8/6/5/4 auditors Big 8/6/5/4 auditors 3 Non-Big 8/6/5/4 auditors Non-Big 8/6/5/4 auditors Table I. 4 Big 8/6/5/4 auditors Non-Big 8/6/5/4 auditors Comparisons used to test 5 Non-Big 8/6/5/4 auditors Big 8/6/5/4 auditors the hypothesis
  • 8. RAF information available for the specified financial statement years. An additional 26 firms 10,2 (69 firm/years) were deleted because auditors issued qualified opinions to those firms. Therefore, 416 firms (779 firm/years) are eligible for inclusion as apparent audit failures. The sample for this study was reduced further because of the absence of other data required to test the hypothesis. To test the hypothesis, earnings per share, book value of stockholders’ equity, and stock price data must be available from the COMPUSTAT and 140 CRSP databases. Given these considerations, the resulting sample of apparent audit failures is 346 firms (616 firm/years). Table II reports the sample size and the industry distribution information of sample firms. Given the matched-pairs design used in this study, each audit failure firm in the sample is matched with a control firm based on year of misstated financial statements, industry (SIC code), company size (total assets), and auditor type (Big 8/6/5/4 vs non-Big 8/6/5/4)[6]. To get the matched pairs, we searched for similar size firms (with total assets within 10 percent) in the same industry (two- to four-digit SIC code) in the alleged years[7]. If there is more than one similar size firm available, we select the one with the closest SIC code. If there is no firm of similar size available in the same industry, we select the firm with the closest total assets. In case there is no matched pair available according to our matching criteria, we drop the audit failure observation. Hypothesis testing Prior accounting research has used a model’s R 2 statistic to measure the value relevance of accounting information (Lang et al., 2003; Sami and Zhou, 2004; Francis and Schipper, 1999; Nwaeze, 1998; Collins et al., 1997; Amir and Lev, 1996; Harris et al., 1994). These studies have measured value relevance as the R 2 resulting from the regressions of stock prices on per share values of earnings and book values of equity. These studies compare value relevance measured by R 2 either over different time periods or across different samples. In this study, R-squares are compared across audit failure and non-audit failure groups to investigate whether there is a difference in value relevance between the group of firms experiencing apparent audit failures and a matched group of firms that do not experience Panel A: sample determination for apparent audit failure cases Number of firms Number of firm/years Audit failure cases 416 779 Less: observations without price data 70 163 Sample for testing 346 616 Panel B: industry distribution for apparent audit failure cases Industry SIC code Number of observations Percentage Agriculture, forestry, fishing 01-09 1 0.29 Mining 10-14 15 4.34 Construction 15-17 7 2.02 Manufacturing 20-39 127 36.71 Transportation and public utilities 40-49 31 8.96 Wholesale trade 50-51 12 3.47 Retail trade 52-59 38 10.98 Finance, insurance, real estate 60-67 28 8.09 Table II. Services 70-89 82 23.70 Sample determination Public administration 90-99 5 1.45 and industry distribution Total 346 100.00
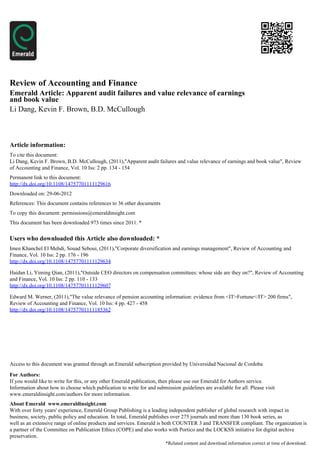
  • 9. apparent audit failures. Except in Harris et al. (1994), Lang et al. (2003) and Sami and Zhou Apparent (2004), value-relevance studies have not included a formal test for the difference of R 2. Harris et al. (1994), Lang et al. (2003) and Sami and Zhou (2004) use the procedure audit failures demonstrated in Cramer (1987) to obtain the mean and the variance of R 2. Then, they conduct a z-test to compare the means of two R 2. A major problem in using the Cramer method in this context of a z-test is that it depends on the assumption of the normal distribution of R 2. However, the distribution of R 2 is not normal, even asymptotically 141 (Anderson, 2003, p. 155). As an example, Figure 1 shows an R 2 distribution given an R 2 of 0.9 for a regression model with ten independent variables (sample size ¼ 100). Visual inspection of this figure reveals that the distribution of R 2 is not normal. An additional complication is that calculation of the moments of R 2, which is required to apply Cramer’s method, is prone to computational difficulties that may produce incorrect results, even when the requisite formulae seem to be programmed correctly. Because of the difficulty and possible unreliability of using the Cramer procedure, this study uses the bootstrap method to create tests for the difference in R 2. Bootstrapping is a resampling method that requires fewer assumptions than traditional methods. In general, it also provides more accurate results. For example, the bootstrap method does not require normality of the distribution of the R 2 and it can provide a faster convergence to the expected value of the parameter of interest. Since the models cannot be nested to formally test H0: R 2 ¼ R 2 against Ha: R 2 – R 2 , a b a b we employ the usual approach of comparing the confidence interval for R 2 and the a confidence interval for R 2 . Barr (1969) illustrates that the length of the confidence b intervals for the two-interval test must be constructed with the multiplier: pffiffiffiffiffiffiffiffiffiffiffiffiffiffiffi 0 n1 þ n2 z ¼ pffiffiffiffiffi pffiffiffiffiffi z0:975 n1 þ n2 if the significance level of 0.05 is desired. When the sample sizes of the two samples are the same, i.e. both have n observations, the multiplier becomes: pffiffiffiffiffi pffiffiffi 0 2n 2 z ¼ pffiffiffi z0:975 ¼ z0:975 : 2 n 2 As a result, the percentage of the confidence intervals is 83.4 percent. Therefore, comparing two 95 percent intervals is incorrect if a ¼ 0.05 is required[8]. 20 15 10 5 Figure 1. An example of an R 2 distribution 0.86 0.88 0.92 0.94
  • 10. RAF Descriptive statistics 10,2 The sample selection procedure yields 616 firm/year observations of apparent audit failures, which are matched with a control group in order to test the hypothesis. In the audit failure group, 502 (114) firm/years were audited by Big 8/6/5/4 auditors (non-Big 8/6/5/4 auditors). Table III illustrates the observations included in each comparison[9]. Table IV presents descriptive statistics, including the mean, median, and standard 142 deviation for total assets (TA), stock prices (P), earnings per share (EPS), and book value of equity per share (BVPS) for both groups in each comparison. Table IV also includes a comparison of the means of these variables. Since the distributions of these variables might not be normal, both a two-sample t-test and a nonparametric Wilcoxon test are conducted. In general, the audit failure group and the matched control group are not significantly different in total assets, which reflects a successful control for company size. Because of the matching requirements, the audit failure and non-audit failure groups exhibit different characteristics in firm size, as shown in comparison 4. As stated earlier, in cases where there are no companies available in the same industries with the similar firm sizes as audit failure observations, we select matched pairs with the closest total assets. Consistent with the tendency of larger firms to have Big 8/6/5/4 auditors, comparison 4 shows that the average company size of the audit failure group is significantly larger than that of the matched control group. In comparison 5, the Wilcoxon test results show a significant difference in company size, while the two-sample t-test does not indicate a significant difference. The control firms also appear to earn more than the audit failure firms. With the exception of comparison 3, the matched control groups have a higher EPS than the audit failure group. Audit failure group Matched control group Comparison 1 Number of observations 616 616 Big 8/6/5/4 502 502 Non-Big 8/6/5/4 114 114 Comparison 2 Number of observations 502 502 Big 8/6/5/4 502 502 Non-Big 8/6/5/4 0 0 Comparison 3 Number of observations 114 114 Big 8/6/5/4 0 0 Non-Big 8/6/5/4 114 114 Comparison 4 Number of observations 463 463 Big 8/6/5/4 463 0 Non-Big 8/6/5/4 0 463 Table III. Comparison 5 Number of firm/year Number of observations 114 114 observations in each Big 8/6/5/4 0 114 comparison Non-Big 8/6/5/4 114 0
  • 11. Apparent Auditor failure group Matched control group Compare meansa Mean Median SD Mean Median SD t-test Wilcoxon test audit failures Comparison 1 TA 2,421.1010 135.5100 8,309.7470 1,860.2880 114.5100 6,508.7950 0.1875 0.332 P 17.4288 12.2500 17.7024 18.3725 12.0630 22.4992 0.4135 0.9602 EPS 20.0065 0.3450 7.0179 0.7458 0.5000 5.7049 0.0392 0.0022 143 BVPS 7.6564 12.2500 9.7234 8.6550 5.7230 16.2675 0.1913 0.2421 Comparison 2 TA 2,958.4940 224.6000 9,121.2050 2,243.6640 182.2900 7,122.9120 0.1667 0.2256 P 19.4984 14.7500 17.9248 21.2554 15.2500 23.8012 0.1867 0.5052 EPS 0.01631 0.4900 7.7616 0.9306 0.7850 6.2850 0.0405 0.0007 BVPS 8.7918 6.2610 10.2356 9.9054 6.9360 17.6025 0.2208 0.3822 Comparison 3 TA 54.6836 16.7150 138.4634 172.0858 15.0150 1,447.4700 0.3904 0.9080 P 8.3157 4.0000 13.3492 5.6772 3.4380 6.6272 0.0605 0.2113 EPS 20.1072 2 0.0100 0.9703 20.0679 0.0200 1.0853 0.7734 0.8574 BVPS 3.1489 1.1916 4.3721 2.6570 1.7497 5.3825 0.4496 0.0890 Comparison 4 TA 3,008.3940 211.5500 9,391.1080 1,393.2470 64.5000 9,913.3340 0.0111 0.0000 P 19.6246 14.5000 18.3666 15.1947 8.8750 22.0622 0.0009 0.0000 EPS 20.0472 0.4700 8.0709 0.5576 0.3700 1.6394 0.1147 0.9536 BVPS 8.5995 6.1680 10.4589 7.8357 4.9530 13.6130 0.3386 0.0002 Comparison 5 TA 54.6836 16.7150 138.4634 46.9001 23.3100 70.6154 0.5932 0.0426 P 8.3157 4.0000 13.3492 10.3906 6.7500 14.9525 0.2691 0.0038 EPS 20.1072 2 0.0100 0.9703 0.1656 0.0900 1.3441 0.0796 0.0309 BVPS 3.1489 1.1916 4.3721 4.7300 3.3794 5.4881 0.0018 0.0000 Notes: All p-values less than or equal to 0.05 are shown in italics; aboth p-values of the two-sample t-test Table IV. and the nonparametric two-sample Wilcoxon test are given; TA, total asset at the end of the fiscal year t; Descriptive statistics for P, stock price, three month after the end of the fiscal year t; EPS, earnings per share excluding observations included in extraordinary items for fiscal year t; BVPS, book value of equity per share at the end of the fiscal year t hypothesis testing Hypothesis testing using bootstrap confidence intervals For the purpose of the current study, 1,000 bootstrap resamples were created by sampling with replacement from each of the original samples. Each bootstrap resample is the same size as the original sample[10]. For each bootstrap resample, there is one R 2 generated from the bootstrap regression, which is called R 2 *. Therefore, the 1,000 bootstrap resamples generated 1,000 R 2 *s[11]. To test whether R 2 of the audit failure group and the matched control group differ, we compare the 83.4 percent bootstrap percentile confidence intervals of R 2. Figures 2-6 show the histograms about the distribution of R 2 based on bootstrap resamples. The histograms of R 2 *s sometimes indicate approximate normality, but other times show an approximately normal central region with non-normality in the tail region. More importantly, there are three cases where even the central region is obviously non-normal. Of these three, two cases are the distributions of R 2 for the audit failure groups audited by non-Big 8/6/5/4 auditors in comparisons 3 and 5, which exhibit an asymmetric pattern because most R 2 from the bootstrap resamples are very close to zero. The third case appears in comparison 5, where R 2 for the matched control group audited by Big
  • 12. RAF 15 10,2 10 144 Density 5 0 0.10 0.15 0.20 0.25 R2 star 15 10 Density 5 0 0.20 0.25 0.30 0.35 0.40 0.45 0.50 Figure 2. R2 star Notes: R2 *: audit failure group – both Big 8/6/5/4 and non- Histograms for Big 8/6/5/4; R2 *: matched control group – both Big 8/6/5/4 comparison 1 and non-Big 8/6/5/4 8/6/5/4 auditors appear to have a bimodal distribution, a probability distribution characterized by two humps rather than the more common single hump that characterizes the normal distribution. One hump is near 0.15 and the other is near 0.46. Since we run bootstrap regressions by resampling the residuals from the original regression, the bimodal distribution of R 2 appears to be driven by an outlier in the residuals. Examining the regression output, we find one residual with an extreme value. The bimodality exists when a highly influential point is included in some bootstrap resamples but not in others. When we delete this outlier, the bimodal distribution of R 2 disappears. The histogram of R 2 after removing the outlier is shown in Figure 6.
  • 13. 15 Apparent audit failures 10 Density 145 5 0 0.10 0.15 0.20 0.25 0.30 R2 star 15 10 Density 5 0 0.25 0.30 0.35 0.40 0.45 0.50 0.55 R2 star Figure 3. Notes: R2 *: audit failure group – Big 8/6/5/4; R2 *: matched Histograms comparison 2 control failure group – Big 8/6/5/4 As stated earlier, one advantage of bootstrap methods is that they do not require distributions to be normal. Hence, the above descriptions of a non-normal pattern are not troublesome. To create 83.4 percent bootstrap percentile confidence intervals, the 1,000 R 2 *s from bootstrap regressions were sorted in an ascending order. The lower value of the confidence interval is the 83rd (0.083*1,000) R 2 * and the upper value is the 917th (0.917*1,000) R 2 *. The results of the bootstrap percentile confidence intervals are shown in Table V. Comparisons of bootstrap percentile confidence intervals indicate that there are significant differences in R 2 for the audit failure groups and the matched control groups[12]. Hypothesis testing using the Cramer procedure To be consistent with prior literature (Harris et al., 1994; Lang et al., 2003; Sami and Zhou, 2004), we perform the test using the Cramer procedure. Cramer (1987) provides a procedure
  • 14. RAF 30 10,2 25 20 146 Density 15 10 5 0 0.0 0.1 0.2 0.3 0.4 R2 star 15 10 Density 5 0 0.1 0.2 0.3 0.4 0.5 0.6 Figure 4. R2 star Notes: R2 *: audit failure group – non-Big 8/6/5/4; R2 *: matched Histograms comparison 3 control group – non-Big 8/6/5/4 to calculate the first moment and second moment of R 2. Once we have the mean and variance of R 2, we can calculate the z-statistic as in Harris et al. (1994) and Lang et al. (2003) and compare means of R 2 across two samples. The expression of a z-test can be modified as follows since the number of observations of R 2 is only one for each sample: E R2 2 E R 2 1 2 z ¼ rffiffiffiffiffiffiffiffiffiffiffiffiffiffiffiffiffiffiffiffiffiffiffiffiffiffiffiffiffiffiffiffiffiffiffi V R 2 þ V R2 1 2
  • 15. 15 Apparent audit failures 10 147 Density 5 0 0.10 0.15 0.20 0.25 0.30 R2 star 15 10 Density 5 0 0.2 0.3 0.4 0.5 0.6 R2 star Figure 5. Notes: R2 *: audit failure group – Big 8/6/5/4; R2 *: matched Histograms comparison 4 control group – non-Big 8/6/5/4 The results using the Cramer procedure and z-test are presented in Table VI. These results are similar to those reported by employing the bootstrap method. Therefore, our results are robust[13]. As discussed in McCullough and Vinod (1993), caution should be given when using the Cramer procedure to calculate the mean and standard deviation of the R 2. For instance, we encountered computer operation overflows, resulting in incorrect outputs, before we modified our programming to resolve such problems.
  • 16. RAF 30 15 10,2 25 20 10 Density Density 15 148 10 5 5 0 0 0.0 0.1 0.2 0.3 0.4 0.0 0.1 0.2 0.3 0.4 0.5 0.6 R2 star R2 star 15 10 Density 5 0 0.1 0.2 0.3 0.4 0.5 0.6 Figure 6. R2 star Notes: R2 *: audit failure group – non-Big 8/6/5/4; R2 *: matched control group – Big 8/6/5/4; R2 *: Histograms comparison 5 matched control group – Big 8/6/5/4; after removing the outlier Sensitivity analysis To ensure that our analyses are not affected by potentially confounding factors such as negative earnings or financial distress, we perform several additional analyses. First, as shown in the descriptive statistics, the audit failure group on average exhibits a lower EPS compared with the matched control group. The frequency of losses in the audit failure group is higher compared with the matched control group. Prior literature (Collins et al., 1999; Burgstahler and Dichev, 1997; Hayn, 1995) has suggested that losses are less informative for prices than profits. Therefore, the relation between stock price and earnings and book values of firms in financial distress may be fundamentally different from non-distressed firms. To ensure that our results are not driven by the relatively higher frequency of losses or a greater degree of financial distress among the firms in the audit failure group, we carry out two additional analyses. First, we performed a second matching of non-audit failure firms to the audit failure group, adding two additional matching criteria, return on assets (ROA) and leverage, to control for the influence of financial distress. We also analyze the data after removing all these observations with negative EPS and their pairs in the matched control group.
  • 17. Apparent Comparison Failure group Non-failure group audit failures 1 Auditor Both Big and non-Big 8/6/ Both Big and non-Big 8/6/ 5/4 5/4 83 percent bootstrap percentile (0.1344, 0.2234) (0.3555, 0.4825) CI 2 Auditor Big 8/6/5/4 Big 8/6/5/4 149 83 percent bootstrap percentile (0.1175, 0.2072) (0.3520, 0.4877) CI 3 Auditor Non-Big 8/6/5/4 Non-Big 8/6/5/4 83 percent bootstrap percentile (0.0068, 0.1161) (0.2640, 0.5030) CI 4 Auditor Big 8/6/5/4 Non-Big 8/6/5/4 83 percent bootstrap percentile (0.1229, 0.2207) (0.3965, 0.6054) CI 5 Auditor Non-Big 8/6/5/4 Big 8/6/5/4 83 percent bootstrap percentile (0.0068, 0.1161) (0.2045, 0.3894) CI Table V. Comparisons of bootstrap Notes: All p-values less than or equal to 0.05 are shown in italics; regression model: P it ¼ a1 EPS it percentile confidence þa2 BVPS it intervals for R 2 Also, in our original analyses, we include material misstatements that received both “unqualified opinion” and “unqualified opinion with explanatory language” as audit failure cases. Some of the “explanatory language” cases refer to an auditor’s substantial doubts about a firm’s ability to continue as a going concern. Although the “going concern” opinions are included in the audit failure group, insofar as the auditor’s opinion on the fairness of the firm’s financial statements is not qualified, it is possible that firms that receive going concern opinions are fundamentally different from the rest of the firms in the sample. While we already control for financial distress factor by adding ROA and financial leverage as two additional matching criteria, we perform additional analyses after removing all firms with going concern opinions and their matched pairs in the control group, in order to exclude the possibility that our results are driven by some other confounding factor associated with the going concern opinion. Additionally, we find that a few audit failure firms changed their auditors during the period their financial statements were misstated. It is possible that these firms might be different from other firms because they might be priced differently due to the change in auditors. Previous research (Teoh, 1992) has documented that auditor changes might affect stock prices and therefore the association between stock prices and accounting information. Schwartz and Menon (1985) examine the motivations for auditor switching and consider financial distress as a factor that affects auditor switching. Also, there are other factors, such as audit opinion qualification (Chow and Rice, 1982) that might trigger auditor switching. Therefore, in addition to controlling for financial distress, we also analyze the data without those firms that changed auditors during their misstatement years. The results of all these additional analyses are consistent with our original analyses, which support our hypothesis[14].
  • 18. RAF Comparison Failure group Non-failure group 10,2 1 Auditor Both Big and non-Big 8/6/5/4 Both Big and non-Big 8/6/5/4 n 616 616 R2 0.1714 0.4179 Mean (R 2) 0.1735 0.4190 150 SD (R 2) 0.0264 0.0270 z-statistic 6.4977 2a Auditor Big 8/6/5/4 Big 8/6/5/4 n 502 502 R2 0.1555 0.4129 Mean (R 2) 0.1582 0.4142 SD (R 2) 0.0286 0.0210 z-statistic 6.1826 3b Auditor Non-Big 8/6/5/4 Non-Big 8/6/5/4 n 114 114 R2 0.0266 0.3555 Mean (R 2) 0.0353 0.3624 SD (R 2) 0.0369 0.0651 z-statistic 4.3668 4a Auditor Big 8/6/5/4 Non-Big 8/6/5/4 n 463 463 R2 0.1628 0.4827 Mean (R 2) 0.1656 0.4839 SD (R 2) 0.0301 0.0291 z-statistic 7.6015 5b Auditor Non-Big 8/6/5/4 Big 8/6/5/4 n 113c 113c R2 0.0284 0.2862 Mean (R 2) 0.0381 0.2946 SD (R 2) 0.0369 0.0663 z-statistic 3.3805 Notes: All p-values less than or equal to 0.05 shown in italics; regression model: P it ¼ a1 EPS it þ a2 BVPS it ; ain comparisons 2 and 4, audit failure group is the same group except the number of observations differs; failure group in both comparisons represents firms audited by Big auditors; in comparison 4, we dropped some failure group firms since we cannot find the matched pairs audited by non-Big auditors; bin comparisons 3 and 5, audit failure group is the same group since it Table VI. represents audit failure firms audited by non-Big auditors; cthe number of observations is due to Comparison of R 2 deleting an outlier existing in the matched control group and its pair in the audit failure group; similar using a z-test based to the bootstrap testing results, z-statistic is not significant before deleting the outlier because the large on the Cramer procedure magnitude of the variance of the R 2 for the matched control group, 0.1939 VI. Limitations and conclusions Limitations This study has limitations due to the ex ante research approach adopted. Because of this ex ante approach, our matching criteria have to rely on the “noisy” accounting measure, total assets, in the alleged years. Therefore, the matching might not be effective in controlling for size. Although our primary objective is to explore the market phenomenon around the time of material misstatements, exploring why the market discounted accounting information reported by audit failure firms even the news of these misstatements is also
  • 19. an important question. Future research could address this issue by possibly incorporating Apparent an “intervening” factor into the model to indicate how the market can differentiate audit audit failures failure firms from other firms. Finally, our analysis is based on the pre-Sarbanes-Oxley Act (SOX) period and therefore caution must be exercised when generalizing the findings of this study to the post-SOX period. Conclusions 151 In this study, we examine whether there is a difference in value relevance of accounting information between firms experiencing apparent audit failures and firms that have not experienced apparent audit failures. The bootstrap method is used to test for differences in R 2 across samples. The results suggest that the value relevance of earnings and book values of equity is lower for firms experiencing apparent audit failures than those for firms that have not experienced apparent audit failures. Although the market may exhibit a lower level of confidence in accounting information from firms audited by non-Big 8/6/5/4 auditors, the results provide evidence that the market generally exhibits lower confidence in firms experiencing audit failure, regardless of their auditors’ size. These empirical results show that the explanatory power of accounting information of firms experiencing apparent auditor failures is lower than that of firms that have not experienced apparent auditor failures. In our view, the market appears to rely less on accounting information reported by firms experiencing apparent audit failures regardless of auditor size, even though an apparent audit failure may not be confirmed by future actions and events until well after its occurrence. Moreover, in comparison 4, accounting information provided by firms experiencing audit failures and audited by Big 8/6/5/4 auditors is less value relevant compared with firms audited by non-Big 8/6/5/4 auditors that have not experienced audit failures. This result suggests the difference in value relevance between the audit failure group and the matched groups is not conditioned on auditor size. Thus, as illustrated in comparisons 1 through 5, the results indicate that there is a difference in value relevance between the audit failure and the matched group ex ante. In addition to providing evidence suggesting that auditor size does not impact the value relevance of accounting information in a dysfunctional manner, this study demonstrates an innovative application of bootstrapping to test for differences in R 2 in the context of value-relevance research. We believe this method may allow researchers to make more precise conclusions when conducting future value-relevance studies. Notes 1. According to SEC requirements, before September 2002, Form 10-K had to be filed within 90 days after the end of the company’s fiscal year. 2. Several AAERs do not identify firm names. Further, some firms received multiple AAER sanctions. There are also some cases where the alleged impropriety involves a governmental entity. 3. Having ticker identification numbers does not necessarily mean that these firms have all required data for specific years in question available in COMPUSTAT. 4. Palmrose’s (1999) database provides tickers for those companies that have ticker identification numbers in COMPUSTAT. We exclude those cases of apparent audit failure which do not have tickers in the Palmrose (1999) database.
  • 20. RAF 5. COMPUSTAT data item no. 149 provides both auditor and audit opinion information. However, it does not provide reasons why the qualified audit opinions were issued. We 10,2 include auditor opinions with a value 1 (unqualified opinion) and 4 (unqualified opinion with explanatory language). 6. The matched-pairs control group also excludes firms with qualified audit opinions. 7. By selecting matched pairs according to such criteria, we control for confounding factors 152 such as size, industry, and time period. Since total assets reported by audit failure firms in the alleged years could be noisy, control for size might not be very effective. However, we do not expect that any discrepancy in matching would cause significant problems given that “size” is matched within a ^10 percent range. 8. For example, if the sample size for two samples are both 300, the multiplier for the confidence interval is: pffiffiffiffiffiffiffiffiffiffiffiffiffiffiffi pffiffiffi pffiffiffiffiffiffiffi pffiffiffi 0 2 £ 300 2 · 300 2 z ¼ pffiffiffiffiffiffiffi · z0:975 ¼ pffiffiffiffiffiffiffi · z0:975 ¼ · z0:975 ¼ 0:834: 2 300 2 300 2 9. Note that in comparison 4 in Table II, 39 of the 502 audit failure cases are dropped due to inability to match these firm/years with those of a non-Big 8/6/5/4 control group. 10. For example, for the original sample size of 616 firm/years, the bootstrap resamples also will contain 616 observations, but will not be identical to the set of observations in the original sample. 11. See McCullough and Vinod (1993) for details on implementing the bootstrap procedure. 12. In comparison 5, the result is not significant before the outlier is removed. The confidence interval (0.0822, 0.5369) is wide when the outlier is included in the sample because of the bimodal distribution of R 2. 13. If the results are different using these two methods, the bootstrap method should be more reliable since the z-test requires normality of the R 2 and the distribution of R 2 is not exactly normal. 14. As a result of the more strict matching criteria, the sample size decreased in the second match. We deleted 195, 128, and 61 firm/years with negative EPS, with explanatory language and multiple auditors during the misstatement years, respectively. Results from these additional analyses are not tabulated. References Akhigbe, A., Kudla, R.J. and Madura, J. (2005), “Why are some corporate earnings restatements more damaging?”, Applied Financial Economics, Vol. 15 No. 5, pp. 327-36. Amir, E. (1996), “The effect of accounting aggregation on the value-relevance of financial disclosures: the case of SFAS No. 106”, The Accounting Review, Vol. 71 No. 4, pp. 573-90. Amir, E. and Lev, B. (1996), “Value-relevance of nonfinancial information: the wireless communications industry”, Journal of Accounting and Economics, Vol. 22, pp. 3-30. Anderson, T.W. (2003), An Introduction to Multivariate Analysis, Wiley, New York, NY, pp. 149-57. Barr, D.R. (1969), “Using confidence intervals to test hypotheses”, Journal of Quality Technology, Vol. 1, pp. 256-8. Bhagat, S., Brickley, J.A. and Coles, J.L. (1994), “The costs of inefficient bargaining and financial distress”, Journal of Financial Economics, Vol. 35 No. 2, pp. 221-47.
  • 21. Burgstahler, D.C. and Dichev, I.D. (1997), “Earnings, adaptation and equity value”, Apparent The Accounting Review, Vol. 72 No. 2, pp. 187-215. audit failures Chaney, P.K. and Philipich, K.L. (2002), “Shredded reputation: the cost of audit failure”, Journal of Accounting Research, Vol. 40 No. 4, pp. 1221-45. Chow, C.W. and Rice, S.J. (1982), “Qualified auditor opinions and auditor switching”, The Accounting Review, Vol. 57 No. 2, pp. 326-35. Collins, D.W., Maydew, E.L. and Weiss, I.S. (1997), “Changes in the value-relevance of earnings 153 and book values over the past forty years”, Journal of Accounting and Economics, Vol. 24, pp. 39-67. Collins, D.W., Pincus, M. and Xie, H. (1999), “Equity valuation and negative earnings”, The Accounting Review, Vol. 74 No. 1, pp. 29-61. Cramer, J.S. (1987), “Mean and variance of R 2 in small and moderate samples”, Journal of Econometrics, Vol. 35, pp. 253-66. DeAngelo, L.E. (1981), “Auditor size and audit quality”, Journal of Accounting and Economics, Vol. 3, pp. 183-99. Dechow, P.M., Sloan, R.G. and Sweeney, A.P. (1996), “Causes and consequences of earnings manipulation: an analysis of firms subject to enforcement actions by the SEC”, Contemporary Accounting Research, Vol. 13 No. 1, pp. 1-36. Feroz, E.H., Park, K. and Pastena, V.S. (1991), “The financial and market effects of the SEC’s accounting and auditing enforcement releases”, Journal of Accounting Research, Vol. 29 No. 3, pp. 107-42. Francis, J. and Schipper, K. (1999), “Have financial statements lost their relevance?”, Journal of Accounting Research, Vol. 37, pp. 319-52. Francis, J., Philbrick, D. and Schipper, K. (1994), “Shareholder litigation and corporate disclosures”, Journal of Accounting Research, Vol. 32 No. 2, pp. 137-64. Griffin, P.A., Grundfest, J.A. and Perino, M.A. (2004), “Stock price response to news of securities fraud litigation: an analysis of sequential and conditional information”, ABACUS, Vol. 40 No. 1, pp. 21-48. Harris, T.S., Lang, M. and Moller, H.P. (1994), “The value relevance of German accounting measures: an empirical analysis”, Journal of Accounting Research, Vol. 32, pp. 187-209. Hayn, C. (1995), “The information content of losses”, Journal of Accounting and Economics, Vol. 20, pp. 125-53. Kellogg, R.L. (1984), “Accounting activities, security prices, and action lawsuits”, Journal of Accounting and Economics, Vol. 6 No. 3, pp. 185-204. Lam, S. and Chang, S. (1994), “Auditor service quality and auditor size: evidence from initial public offerings in Singapore”, Journal of International Accounting Auditing and Taxation, Vol. 3 No. 1, pp. 103-14. Lang, M., Raedy, J.S. and Yetman, M.H. (2003), “How representative are firms that are cross-listed in the United States? An analysis of accounting quality”, Journal of Accounting Research, Vol. 41, pp. 363-86. Liu, L., Raghunandan, K. and Rama, D. (2009), “Financial restatements and shareholder ratifications of the auditor”, Auditing: A Journal of Practice Theory, Vol. 28 No. 1, pp. 225-40. McCullough, B.D. and Vinod, H.D. (1993), “Implementing the single bootstrap: some computational considerations”, Computational Economics, Vol. 6 No. 1, pp. 1-15.
  • 22. RAF Nwaeze, E.T. (1998), “Regulation and the valuation relevance of book value and earnings: evidence from the United States”, Contemporary Accounting Research, Vol. 15 No. 4, 10,2 pp. 547-73. Ohlson, J.A. (1995), “Earnings, book values, and dividends in equity valuation”, Contemporary Accounting Research, Vol. 11 No. 2, pp. 661-87. Palmrose, Z. (1999), Empirical Research in Auditor Litigation: Considerations and Data, 154 American Accounting Association, Sarasota, FL. Rajgopal, S., Venkatachalam, M. and Kotha, S. (2002), “The value-relevance of network advantages: the case of e-commerce firms”, Journal of Accounting Research, Vol. 41, pp. 135-62. Rees, W.P. (1999), “Influences on the value-relevance of equity and net income in the UK”, Managerial Finance, Vol. 25 No. 2, pp. 58-65. Sami, H. and Zhou, H. (2004), “A comparison of value relevance of accounting information in different segments of the Chinese stock market”, International Journal of Accounting, Vol. 39 No. 4, pp. 403-27. Schwartz, K.B. and Menon, K. (1985), “Auditor switches by failing firms”, The Accounting Review, Vol. 60 No. 2, pp. 248-61. Stober, T.L. (1999), “Empirical applications of the Ohlson (1995) and Feltham and Ohlson (1995, 1996) valuation models”, Managerial Finance, Vol. 25 No. 12, pp. 3-16. Teoh, S.H. (1992), “Auditor independence, dismissal threats, and the market reaction to auditor switches”, Journal of Accounting Research, Vol. 30, pp. 1-25. Teoh, S.H. and Wong, T.J. (1993), “Perceived auditor quality and the earnings response coefficient”, The Accounting Review, Vol. 68 No. 2, pp. 346-66. Further reading Dechow, P.M. (1994), “Accounting earnings and cash flows as measures of firm performance: the role of accounting accruals”, Journal of Accounting and Economics, Vol. 18, pp. 3-42. About the authors Li Dang is an Associated Professor at California Polytechnic State University-San Luis Obispo. Her research interests and publications focus on audit quality, international accounting, and accounting information systems. She teaches financial accounting and accounting information systems courses. Li Dang is the corresponding author and can be contacted at: ldang@calpoly.edu Kevin F. Brown is an Associate Professor in the Department of Accountancy of the Raj Soin College of Business at Wright State University in Dayton, Ohio. He has published his research in several scholarly and professional journals, including Issues in Accounting Education, Journal of Accounting Education, and The CPA Journal. He has presented his research at numerous national conferences, including Annual Meetings of the American Accounting Association. His primary area of research is in auditing and his teaching areas include auditing and financial accounting. B.D. McCullough is a Professor of Decision Sciences at Drexel University. Before he joined the faculty at Drexel University, he was an Assistant Professor of Economics at Fordham University from 1989 to 1994 and a Senior Economist at the Federal Communications Commission from 1995 to 2000. He is the Associate Editor for five journals and has authored or co-authored more than 50 scholarly publications. To purchase reprints of this article please e-mail: reprints@emeraldinsight.com Or visit our web site for further details: www.emeraldinsight.com/reprints