Internet of Things- How Revenue is Driven
•
1 gostou•325 visualizações

The Internet of Things, that is built on cloud computing and networks of data-gathering sensors, revolves around increased machine-to-machine communication. The beauty of IOT is that it is instantaneous connection. It promises to make everything in our lives that we know, “smart”, and is the latest “big” news in the world of computing. The technology promises wonders and everyone is keen to jump in on the bandwagon. The corporation think tanks have their tasks cut out on how revenue could be driven from this breakthrough technology.
Recomendados

Recomendados
Mais conteúdo relacionado
Mais de Suyati Technologies
Mais de Suyati Technologies (20)
Último
Último (20)
Internet of Things- How Revenue is Driven
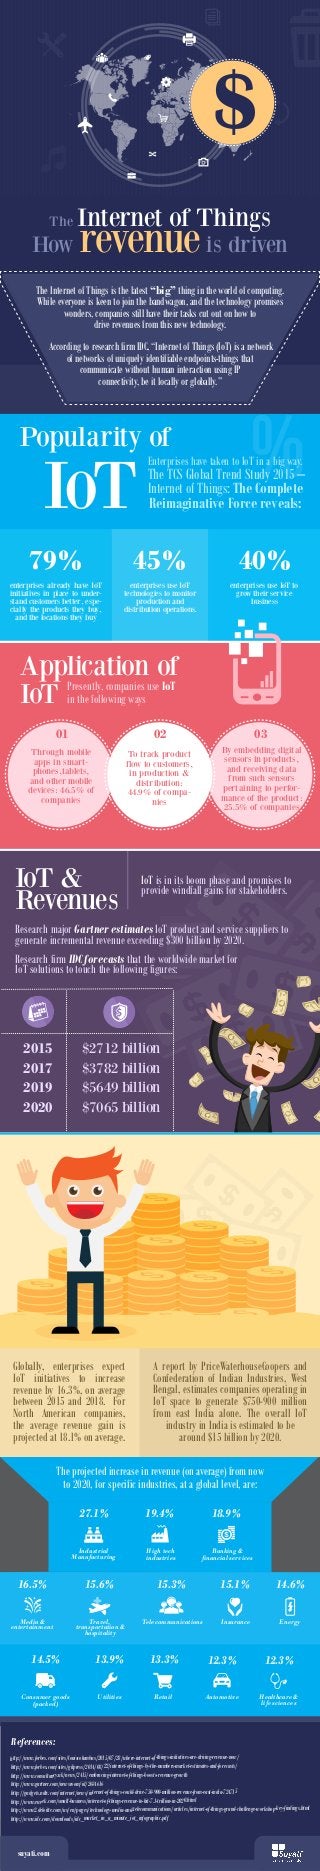
- 1. suyati.com References: http://www.forbes.com/sites/louiscolumbus/2015/07/28/where-internet-of-things-initiatives-are-driving-revenue-now/ http://www.forbes.com/sites/gilpress/2014/08/22/internet-of-things-by-the-numbers-market-estimates-and-forecasts/ http://www.consultancy.uk/news/2415/embracing-internet-of-things-boosts-revenue-growth http://www.gartner.com/newsroom/id/2684616 http://gadgets.ndtv.com/internet/news/internet-of-things-could-drive-750-900-million-revenue-from-east-india-724715 http://www.eweek.com/small-business/internet-of-things-revenue-to-hit-7.1-trillion-in-2020.html http://www2.deloitte.com/us/en/pages/technology-media-and-telecommunications/articles/internet-of-things-grand-challenge-workshop-key-findings.html http://www.idc.com/downloads/idc_market_in_a_minute_iot_infographic.pdf %Popularity of Application of IoT IoT & Revenues 2015 $2712 billion 2017 $3782 billion 2019 $5649 billion 2020 $7065 billion IoT 79% 40%45% The Internet of Things is the latest “big” thing in the world of computing. While everyone is keen to join the bandwagon, and the technology promises wonders, companies still have their tasks cut out on how to drive revenues from this new technology. According to research firm IDC, “Internet of Things (IoT) is a network of networks of uniquely identifiable endpoints-things that communicate without human interaction using IP connectivity, be it locally or globally.” Enterprises have taken to IoT in a big way. The TCS Global Trend Study 2015 – Internet of Things: The Complete Reimaginative Force reveals: Presently, companies use IoT in the following ways IoT is in its boom phase and promises to provide windfall gains for stakeholders. Research major Gartner estimates IoT product and service suppliers to generate incremental revenue exceeding $300 billion by 2020. Globally, enterprises expect IoT initiatives to increase revenue by 16.3%, on average between 2015 and 2018. For North American companies, the average revenue gain is projected at 18.1% on average. A report by PriceWaterhouseCoopers and Confederation of Indian Industries, West Bengal, estimates companies operating in IoT space to generate $750-900 million from east India alone. The overall IoT industry in India is estimated to be around $15 billion by 2020. The projected increase in revenue (on average) from now to 2020, for specific industries, at a global level, are: Research firm IDC forecasts that the worldwide market for IoT solutions to touch the following figures: enterprises already have IoT initiatives in place to under- stand customers better, espe- cially the products they buy, and the locations they buy enterprises use IoT technologies to monitor production and distribution operations. enterprises use IoT to grow their service business The Internet of Things How revenueis driven Through mobile apps in smart- phones,tablets, and other mobile devices: 46.5% of companies To track product flow to customers, in production & distribution: 44.9% of compa- nies By embedding digital sensors in products, and receiving data from such sensors pertaining to perfor- mance of the product: 25.5% of companies 01 02 03 $$$$$$$$$$$$$$$$$$ $$$$$$$$$$$$$$$ $$$$$$$$$$$$$ $$$$$$$$$$$$$ $$$$$$$$$$$$$$$ $$$$$$$$$$$ $$$$$$$ $$$$$$$$$ $$$$$$$$ $$$$$$$$ $$$$$$$$ $$$ $$$$ $$$ $$$$$ Industrial Manufacturing 27.1% 19.4% High tech industries 18.9% Banking & financial services Media & entertainment 16.5% 15.6% Travel, transportation & hospitality 15.3% Telecommunications 15.1% Insurance 14.6% Energy Consumer goods (packed) 14.5% 13.9% Utilities 13.3% Retail Automotive 12.3% 12.3% Healthcare & life sciences $