

Recomendados
Mais conteúdo relacionado
Mais procurados
Mais procurados (20)
Destaque
Destaque (12)
Semelhante a Six Sigma Approach To Increase The Hit Rate Of Intranet
Semelhante a Six Sigma Approach To Increase The Hit Rate Of Intranet (20)
Mais de Soumya De
Mais de Soumya De (20)
Six Sigma Approach To Increase The Hit Rate Of Intranet
- 1. Title: Six Sigma Approach To Increase The Hit Rate Of Intranet. Submitted To: Indian Statistical Institute, Delhi Centre For award of Six Sigma Green Belt Certificate Prepared By: Name: Soumya De Organization: Everest Industries Ltd. Department: HR Address: Genesis A-32 Mohan Co-operative Industrial Estate, Mathura Road, New Delhi-110044 ( India ), Tel – 011-41731951 E-Mail: info@everestind.com ; Website: www.everestind.com E-Mail: desomya@gmail.com ; soumya.de.1981@gmail.com
- 2. Acknowledgement I hereby regard our sincere thanks to Mr.B.R.Mohan , VP HR, Everest Industries Ltd under whose guidance this project was undertaken. I sincerely acknowledge the employees for their valuable assistance throughout the working of the project. I would like to thank our friends for their generous support and the respondents who gave their valuable piece of time for participating in the survey to complete the study.
- 3. Executive Summary Six Sigma is a powerful tool to detect errors within a process regardless whether it is a manufacturing process or service process. We have applied the six Sigma Methodology with its road map DMAIC (Define – Measure – Analyze – Improve – Control) on the process of increasing the Hit Rate on our Intranet System. This project is done so that maximum of our employees of Everest Industries Ltd. login to Intranet. During the design step we drew our project scope, specified our goal concerning the improvements we want to make and made assumptions concerning the process. A CTQ tree and a rough process diagram were drawn to illustrate the process understanding. Constraints were set limit the range of task and Variables (decision and dependency) were defined to give additional insight into the whole field of project. The measurement step contains the study of the process and get the count of login of unique users at the end of the day. In this process we have also kept in mind the new joinees who join the organization in between and also those who leave the organization. Furthermore a Questionnaire was made so as to get the feedback and suggestions that were reasons for not logging in to the Intranet System. In addition to that suggestions were collected to find out the factors that need to be rectified or taken care in order to achieve a higher customer satisfaction and hit rate. The analyse step deals with a cause and effect diagram to find many factors that might have an influence on the output – to have more hits or login on the Intranet System. In the improvement stage we have improved the process by increasing the members by assigning responsibilities to a team of qualified members in Intranet Team at different levels of process. We have shown the assignment of team members in the process diagram so the responsibility that was handled by only one Intranet Administrator will be shared by a set of team members.
- 4. 1.Overview : Project Selection 1.1 Background Information Everest Industries Limited provides us with the world-class building solutions to meet our construction requirements, in the Industrial, Commercial and Residential sectors. Historically, Everest has provided rural shelters by making corrugated roofing sheets available to farmers at a competitive price. The company is poised to capitalize on the opportunities in rural India where various housing and infrastructure initiatives are envisaged by the Government. Today, Everest offers a complete range of building solutions which includes Ceilings, Walls, Flooring, Cladding, Doors, Roofing and Pre-Engineered Steel Buildings. These are produced at Everest's state-of-the-art ISO: 14000 certified manufacturing facilities at Kymore, Nashik, Coimbatore, Kolkata and Roorkee. With over 4000 retail points spread across the nation together with the strength of over 1285 highly qualified and experienced engineers, designers and technicians, Everest provides you building solutions that successfully meet the highest standards of quality and durability. Trained manpower is our dedicated strength at Everest. Apart from continuous development of employee skills, the company is also committed to their welfare. After successfully catering to the Indian market, Everest Industries Limited has widened its horizons in the international arena. With consistent exports to Europe, Africa, Australia and Asia, Everest is all set to scale new heights and establish a strong foundation in the global market. Banking on its 75 years of experience and highly sophisticated technology, Everest assures you that all its products live up to its promise of Strength, Speed and Safety. This is an Organization that has been started in the year 1934.This is a 76 Year old organization. Intranet has been deployed here for the very first time. So it is a very new concept. In this research project, DMAIC (Define – Measure – Analyze – Improve – Control),the implementation steps of Six Sigma Projects are followed to analyze and improve the process quality and hit rate of Intranet System. Quality especially service quality is a crucial factor in the fast growing modern India. Six Sigma is a collection of Quality Management Methods and it is very popular nowadays. Six Sigma can improve the service process. The term Six Sigma is based on a statistical measure that equals to 3.4 or fewer errors of defects per million opportunities (DPMO). Six Sigma can be taken as a business improvement approach that seeks to find and eliminate causes of defects and errors in manufacturing and service process by focusing on output that are critical to customers.
- 5. Six Sigma provides a blue print for implementation of total quality system. Its road map – DMAIC (Define – Measure – Analyze – Improve – Control) means: Define the problem of the process; Measure the performance of the process; Analyze the cause for the problem of the process; Improve the process; Control the process and eliminate the occurrence of the same problem. 1.2 Problems and Its Symptoms A significant phenomenon in our Intranet system is that people login more on beginning and mid week then it drops gradually. Few users have not provided data and few have not logged in spite of creating their ID and Passwords..There is a category of users who do not remember their ID and Password. Total Strength of Employees who would be accessing Intranet is 642. The number of person who has given the data for account creation is 578 this is almost 90% of total population. Maximum number of login in to Intranet System is 578. Highest Percentage of logging as per total 642 is 90%. Maximum Number of Re-Login is 312. Now the data that is according to actual and complete data that is present in to the system database:- A) Average Number of users hits on Intranet as per 578 as total is 347 i.e. 60%. B) Average Number of users who forget the password of Intranet as per 578 as total is 25 i.e. 4%. C) Number of users who have not logged in yet on Intranet as per 578 as total is 206 i.e. 36%. A + B + C = 60 + 4 + 36 = 100 % Highest Percentage of Re-Login as per total 578 is 54%.
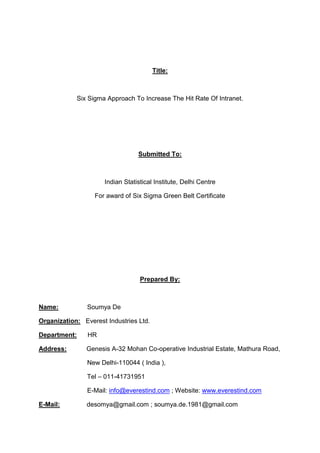
- 6. Now the data that is according to actual number of total employees in organization i.e. 642 :- A) Average Number of users hits on Intranet as per 642 as total is 347 i.e. 54%. B) Average Number of users who forget the password of Intranet as per 642 as total is 25 i.e. 4%. C) Number of users who have not logged in yet on Intranet as per 642 as total is 206 i.e. 32%. D) Total Number of users who have not provided the data yet as per 642 as total is 64 i.e. 10%. A + B + C + D = 54 + 4 + 32 + 10 = 100 % The above has been showed in the following Figure1 Highest Percentage of Re-Login as per total 642 is 49%. 54% 4% 32% 10% Maximum Hit On System User Forget Password Marketing People Who Have Not Logged In Yet No Data Of User Figure1: Composition of different factors effecting Hit Rate of Intranet.
- 7. Define 1.3 Goals and Expected Results The Six Sigma team aims to increase the Hit Rate by creating a process flow in such a way so that people logging in to system is increasing. Also by making the process simple and fast by keeping a team of people for Intranet. All marketing people do not login since they do not have anything interesting on intranet. The Intranet should be made comfortable using so that users logs in. Also Intranet password policies need to be relaxed so that user do not find it difficult using password. Also a system needs to be developed so that user can recover password if they forget the password. New users should get enrolled in to the Intranet System as soon as they join the organization. The system needs to be made useful for people so that this becomes a channel of information for users. Stakeholder Strategic Focal Point KPI Internal CTQ Daily Update Cannot be Measured Users Intranet Servers Satisfaction Easy usage of Intranet Efficiency Comfort Refreshed Information and New look New Updates CTQ Flowdown for Intranet Process Weekly Update CTQ + Good and Informative Daily Update CTQ - Good and Informative Weekly Update CTQ - The Figure2 show the CTQ flow down for Intranet Hit Rate.
- 8. 1.4 Framework Our scope focuses on the user who logs in to the system and finds it easy and comfortable using the same. Also passwords need to be made easy and recover if by chance the user forgets the password. The most important are the input credentials that the system gets from the user only. Also to cover all employees of our organization since final aim is to maximise & increase the Hit Rate or Login Rate of Intranet.
- 9. Intranet System User Administrator End User Get Raw Data Process Raw Data As Per Database Requirement Login TO The System Of Intranet Is Data Correct? Create User Account Is Account Working? Give URL, ID, Password To User. Are All User’s Covered In Database? Update Intranet Data & Check Hit Rate; Keep The Content Fresh And Updated. Login & Change Password Is Password Easy? Use Intranet Want To Contribute Articles? Is This System Useful? Give Good Suggestions Make It A Part Of Day To Day Office Work. Are You A New Joinee? A A NO YES NO NO NO YES YES YES YES NO NO YES Everest Industries Ltd. Intranet System & Project Scope
- 10. 1.5 Assumptions 54% user login to the system even if there is nothing new in to the system every day. The queue follows a ( FCFS ) First-Come-First-Serve criterion. This is true as and when user provides data the account is created .Also it is kept as record if any new employee have joined the organization so as to create his her record. The category of users who do not login due to forgetting of password is very less. This will impact the login rate with a very small ratio. 1.6 Constraints There are some fix parameters in the intranet system which is difficult or impossible for the Six Sigma Team to change and is considered as constraints: The total number of Administrators & Moderators to handle all the process like login account creation, content writing, and handling technical issues. The user gives raw data and are not verified & can have lots of defects. The structure ,home page and the modules are defined and designed by Top Management .So it can not be changed by Six Sigma Team. 1.7 Variables The variables are divided in to two categories: Decision Variables ,which can be decided by Six Sigma Team.and Depending Variables or Outputs ,which are directly or indirectly determines by the decision variables. 1.7.1 Decision Variables The decision variables are : The process itself , number of active employees, number of new joinees the current latest update & the number of resignees to keep the database updated, how frequently the content gets updated on Intranet, How easy it is to set a password recovery process for those who have forgotten passwords. 1.7.2 Dependency Variables How seriously the employees give in details for data base entry. How user set passwords so that they do not forget the password. How satisfied the users are so that they come back and relogin to the Intranet System.
- 11. 2. Measurement Number of total Unique visit and the number of visits by an individual employee each day. We did a study to find out that how any users actually logged in and logged out once only and how many users logged in more than once how many times the same day. The higher number of logging back shows that those users are satisfied with the process. The single time logging, the higher the number it increases the hit rate each day. We did this study to provide an authentic working condition and process level without manipulating concerning motivation or anything else which might have affected the outcome. Even in this case we have kept the week days and weekly offs in mind.It has also included the other offs that would be taken due to other reasons.
- 12. Hits 9942 9428 9380 9362 9186 3102 1248 Percent 19.2 18.3 18.2 18.1 17.8 6.0 2.4 Cum % 19.2 37.5 55.7 73.8 91.6 97.6 100.0 Day SundaySaturdayThursdayFridayMondayWednesdayTuesday 50000 40000 30000 20000 10000 0 100 80 60 40 20 0 Hits Percent 1248 3102 91869362938094289942 Distribution Of Hit Rate As Per The Week days New users entering the system & time taken to get data , create Login ID & Password ,check its functionality & provide the same to user ( This is done to show lack of staffing in the process ). Here we have tried to study that when a set of new joinees eneter a system then why it takes time to create the Login ID & Password.One of the major reason is that the data provide by user is not accurate and also few data is dependent on other departments like payrool and HR for Empcode and Date Of Joining. This process has lot of dependencies on other locations of officers so there is lack of standardization. Much time is taken while collecting data from different location. There is only one Administrator handling all five zones and works. The same Administrator is creating ID & Password and also checking them. Finally Administrator is providing this to all individual users. Across all zones and works. On an average 10-12 new joinees join our organization in a single month across zones. So the input from users take almost 10 to 15 days to come to administrator. Also the payrool department generates the Emp code after the salary process for the month is over. This also delays the complete process of account creation. There is always a single administrator so its not necessary that administrator is all the time free for data entry. So in this case we need 5 administrators for five different locations.
- 13. After this data is verified and respective users Login ID & Passwords are created.In this stage we need 2-3 moderators who will verify the data before it is passed on for account creation and also will check the account after it is created. After checking the moderators will pass the same information to the users. This complete work is done by a single administrator. However this process requires at least 8-10 team members to divide and share the complete responsibility and run the system successfully.
- 14. The following Figure3 will give a idea of how many new team members we would require to run the system:
- 15. The team of 4-5 administrators are required to take care of technical issues, creation of ID & Passwords. On other hand the data entry and checking of ID’s functioning can be done with a team of 2-3 team members. 2.1 Questionnaire 2.1.1 Questionnaire Design We designed a survey distributed among random users who logs in to the intranet system for last three months. Altogether we handed out 140 sheets of questionnaire and among those 80 valid returned to us i.e. almost 77%. The questionnaire contained the questions involving the frequency of logging into the system, time taken for different section like to read articles, announcements etc. The more number of visits & the longer the user stays with the system shows the satisfaction level of the user. Concrete questions can be found in Appendix A. The aim of the survey was to detect the user’s demand towards possible service improvement in process and their satisfaction regarding the number of times the user logs back in to the system hence increasing the number of visits. 2.1.2 Statistical Result From the questionnaire there are some conclusions came out as follows. Most of people 54% logs into the system as a usual practice. Around 80% of people logs in to the system the moment they switch on the machine. Around 90% of users have complained that new account creation takes time. Around 90% user feels that the number of moderators should be increased to make the process smooth. Around 90 % user feels that the waiting time for account creation is more than required Around 85% user strongly agree that higher time taken for account creation is due to only one administrator. Around 20% people feel that they login if there is something new into the system. Almost 60% of user say that they will never give up waiting unless they get their account ID & Password to log in to the system. 3. Analyze Now we know that users want faster access to intranet. They need new, latest and updated & fresh data on intranet. Then the higher number of logging back will automatically lead to higher satisfaction level among users. The next step is to gather higher quality of reasons which causes less logging percentage on intranet.
- 16. 3.1 Cause And Effect A fish bone chart also called ‘Cause And Effect’ diagram is helpful to brain storming many reasons that can lead to an outcome and is the first step to identify the key reasons and most crucial factors that have the highest influence on the outcome. Since it is a service process and not a manufacturing process the 5 P’s are used instead of 5 M’s. The main outcome is less logging in Intranet which is caused by 5 major systems and each has served reasons or causes itself. The following figure shows the Cause And Effect diagram.
- 18. 3.2 Pareto Chart After the selection of the most crucial factors from the cause and effect diagram a correlation analysis of these main causes was made. After serious consideration since it is not possible or hardly possible to change the factors in order to achieve improvement. Condition / Factor Scale Slow account creation 9 No contribution for intranet 4 No guidance for intranet usage 5 No Content Writer For updation 7 No Provision for Backup of Server 10 Only one technical person for all zones 8 The above factors have been made by taking a scale of 1-10 i.e. 1 is least important and 10 being most important .Based on this a Pareto Chart is made. Value 10 9 8 7 5 4 Percent 23.3 20.9 18.6 16.3 11.6 9.3 Cum % 23.3 44.2 62.8 79.1 90.7 100.0 Causes no contribution No guidance for Intranet Usage no content writer one technical person AC Creation no provision of data back up 40 30 20 10 0 100 80 60 40 20 0 Value Percent Pareto Chart of Cause
- 19. 4. Improvement 4.1 Design Of Experiment 4.1.1 Introduction The DOE should find out about the influence of standardized patterns and branches on actual working or process time. The primary objective of this design of experiment is to find the crucial factors that might change the process time of a task. DOE is known as a structured, organised method for determining the relationship between factors that affect a process and the output of that process. After the experiment we want to use the Response Surface Methodology to find optimum combination of factors that yields to a minimum working time. Our objective is to find out how much standardized actions and branches contribute to the process time on Intranet. 4.1.2 Methodology New User Head Office & North Zone Administrator A Team to for data entry and its verification of data for Intranet. Different Zones Administrator to create Login ID and Password for users of that Zone. Data Entry team will check the Login ID & Passwords are working or not? Zonal Administrators will then provide the Login ID & Passwords to zonal Users. South Zone Administrator East Zone Administrator West Zone Administrator The above figure shows the general overview of the process on which I conveyed my DOE. There are six tasks carried out during DOE :-
- 20. 1. Number of new entry & at which location. 2. Providing of new user data to respective zone to the common administrator. 3. Data Entry to the data base. 4. Administrator will create Login ID and Password. 5. Check the Login ID & Password. 6. Provide the same to user. 7. Take Back Up of the system. 8. No Content Writer. 9. No proper guidance of usage to user. 10. No contribution from user to make the system fresh. In order to investigate the influence of the factors we picked from the Pareto-chart analysis on the outcome of the DOE. The output of the DOE is the time needed to complete all the tasks under certain working conditions.
- 21. Factors of DOE Factors Level - + Account Creation A One Administrator Need administrator for all different zones No Provision Of Data Backup B One Administrator Need A Technical Person. No Content Writer C No Update To Keep System Fresh Need A Content Writer to keep the system fresh and hence will increase the login rate Unexpected Task D Not Usually But need resource to be ready for disaster management.
- 22. Description of factor A “-“ the account can be created by one administrator but system would be very slow and not effective. “+” all different zones administrator can get data from local zones from their own region. The time consumed would be less and the system would be much faster and effective. Description of factor B “-“ one administrator can not do all the task so it may get neglected and this is a very important activity. “+” Need an additional technical person so as to keep back up of server and will keep the system in place and will make us ready for any disaster. Description of factor C “-“ one admin can not update the system on a regular basis to keep the system fresh and live. “+” need a content writer to keep the system updated and hence increasing the logging rate on Intranet. Description of factor D “-“ not usually since we are not always ready for any disaster and unexpected error. “+” need to be ready for any disaster like server crash, data loss or some natural disaster like fire etc. 4.3 Results FACTORS A + - + - + - + - B + + - - + + - - C + + + + - - - - D + - - + - + + - Results Mean 9.53 5.55 4.93 2.35 5.52 2 3.26 1.4
- 23. Conclusion & Outlook 6-Sigma was a very useful method to identify the factors of service process. It could have great effect on improving the service level and hence improving the customer / user satisfaction level and hit rate on intranet logging time. Using 6-sigma road map DMAIC, refectory in general can raise their throughput & serve a higher number of customers than they do now which mean they can greatly raise the effectiveness & efficiency. The major conclusions drawn were: 1. Only one administrator handling all the responsibilities hence making system & process slow. 2. User of other zones not providing data as input since there is no person responsible for intranet is available at all location zones & location. 3. No disaster management plan has been set like is some major issue occurs the system will roll back to the initial starting level of deployment without any fed data. 4. Need a content writer to keep the system life and fresh. Also not getting any input from users to keep the process rolling. It was not possible for me to match our defined goals. Though I think that the reduction of time and also increase of hit rate or logging rate on intranet is possible , but i can not predict the queue length of account creation of new users for giving access to intranet since there is no standardization that how many new joinees join the organization in a month & hence the waiting time of account creation with other factors of users and the variation is too high to promise a certain level of service speed. My report does not include a control stage. I thought that it is not appropriate to use statistical control method to see whether the service process is working well or not. Since variation comes from the user which has a great influence on the service time & logging hit rate might lead to a conclusion that the process time is too high & logging rate is low, though all improvement were already implemented. Since the service quality is theoretically improved by Six Sigma more user requirement can be met hence having a higher logging rate, but not completely. The service still has some problems to deal with like the variety of user group. The next step of improvement would be to take those popular sections on intranet that user prefer to visit & make it happening. Put in data so as to attract users for logging in to the Intranet. By this it is not guaranteed that every process would be accelerated but though the average throughput time will be shortened & hence it
- 24. will fairly lead to a good number of logging hit rate with good user satisfaction level.
- 25. Appendix A : Tables To Show Date Of Login, Total Login Of Unique User, Percentage Of Login, Weekdays & Percentage Of Visit Back On The Intranet On The Same Day. Date Hits Hit % As Per 642 Week Days Visit Back Hit % - 54% 01-Jun-10 560 87 Tuesday 302 02-Jun-10 572 89 Wednesday 309 03-Jun-10 536 83 Thursday 289 04-Jun-10 532 83 Friday 287 05-Jun-10 120 19 Saturday 65 06-Jun-10 48 7 Sunday 26 07-Jun-10 568 88 Monday 307 08-Jun-10 520 81 Tuesday 281 09-Jun-10 544 85 Wednesday 294 10-Jun-10 532 83 Thursday 287 11-Jun-10 560 87 Friday 302 12-Jun-10 108 17 Saturday 58 13-Jun-10 76 12 Sunday 41 14-Jun-10 560 87 Monday 302 15-Jun-10 572 89 Tuesday 309 16-Jun-10 556 87 Wednesday 300 17-Jun-10 548 85 Thursday 296 18-Jun-10 540 84 Friday 292 19-Jun-10 100 16 Saturday 54 20-Jun-10 52 8 Sunday 28 21-Jun-10 572 89 Monday 309 22-Jun-10 578 90 Tuesday 312 23-Jun-10 560 87 Wednesday 302 24-Jun-10 544 85 Thursday 294 25-Jun-10 556 87 Friday 300 26-Jun-10 96 15 Saturday 52 27-Jun-10 48 7 Sunday 26 28-Jun-10 520 81 Monday 281 29-Jun-10 536 83 Tuesday 289 30-Jun-10 568 88 Wednesday 307 31-May-10 572 89 Monday 309 30-May-10 556 87 Sunday 300 29-May-10 578 90 Saturday 312 28-May-10 560 87 Friday 302 27-May-10 556 87 Thursday 300 26-May-10 540 84 Wednesday 292 25-May-10 500 78 Tuesday 270 24-May-10 512 80 Monday 276
- 26. 23-May-10 60 9 Sunday 32 22-May-10 276 43 Saturday 149 21-May-10 572 89 Friday 309 20-May-10 416 65 Thursday 225 19-May-10 560 87 Wednesday 302 18-May-10 552 86 Tuesday 298 17-May-10 572 89 Monday 309 16-May-10 52 8 Sunday 28 15-May-10 180 28 Saturday 97 14-May-10 578 90 Friday 312 13-May-10 520 81 Thursday 281 12-May-10 532 83 Wednesday 287 11-May-10 552 86 Tuesday 298 10-May-10 552 86 Monday 298 09-May-10 68 11 Sunday 37 08-May-10 280 44 Saturday 151 07-May-10 544 85 Friday 294 06-May-10 540 84 Thursday 292 05-May-10 528 82 Wednesday 285 04-May-10 560 87 Tuesday 302 03-May-10 556 87 Monday 300 02-May-10 48 7 Sunday 26 01-May-10 120 19 Saturday 65 31-Mar-2010 572 89 Wednesday 309 30-Mar-2010 568 88 Tuesday 307 29-Mar-2010 544 85 monday 294 28-Mar-2010 80 12 sunday 43 27-Mar-2010 156 24 Saturday 84 26-Mar-2010 572 89 friday 309 25-Mar-2010 572 89 Thursday 309 23-Mar-2010 560 87 Tuesday 302 22-Mar-2010 544 85 Monday 294 21-Mar-2010 48 7 sunday 26 20-Mar-2010 80 12 Saturday 43 19-Mar-2010 560 87 friday 302 18-Mar-2010 540 84 Thursday 292 17-Mar-2010 520 81 Wednesday 281 16-Mar-2010 572 89 Tuesday 309 15-Mar-2010 568 88 Monday 307 14-Mar-2010 60 9 Sunday 32 13-Mar-2010 320 50 Saturday 173 12-Mar-2010 520 81 friday 281 11-Mar-2010 560 87 Thursday 302 10-Mar-2010 572 89 Wednesday 309 9-Mar-2010 552 86 Tuesday 298
- 27. 8-Mar-2010 540 84 Monday 292 6-Mar-2010 80 12 Saturday 43 5-Mar-2010 520 81 Friday 281 4-Mar-2010 572 89 Thursday 309 3-Mar-2010 564 88 Wednesday 305 2-Mar-2010 552 86 Tuesday 298 30-Apr-10 512 80 Friday 276 29-Apr-10 508 79 Thursday 274 28-Apr-10 560 87 Wednesday 302 27-Apr-10 552 86 Tuesday 298 26-Apr-10 572 89 Monday 309 25-Apr-10 16 2 Sunday 9 24-Apr-10 176 27 Saturday 95 23-Apr-10 528 82 Friday 285 22-Apr-10 572 89 Thursday 309 21-Apr-10 560 87 Wednesday 302 20-Apr-10 540 84 Tuesday 292 19-Apr-10 556 87 Monday 300 18-Apr-10 8 1 Sunday 4 17-Apr-10 132 21 Saturday 71 16-Apr-10 572 89 Friday 309 15-Apr-10 520 81 Thursday 281 14-Apr-10 548 85 Wednesday 296 13-Apr-10 556 87 Tuesday 300 12-Apr-10 532 83 Monday 287 11-Apr-10 12 2 Sunday 6 10-Apr-10 140 22 Saturday 76 09-Apr-10 576 90 Friday 311 08-Apr-10 578 90 Thursday 312 07-Apr-10 572 89 Wednesday 309 06-Apr-10 560 87 Tuesday 302 05-Apr-10 540 84 Monday 292 04-Apr-10 16 2 Sunday 9 03-Apr-10 160 25 Saturday 86 02-Apr-10 560 87 Friday 302 01-Apr-10 572 89 Thursday 309
- 28. Appendix B : Questionnaire The following questions relate to the Intranet Logging at Everest Industries Ltd. Please fill your responses to the below mentioned questions in the best of your knowledge. 1. How many times do you usually login to Intraner?________________ 2. What time do you generally take or opt to login to intranet? Mark your response. Morning 9 - 10 10 - 11 11 - 12 12 - 1 Lunch 1 - 2 After Lunch 2 - 3 3 - 4 4 – 5.30 After 5.30 3. How many articles generally you contribute per week?_______________ 4. What do you think is your waiting time for your new account creation?___________ 5. Say Yes or No in the questions given below? A) I like to get new articles on Intranet Daily?____________ B) Account creation times takes too long and should be reduced?_________ C) The access control and moderators should be increased to make the process smooth?_______________
- 29. 6. Mark your responses by ranking them in ascending order with : 1 – Strongly Agree 2 – Definitely Agree 3 – Agree 4 – Partially Agree 5 – Disagree 6 – Definitely Disagree 7 – Strongly Disagree A) Waiting time in the queue for the new account creation is due to only one System administrator._____________________ B) People login only if there is something new in the Intranet.___________ C) People wait long to get their contributed articles uploaded in contribution section._______________ 7. What do you think should be the standby period for talking a request of creation of Account and get it created. A) Average number of hours or days is convenient for me. B) It should be 24 Hours i.e One Day only. 8. How long of the waiting time in the Queue will make you give up. A) Never give up. B ) Not more than 3 working days. C) Not more than 7 working days. D) Not more than 10 working days. E) Only 24 hours. Thank You For Your Co-Operation
- 30. Appendix C : DOE Results Replication 1 Factors Results A B C D Person 1 Person 2 Person 3 Mean Pref. Sequenc e. Scale Pref. Sequen ce Scale Pref. Sequenc e Sca le + + + + 8 10 12 9 17 9.5 9.5 - + + - 6 6 13 5.5 24 5 5.5 + - + - 4 5 15 4 21 5.5 4.8 - - + + 3 2 16 2.5 18 3 1.8 + + - - 5 5 9 5 20 6 5.3 - + - + 1 2 14 1 23 2.5 1.8 + - - + 2 3 11 4 22 2.5 3.1 - - - - 7 1 10 1 19 2 1.3
- 31. Replication 2 Factors Results A B C D Person 1 Person 2 Person 3 Mean Pref. Sequenc e. Scale Pref. Sequen ce Scale Pref. Sequenc e Sca le + + + + 41 9 32 10 33 9.8 9.6 - + + - 44 5.5 29 6 40 4.8 5.4 + - + - 48 4.8 30 5 36 5.6 5.1 - - + + 46 2.5 27 2.8 35 3 2.76 + + - - 42 6 28 4.8 39 6 5.6 - + - + 43 1.8 31 2 37 2.8 2.2 + - - + 47 2.8 25 3.5 38 4 3.43 - - - - 45 2 26 2 34 1 1.6
- 32. Replication 3 Factors Results A B C D Person 1 Person 2 Person 3 Mean Pref. Sequenc e. Scale Pref. Sequen ce Scale Pref. Sequenc e Sca le + + + + 59 10 65 9.5 53 9 9.5 - + + - 62 5.5 67 6 55 5.8 5.76 + - + - 64 4.8 68 4 54 5.9 4.9 - - + + 60 2 69 3 52 2.5 2.5 + + - - 58 6 70 5 50 6 5.66 - + - + 57 2 66 1 51 3 2 + - - + 61 4 72 3 49 2.8 3.26 - - - - 63 1 71 2 56 1 1.3