SlideShare uma empresa Scribd logo
1 de 9
Baixar para ler offline
News Release
FOR IMMEDIATE RELEASE:
October sales exceed historical average
VANCOUVER, BC – November 2, 2017 – Metro Vancouver* home sales exceeded typical
historical levels in October with the majority concentrated in the townhouse and apartment
markets.
The Real Estate Board of Greater Vancouver (REBGV) reports that residential property sales in
the region totalled 3,022 in October 2017, a 35.3 per cent increase from the 2,233 sales recorded
in October 2016, and an increase of 7.1 per cent compared to September 2017 when 2,821 homes
sold.
Last month’s sales were 15 per cent above the 10-year October sales average.
"Conditions continue to vary significantly based on property type. The detached home market is
well supplied with homes for sale, which is relieving pressure on prices," Jill Oudil, REBGV
president said. "It remains a much different story in the townhouse and apartment markets.
Buyers of these properties continue to have limited supply to choose from and are seeing upward
pressure on prices."
There were 4,539 detached, attached and apartment properties newly listed for sale on the
Multiple Listing Service® (MLS®) in Metro Vancouver in October 2017. This represents a 14
per cent increase compared to the 3,981 homes listed in October 2016 and a 15.6 per cent
decrease compared to September 2017 when 5,375 homes were listed.
The total number of properties currently listed for sale on the MLS® system in Metro Vancouver
is 9,137, a 0.1 per cent decrease compared to October 2016 (9,143) and a 3.5 per cent decrease
compared to September 2017 (9,466).
For all property types, the sales-to-active listings ratio for October 2017 is 33.1 per cent. By
property type, the ratio is 16.8 per cent for detached homes, 44.8 per cent for townhomes, and 66
per cent for condominiums.
Generally, analysts say that downward pressure on home prices occurs when the ratio dips below
the 12 per cent mark for a sustained period, while home prices often experience upward pressure
when it surpasses 20 per cent over several months.
"The growth in our provincial economy and job market is contributing to today's demand," Oudil
said. "The federal government's announcement of plans to tighten mortgage requirements for the
seventh time in the last eight years also helped spur activity in the short term. Many buyers are
trying to enter the market before the changes are in place."
The MLS® Home Price Index composite benchmark price for all residential properties in Metro
Vancouver is currently $1,042,300. This represents a 12.4 per cent increase over October 2016
and a 0.5 per cent increase compared to September 2017.
Sales of detached properties in October 2017 reached 940, a 44.2 per cent increase from the 652
detached sales recorded in October 2016 and a 34.6 per cent decrease from the 1,437 sales in
October 2015. The benchmark price for detached properties is $1,609,600. This represents a four
per cent increase from October 2016 and a 0.5 per cent decrease compared to September 2017.
Sales of apartment properties reached 1,532 in October 2017, a 30.1 per cent increase compared
to the 1,178 sales in October 2016 and a 0.7 per cent decrease from the 1,543 sales in October
2015. The benchmark price of an apartment property is $642,000. This represents a 22.7 per cent
increase from October 2016 and a one per cent increase compared to September 2017.
Attached property sales in October 2017 totalled 550, a 36.5 per cent increase compared to the
403 sales in October 2016 and a 17.4 per cent decrease from the 666 sales in October 2015. The
benchmark price of an attached unit is $802,400. This represents a 17.7 per cent increase from
October 2016 and a two per cent increase compared to September 2017.
-30-
*Editor’s Note: Areas covered by the Real Estate Board of Greater Vancouver include: Whistler, Sunshine Coast,
Squamish, West Vancouver, North Vancouver, Vancouver, Burnaby, New Westminster, Richmond, Port Moody,
Port Coquitlam, Coquitlam, Pitt Meadows, Maple Ridge, and South Delta.
The real estate industry is a key economic driver in British Columbia. In 2016, 39,943 homes changed ownership in
the Board’s area, generating $2.5 billion in economic spin-off activity and an estimated 17,600 jobs. The total dollar
value of residential sales transacted through the MLS® system in Greater Vancouver totalled $40 billion in 2016.
The Real Estate Board of Greater Vancouver is an association representing more than 14,000 REALTORS® and
their companies. The Board provides a variety of member services, including the Multiple Listing Service®. For
more information on real estate, statistics, and buying or selling a home, contact a local REALTOR® or visit
www.rebgv.org.
For more information please contact:
Mark Moldowan
Senior Writer / Communication Strategist
Real Estate Board of Greater Vancouver
604.730.3153
mmoldowan@rebgv.org
Property Type Area
Benchmark
Price
Price
Index
1 Month
Change %
3 Month
Change %
6 Month
Change %
1 Year
Change %
3 Year
Change %
5 Year
Change %
10 Year
Change %
Residential / Composite Lower Mainland $941,700 265.7 0.6% 2.4% 10.0% 13.7% 64.5% 72.5% 86.8%
Greater Vancouver $1,042,300 272.5 0.5% 2.3% 9.1% 12.4% 62.1% 71.7% 90.8%
Bowen Island $958,900 207.9 -0.1% 5.0% 9.2% 20.9% 62.9% 63.6% 51.6%
Burnaby East $941,200 261.8 -1.1% 0.0% 8.0% 11.7% 56.9% 67.1% 84.1%
Burnaby North $892,900 269.6 0.8% 3.5% 8.1% 14.4% 63.0% 74.2% 90.1%
Burnaby South $995,900 281.3 -0.1% 2.0% 8.5% 15.5% 64.2% 73.4% 98.7%
Coquitlam $909,200 269.7 0.4% 2.7% 10.8% 16.1% 67.8% 80.2% 92.6%
Ladner $861,500 241.8 0.8% 1.7% 6.4% 2.7% 53.7% 62.8% 76.6%
Maple Ridge $680,100 228.7 1.0% 4.5% 13.8% 17.9% 70.2% 70.7% 66.6%
New Westminster $651,600 279.3 0.4% 3.5% 14.6% 23.3% 68.5% 76.7% 89.2%
North Vancouver $1,093,900 245.8 0.0% 0.6% 7.3% 9.6% 58.1% 66.9% 78.2%
Pitt Meadows $669,200 244.8 0.3% 5.9% 15.1% 19.6% 68.7% 77.9% 74.0%
Port Coquitlam $719,800 253.9 0.6% 2.2% 12.0% 18.5% 70.3% 76.4% 78.1%
Port Moody $905,600 250.3 1.2% 4.6% 12.1% 17.8% 66.4% 77.1% 79.7%
Richmond $985,000 287.6 0.5% 1.9% 8.3% 10.8% 63.7% 70.4% 103.5%
Squamish $814,300 260.7 2.6% 10.2% 12.3% 27.5% 91.3% 107.2% 104.0%
Sunshine Coast $588,500 206.2 0.8% 3.7% 9.7% 21.1% 65.6% 61.1% 50.6%
Tsawwassen $1,001,000 251.4 0.4% 1.4% 5.7% 2.3% 60.2% 66.2% 81.4%
Vancouver East $1,083,900 317.4 0.3% 1.0% 8.5% 9.4% 65.3% 78.3% 115.5%
Vancouver West $1,362,500 287.3 0.5% 1.4% 7.8% 10.0% 56.8% 71.5% 94.1%
West Vancouver $2,605,500 280.1 -0.8% -1.8% 3.4% -2.6% 52.6% 67.8% 93.8%
Whistler $967,400 212.7 4.0% 14.8% 15.3% 30.5% 89.2% 101.4% 68.0%
Single Family Detached Lower Mainland $1,321,700 280.4 -0.4% 0.1% 6.8% 6.7% 63.7% 73.8% 101.4%
Greater Vancouver $1,609,600 295.8 -0.5% -0.2% 5.4% 4.0% 61.0% 72.4% 110.4%
Bowen Island $958,900 207.9 -0.1% 5.0% 9.2% 20.9% 62.9% 63.6% 51.6%
Burnaby East $1,257,500 281.2 -1.4% -2.2% 4.8% 6.5% 58.2% 69.4% 102.0%
Burnaby North $1,577,700 305.1 -1.2% -0.5% 3.3% 1.8% 58.7% 72.7% 117.8%
Burnaby South $1,705,100 326.4 -1.4% -0.8% 4.5% 2.9% 62.7% 72.3% 134.1%
Coquitlam $1,277,400 283.5 -0.2% 0.1% 7.3% 6.8% 66.7% 80.2% 105.9%
Ladner $1,027,600 247.7 1.2% 1.7% 6.1% -0.8% 58.0% 69.1% 84.4%
Maple Ridge $811,500 231.2 -0.1% 2.3% 10.7% 13.6% 70.4% 74.2% 72.2%
New Westminster $1,132,500 282.5 -0.5% -1.6% 4.9% 9.7% 60.5% 70.2% 102.4%
North Vancouver $1,700,200 265.9 -0.7% -1.0% 4.6% 2.1% 63.1% 76.9% 95.8%
Pitt Meadows $878,700 247.6 -1.6% 1.2% 10.4% 10.9% 67.8% 76.0% 81.5%
Port Coquitlam $994,600 265.2 -0.1% -0.1% 7.2% 13.0% 69.5% 77.2% 93.6%
Port Moody $1,509,100 278.7 0.8% 4.3% 9.9% 9.6% 66.8% 75.8% 100.1%
Richmond $1,690,000 339.4 -0.3% 0.5% 5.5% 2.3% 67.5% 73.4% 137.8%
Squamish $983,000 250.9 -1.2% 1.3% 6.3% 20.7% 75.7% 93.0% 97.2%
Sunshine Coast $584,900 204.9 0.8% 3.6% 9.9% 20.9% 65.4% 60.5% 49.8%
Tsawwassen $1,275,300 274.6 0.4% 1.0% 6.0% 1.7% 68.6% 76.5% 98.8%
Vancouver East $1,566,700 346.3 0.1% 0.3% 6.3% 3.3% 64.4% 86.2% 145.3%
Vancouver West $3,626,300 372.3 -0.7% -1.1% 3.7% 1.6% 57.1% 75.8% 140.3%
West Vancouver $3,095,300 292.2 -1.3% -2.7% 2.3% -5.4% 51.6% 68.4% 102.4%
Whistler $1,629,400 206.6 -0.9% 2.2% 6.8% 15.5% 66.5% 77.8% 64.2%
HOW TO READ THE TABLE:
• Benchmark Price: Estimated sale price of a benchmark property. Benchmarks represent a typical property within each market.
• Price Index: Index numbers estimate the percentage change in price on typical and constant quality properties over time. All figures are based on past sales.
• x Month/Year Change %: Percentage change of index over a period of x month(s)/year(s) *
In January 2005, the indexes are set to 100.
Townhome properties are similar to Attached properties, a category that was used in the previous MLSLink HPI, but do not included duplexes.
The above info is deemed reliable, but is not guaranteed. All dollar amounts in CDN.
October 2017*
* MLS®, Multiple Listing Service®, and all related graphics are trademarks of The Canadian Real Estate Association 1 of 15
Property Type Area
Benchmark
Price
Price
Index
1 Month
Change %
3 Month
Change %
6 Month
Change %
1 Year
Change %
3 Year
Change %
5 Year
Change %
10 Year
Change %
October 2017*
Townhouse Lower Mainland $671,000 242.5 1.4% 4.3% 11.1% 17.6% 63.1% 68.2% 74.7%
Greater Vancouver $802,400 258.9 2.0% 5.1% 10.5% 17.7% 62.7% 71.0% 86.1%
Burnaby East $647,000 239.0 1.7% 5.3% 10.8% 21.2% 50.3% 56.5% 71.2%
Burnaby North $718,800 268.3 2.4% 4.3% 10.7% 20.1% 59.4% 70.9% 86.3%
Burnaby South $762,300 262.6 1.9% 0.9% 8.2% 17.2% 57.2% 67.7% 86.8%
Coquitlam $650,600 238.7 1.4% 3.1% 7.7% 19.2% 58.4% 65.4% 74.7%
Ladner $744,800 259.7 0.3% 0.9% 7.4% 16.4% 55.9% 62.8% 81.5%
Maple Ridge $529,700 245.9 2.9% 5.8% 17.8% 26.4% 76.3% 77.9% 75.4%
New Westminster $678,800 268.4 1.6% 5.0% 9.8% 22.3% 56.8% 66.5% 90.1%
North Vancouver $977,000 237.4 1.3% 2.8% 7.3% 15.0% 56.6% 66.9% 77.4%
Pitt Meadows $574,100 248.4 0.2% 5.5% 15.3% 21.0% 74.6% 78.2% 76.5%
Port Coquitlam $643,300 242.7 1.3% 2.9% 13.0% 16.0% 65.3% 72.0% 71.9%
Port Moody $606,300 204.9 0.1% 1.5% 10.9% 15.7% 40.3% 47.4% 45.7%
Richmond $800,000 262.9 -0.2% 1.6% 7.5% 12.6% 55.8% 62.2% 91.1%
Squamish $899,000 326.6 11.7% 34.3% 19.6% 43.8% 148.4% 166.2% 160.2%
Tsawwassen $740,200 275.7 0.4% 1.9% 7.1% 19.0% 66.1% 68.2% 92.7%
Vancouver East $855,200 280.7 0.5% 0.0% 10.9% 10.7% 55.9% 68.1% 87.8%
Vancouver West $1,265,100 279.4 0.0% 2.7% 7.0% 11.1% 61.0% 78.9% 100.1%
Whistler $1,050,700 281.0 15.2% 36.9% 20.4% 36.5% 114.7% 130.3% 130.7%
Apartment Lower Mainland $593,600 259.5 1.4% 4.9% 14.6% 25.0% 68.6% 73.9% 75.5%
Greater Vancouver $642,000 258.0 1.0% 4.1% 13.3% 22.7% 65.8% 73.2% 76.2%
Burnaby East $661,100 251.0 -3.1% 2.1% 17.6% 25.6% 59.7% 80.4% 63.8%
Burnaby North $587,200 250.7 1.8% 6.6% 12.0% 26.7% 69.6% 78.3% 75.9%
Burnaby South $664,200 266.7 0.0% 4.1% 11.5% 25.3% 69.5% 77.8% 85.6%
Coquitlam $486,700 267.1 0.9% 6.0% 16.9% 31.6% 77.1% 89.3% 83.8%
Ladner $422,600 200.3 0.0% 3.9% 6.8% 2.2% 34.6% 39.1% 43.5%
Maple Ridge $269,300 194.5 2.6% 13.7% 23.3% 31.1% 62.9% 45.8% 30.1%
New Westminster $490,900 279.8 0.5% 5.1% 18.9% 29.5% 73.7% 81.0% 85.4%
North Vancouver $556,900 226.7 0.6% 2.2% 12.0% 21.5% 55.4% 56.5% 60.6%
Pitt Meadows $403,700 238.6 2.9% 13.3% 22.5% 32.0% 65.2% 81.3% 59.6%
Port Coquitlam $418,200 250.1 1.0% 4.3% 16.8% 27.7% 77.4% 81.0% 64.8%
Port Moody $613,300 255.6 2.0% 6.4% 15.5% 28.6% 83.1% 96.0% 85.2%
Richmond $609,600 260.2 1.8% 4.7% 14.0% 26.3% 69.0% 76.2% 82.2%
Squamish $454,100 218.7 -2.7% 1.9% 15.0% 27.1% 74.7% 83.2% 65.6%
Tsawwassen $452,200 190.7 0.2% 3.8% 6.9% 5.8% 39.6% 40.5% 36.6%
Vancouver East $538,500 297.1 0.5% 2.6% 12.1% 19.7% 72.0% 74.6% 90.6%
Vancouver West $806,500 261.7 1.3% 2.9% 11.1% 17.4% 60.9% 72.3% 78.3%
West Vancouver $1,163,100 235.6 0.8% 2.3% 8.0% 18.5% 60.4% 66.4% 62.4%
Whistler $498,400 163.4 -5.3% 1.5% 16.1% 35.2% 94.5% 113.9% 24.5%
HOW TO READ THE TABLE:
• Benchmark Price: Estimated sale price of a benchmark property. Benchmarks represent a typical property within each market.
• Price Index: Index numbers estimate the percentage change in price on typical and constant quality properties over time. All figures are based on past sales.
• x Month/Year Change %: Percentage change of index over a period of x month(s)/year(s)
In January 2005, the indexes are set to 100. *
Townhome properties are similar to attached properties, a category that was used in the previous MLSLink HPI, but do not included duplexes.
Lower Mainland includes areas serviced by both Real Estate Board of Greater Vancouver & Fraser Valley Real Estate Board.
The above info is deemed reliable, but is not guaranteed. All dollar amounts in CDN.
* MLS®, Multiple Listing Service®, and all related graphics are trademarks of The Canadian Real Estate Association 2 of 15
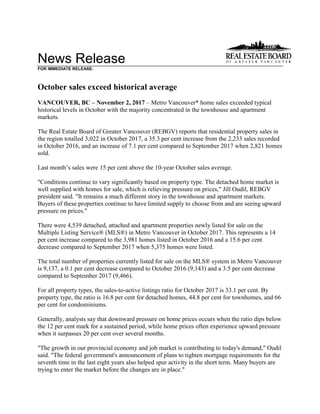
C:DATAMonthEndHpiexporthi_resgv-hpi2.tifGreaterVancouver
5YearTrend
60
110
160
210
260
310
Oct 2012
Dec 2012
Feb 2013
Apr 2013
Jun 2013
Aug 2013
Oct 2013
Dec 2013
Feb 2014
Apr 2014
Jun 2014
Aug 2014
Oct 2014
Dec 2014
Feb 2015
Apr 2015
Jun 2015
Aug 2015
Oct 2015
Dec 2015
Feb 2016
Apr 2016
Jun 2016
Aug 2016
Oct 2016
Dec 2016
Feb 2017
Apr 2017
Jun 2017
Aug 2017
Oct 2017
Price
Index
ResidentialDetachedTownhouseApartment
Jan2005HPI=100
10242017MLS®
SALESFacts
Burnaby
Coquitlam
Delta-South
Islands-Gulf
MapleRidge/PittMeadows
NewWestminster
NorthVancouver
PortCoquitlam
PortMoody/Belcarra
Richmond
Squamish
SunshineCoast
VancouverEast
VancouverWest
WestVancouver/HoweSound
Whistler/Pemberton
Detached8888466121238131229121651061082914940
Attached7042110501342211711730104054726550
Apartment20611613046116125663620217111503928281,532
Detached$1,600,000$1,255,000$1,182,500n/a$865,000$1,153,500$1,675,000$1,050,000$1,337,500$1,675,000$1,050,000$580,000$1,621,000$3,787,500$2,518,000n/a
Attached$680,000$756,000n/an/a$525,500n/a$1,037,450$699,000n/a$830,000$649,000n/a$1,015,000$1,399,000n/a$1,099,000n/a
Apartment$565,000$488,900n/an/a$351,000$493,000$700,500$400,000$624,500$540,000n/an/a$595,000$818,000n/a$346,000
Detached627538101362274411789126195733512852
Attached6643515516292712902994164427518
Apartment19110913032117107552420017612940317311,451
Detached$1,677,500$1,308,000$1,226,976n/a$824,960$1,205,000$1,734,250$928,000n/a$1,790,000n/a$699,000$1,610,000$3,662,500$3,240,000n/a
Attached$736,250$695,000n/an/a$515,000n/a$1,144,000$625,000n/a$865,000$670,000n/a$910,000$1,322,500n/a$699,000n/a
Apartment$548,000$465,000n/an/a$360,000$506,000$620,000$425,500$545,635$519,000n/an/a$585,000$769,444n/a$489,000
Detached44592141101461291561114365782215652
Attached52291404263217156814122830242403
Apartment15095160328674463416110510929911501,178
Detached$1,550,000$1,190,000$1,075,000n/a$717,500n/a$1,560,000$843,500n/a$1,563,000n/a$451,825$1,413,775$3,200,000$3,362,500n/a
Attached$660,000$620,000n/an/a$420,500n/a$825,000n/an/a$744,500n/an/a$928,099$1,129,800n/a$651,000n/a
Apartment$432,000$380,000n/an/a$295,000$370,000$500,400$304,950$432,500$433,750n/an/a$468,700$650,000n/a$428,750
Detached782921494661,2862259024331851,1392476261,21293944216110,060
Attached65544312825901813552711771,020239108398563592765,465
Apartment2,0431,20617406061,1581,0705113592,158167991,5594,05718031015,657
Detached$1,610,000$1,270,000$1,139,400$460,000$795,011$1,150,000$1,725,000$940,000$1,328,000$1,655,000$925,000$590,000$1,575,000$3,455,000$3,117,500$1,745,000
Attached$750,000$735,000$689,950n/a$479,850$685,000$1,013,000$622,000$647,000$830,000$604,900$383,700$988,500$1,345,000$1,850,000$773,000n/a
Apartment$535,000$475,000$510,000n/a$321,448$460,000$605,000$375,000$539,900$501,800$399,000$359,000$540,000$755,000$1,043,750$380,000
Detached1,0601,287561641,7663531,1335322771,5362618681,3541,45977718813,476
Attached6964921210683126421298213941176108389643653235,695
Apartment2,3131,31417705531,0571,1416243742,290167981,4634,64820042516,844
Detached$1,618,000$1,238,000$1,200,000$435,750$720,000$1,093,000$1,650,000$865,000$1,300,000$1,690,000$835,000$485,000$1,540,000$3,500,400$3,200,000$1,377,000
Attached$675,000$675,750$680,000n/a$405,000$541,000$880,000$541,000$595,000$739,000$539,500$305,750$895,000$1,200,000$1,650,000$721,000n/a
Apartment$436,000$375,000$455,000n/a$239,000$355,000$470,000$286,400$444,500$410,000$339,000$279,000$443,000$643,000$820,000$309,000
Note:MedianSellingPricesarenotreportedforareaswithlessthan20salesorfortheGulfIslands
Number
of
Sales
October
2017
Number
of
Sales
Median
Selling
Price
Number
of
Sales
Median
Selling
Price
Number
of
Sales
Median
Selling
Price
September
2017
October
2016
Jan.-
Oct.2017
Jan.-
Oct.2016
Median
Selling
Price
Number
of
Sales
Median
Selling
Price
October
2017
Year-to-date
Year-to-date
10242017MLS®
LISTINGSFacts
Burnaby
Coquitlam
Delta-South
Islands-Gulf
MapleRidge/PittMeadows
NewWestminster
NorthVancouver
PortCoquitlam
PortMoody/Belcarra
Richmond
Squamish
SunshineCoast
VancouverEast
VancouverWest
WestVancouver/HoweSound
Whistler/Pemberton
Detached1841518781543817552332253158248220150231,837
Attached835514074186222221442311101991328769
Apartment20812814060134168504524721719960231191,933
Detached48%58%53%75%79%61%46%60%67%40%68%112%43%49%19%61%
Attached84%76%79%n/a68%72%68%95%77%81%130%91%40%55%54%93%n/a
Apartment99%91%93%n/a77%87%74%132%80%82%81%157%75%65%26%147%
Detached254224107111875323045432653882278327221252,390
Attached109531906318623426149327811031832806
Apartment26216019052167175785129417920461942302,179
Detached24%33%36%91%73%42%32%91%40%34%32%74%34%22%16%48%
Attached61%81%26%n/a87%89%47%79%46%60%91%129%51%62%22%84%n/a
Apartment73%68%68%n/a62%70%61%71%47%68%100%67%63%65%40%103%
Detached1601236771663415657261913251233163119181,603
Attached605729074144330211182275491543668
Apartment20412221059101112583819922921049517431,710
Detached28%48%31%57%66%41%39%51%58%32%34%84%28%48%18%83%
Attached87%51%48%n/a57%43%74%57%71%58%64%171%52%33%40%98%n/a
Apartment74%78%76%n/a54%85%66%79%89%81%45%56%52%60%65%116%
Detached2,0191,8039241111,9114011,7526293642,7344208962,6092,5131,59623920,921
Attached99158414956832365233412201,5012881297069421253027,725
Apartment2,5381,47620806851,4051,4066224482,6871831011,9625,65829133920,009
Detached39%51%53%59%67%56%51%69%51%42%59%70%46%37%28%67%
Attached66%76%86%40%86%77%68%79%80%68%83%84%56%60%47%91%n/a
Apartment80%82%84%n/a88%82%76%82%80%80%91%98%79%72%62%91%
Detached2,2012,1701,0471262,4335381,8828654523,1934381,0732,8492,8861,76423924,156
Attached1,02266820547881565414262531,360264113588932953457,760
Apartment2,7601,59924206311,2931,4967214692,7402461031,8886,31128743521,221
Detached48%59%54%51%73%66%60%62%61%48%60%81%48%51%44%79%
Attached68%74%59%0%87%81%78%70%84%69%67%96%66%69%68%94%n/a
Apartment84%82%73%n/a88%82%76%87%80%84%68%95%77%74%70%98%
*Year-to-datelistingsrepresentacumulativetotaloflistingsratherthantotalactivelistings.
%Salesto
Listings
Number
of
Listings
%Salesto
Listings
September
2017
October
2016
Jan.-
Oct.2017
Jan.-
Oct.2016
%Salesto
Listings
Number
of
Listings
%Salesto
Listings
Number
of
Listings
October
2017
Number
of
Listings
%Salesto
Listings
Number
of
Listings
October
2017
Year-to-date*
Year-to-date*
Listing & Sales Activity Summary
Listings Sales
1 2 3 Col. 2 & 3 5 6 7 Col. 6 & 7 9 10 Col. 9 & 10
Oct Sep Oct Percentage Oct Sep Oct Percentage Aug 2016 - Aug 2017 - Percentage
2016 2017 2017 Variance 2016 2017 2017 Variance Oct 2016 Oct 2017 Variance
BURNABY % % %
DETACHED 160 254 184 -27.6 44 62 88 41.9 146 215 47.3
ATTACHED 60 109 83 -23.9 52 66 70 6.1 129 204 58.1
APARTMENTS 204 262 208 -20.6 150 191 206 7.9 498 626 25.7
COQUITLAM
DETACHED 123 224 151 -32.6 59 75 88 17.3 179 245 36.9
ATTACHED 57 53 55 3.8 29 43 42 -2.3 89 124 39.3
APARTMENTS 122 160 128 -20.0 95 109 116 6.4 277 351 26.7
DELTA
DETACHED 67 107 87 -18.7 21 38 46 21.1 65 137 110.8
ATTACHED 29 19 14 -26.3 14 5 11 120.0 36 24 -33.3
APARTMENTS 21 19 14 -26.3 16 13 13 0.0 42 44 4.8
MAPLE RIDGE/PITT MEADOWS
DETACHED 166 187 154 -17.6 110 136 121 -11.0 337 396 17.5
ATTACHED 74 63 74 17.5 42 55 50 -9.1 162 159 -1.9
APARTMENTS 59 52 60 15.4 32 32 46 43.8 135 124 -8.1
NORTH VANCOUVER
DETACHED 156 230 175 -23.9 61 74 81 9.5 176 230 30.7
ATTACHED 43 62 62 0.0 32 29 42 44.8 84 102 21.4
APARTMENTS 112 175 168 -4.0 74 107 125 16.8 248 343 38.3
NEW WESTMINSTER
DETACHED 34 53 38 -28.3 14 22 23 4.5 44 64 45.5
ATTACHED 14 18 18 0.0 6 16 13 -18.8 19 45 136.8
APARTMENTS 101 167 134 -19.8 86 117 116 -0.9 277 367 32.5
PORT MOODY/BELCARRA
DETACHED 26 43 33 -23.3 15 17 22 29.4 35 52 48.6
ATTACHED 21 26 22 -15.4 15 12 17 41.7 51 50 -2.0
APARTMENTS 38 51 45 -11.8 34 24 36 50.0 101 93 -7.9
PORT COQUITLAM
DETACHED 57 45 52 15.6 29 41 31 -24.4 78 120 53.8
ATTACHED 30 34 22 -35.3 17 27 21 -22.2 51 69 35.3
APARTMENTS 58 78 50 -35.9 46 55 66 20.0 151 165 9.3
RICHMOND
DETACHED 191 265 225 -15.1 61 89 91 2.2 201 269 33.8
ATTACHED 118 149 144 -3.4 68 90 117 30.0 199 330 65.8
APARTMENTS 199 294 247 -16.0 161 200 202 1.0 482 644 33.6
SUNSHINE COAST
DETACHED 51 82 58 -29.3 43 61 65 6.6 170 189 11.2
ATTACHED 7 7 11 57.1 12 9 10 11.1 34 34 0.0
APARTMENTS 9 9 7 -22.2 5 6 11 83.3 22 31 40.9
SQUAMISH
DETACHED 32 38 31 -18.4 11 12 21 75.0 53 65 22.6
ATTACHED 22 32 23 -28.1 14 29 30 3.4 37 74 100.0
APARTMENTS 22 17 21 23.5 10 17 17 0.0 34 52 52.9
VANCOUVER EAST
DETACHED 233 278 248 -10.8 65 95 106 11.6 205 315 53.7
ATTACHED 54 81 101 24.7 28 41 40 -2.4 78 112 43.6
APARTMENTS 210 204 199 -2.5 109 129 150 16.3 336 421 25.3
VANCOUVER WEST
DETACHED 163 327 220 -32.7 78 73 108 47.9 199 233 17.1
ATTACHED 91 103 99 -3.9 30 64 54 -15.6 116 174 50.0
APARTMENTS 495 619 602 -2.7 299 403 392 -2.7 970 1201 23.8
WHISTLER/PEMBERTON
DETACHED 18 25 23 -8.0 15 12 14 16.7 52 45 -13.5
ATTACHED 43 32 28 -12.5 42 27 26 -3.7 110 84 -23.6
APARTMENTS 43 30 19 -36.7 50 31 28 -9.7 122 90 -26.2
WEST VANCOUVER/HOWE SOUND
DETACHED 119 221 150 -32.1 22 35 29 -17.1 75 94 25.3
ATTACHED 5 18 13 -27.8 2 4 7 75.0 8 11 37.5
APARTMENTS 17 42 31 -26.2 11 17 8 -52.9 44 44 0.0
GRAND TOTALS
DETACHED 1596 2379 1829 -23.1 648 842 934 10.9 2015 2669 32.5
ATTACHED 668 806 769 -4.6 403 517 550 6.4 1203 1596 32.7
APARTMENTS 1710 2179 1933 -11.3 1178 1451 1532 5.6 3739 4596 22.9
ResidentialAverageSalePrices-January1977toOctober2017
0
200
400
600
800
1000
1200
1400
1600
1800
2000
1977
1978
1979
1980
1981
1982
1983
1984
1985
1986
1987
1988
1989
1990
1991
1992
1993
1994
1995
1996
1997
1998
1999
2000
2001
2002
2003
2004
2005
2006
2007
2008
2009
2010
2011
2012
2013
2014
2015
2016
2017
DETACHEDCONDOMINIUMATTACHEDAPARTMENTS
INTHOUSANDS($)
NOTE:From1977-1984condominiumaverageswerenotseparatedintoattached&apartment.
$892,349
$687,053
$1,803,162

Mais conteúdo relacionado

Mais procurados

March 2017 Rebgv Stats Package Mike Stewart
March 2017 Rebgv Stats Package Mike StewartMarch 2017 Rebgv Stats Package Mike Stewart
March 2017 Rebgv Stats Package Mike StewartMike Stewart
 
December 2016 rebgv statistics package mike stewart vancouver realtor
December 2016 rebgv statistics package mike stewart vancouver realtorDecember 2016 rebgv statistics package mike stewart vancouver realtor
December 2016 rebgv statistics package mike stewart vancouver realtorMike Stewart
 
January 2017 Rebgv Statistics Package Mike Stewart Vancouver Realtor
January 2017 Rebgv Statistics Package Mike Stewart Vancouver RealtorJanuary 2017 Rebgv Statistics Package Mike Stewart Vancouver Realtor
January 2017 Rebgv Statistics Package Mike Stewart Vancouver RealtorMike Stewart
 
2017 Real Estate Board of Greater Vancouver Statistics Package with Charts & ...
2017 Real Estate Board of Greater Vancouver Statistics Package with Charts & ...2017 Real Estate Board of Greater Vancouver Statistics Package with Charts & ...
2017 Real Estate Board of Greater Vancouver Statistics Package with Charts & ...Kathryn Huang
 
August 2017 Greater Boston Real Estate Market Trends
August 2017 Greater Boston Real Estate Market TrendsAugust 2017 Greater Boston Real Estate Market Trends
August 2017 Greater Boston Real Estate Market TrendsJoe Schutt
 
October 2017 Greater Boston Real Estate Market Trends
October 2017 Greater Boston Real Estate Market TrendsOctober 2017 Greater Boston Real Estate Market Trends
October 2017 Greater Boston Real Estate Market TrendsJoe Schutt
 
September 2017 Greater Boston Real Estate Indicators Report
September 2017 Greater Boston Real Estate Indicators ReportSeptember 2017 Greater Boston Real Estate Indicators Report
September 2017 Greater Boston Real Estate Indicators ReportJoe Schutt
 
July 2017 Greater Boston Real Estate Market Trends
July 2017 Greater Boston Real Estate Market TrendsJuly 2017 Greater Boston Real Estate Market Trends
July 2017 Greater Boston Real Estate Market TrendsJoe Schutt
 
San Francisco Market Focus November 2017
San Francisco Market Focus November 2017San Francisco Market Focus November 2017
San Francisco Market Focus November 2017Ronny Budiutama
 
May 2017 Greater Boston Association of Realtors Monthly Indicators Report
May 2017 Greater Boston Association of Realtors Monthly Indicators ReportMay 2017 Greater Boston Association of Realtors Monthly Indicators Report
May 2017 Greater Boston Association of Realtors Monthly Indicators ReportJoe Schutt
 
This Month in Real Estate August 2011
This Month in Real Estate August 2011This Month in Real Estate August 2011
This Month in Real Estate August 2011pdrury
 
November 2014 Greater Boston Real Estate Market Trends Report
November 2014 Greater Boston Real Estate Market Trends ReportNovember 2014 Greater Boston Real Estate Market Trends Report
November 2014 Greater Boston Real Estate Market Trends ReportUnit Realty Group
 
Annie Williams Real Estate Report - September 2021
Annie Williams Real Estate Report - September 2021Annie Williams Real Estate Report - September 2021
Annie Williams Real Estate Report - September 2021Annie Williams
 

Mais procurados (20)

March 2017 Rebgv Stats Package Mike Stewart
March 2017 Rebgv Stats Package Mike StewartMarch 2017 Rebgv Stats Package Mike Stewart
March 2017 Rebgv Stats Package Mike Stewart
 
December 2016 rebgv statistics package mike stewart vancouver realtor
December 2016 rebgv statistics package mike stewart vancouver realtorDecember 2016 rebgv statistics package mike stewart vancouver realtor
December 2016 rebgv statistics package mike stewart vancouver realtor
 
January 2017 Rebgv Statistics Package Mike Stewart Vancouver Realtor
January 2017 Rebgv Statistics Package Mike Stewart Vancouver RealtorJanuary 2017 Rebgv Statistics Package Mike Stewart Vancouver Realtor
January 2017 Rebgv Statistics Package Mike Stewart Vancouver Realtor
 
2017 Real Estate Board of Greater Vancouver Statistics Package with Charts & ...
2017 Real Estate Board of Greater Vancouver Statistics Package with Charts & ...2017 Real Estate Board of Greater Vancouver Statistics Package with Charts & ...
2017 Real Estate Board of Greater Vancouver Statistics Package with Charts & ...
 
Corelogic home value index dec 1 2021 final
Corelogic home value index dec 1 2021 finalCorelogic home value index dec 1 2021 final
Corelogic home value index dec 1 2021 final
 
Australian Regional Market Report
Australian Regional Market ReportAustralian Regional Market Report
Australian Regional Market Report
 
August 2017 Greater Boston Real Estate Market Trends
August 2017 Greater Boston Real Estate Market TrendsAugust 2017 Greater Boston Real Estate Market Trends
August 2017 Greater Boston Real Estate Market Trends
 
October 2017 Greater Boston Real Estate Market Trends
October 2017 Greater Boston Real Estate Market TrendsOctober 2017 Greater Boston Real Estate Market Trends
October 2017 Greater Boston Real Estate Market Trends
 
September 2017 Greater Boston Real Estate Indicators Report
September 2017 Greater Boston Real Estate Indicators ReportSeptember 2017 Greater Boston Real Estate Indicators Report
September 2017 Greater Boston Real Estate Indicators Report
 
July 2017 Greater Boston Real Estate Market Trends
July 2017 Greater Boston Real Estate Market TrendsJuly 2017 Greater Boston Real Estate Market Trends
July 2017 Greater Boston Real Estate Market Trends
 
San Francisco Market Focus November 2017
San Francisco Market Focus November 2017San Francisco Market Focus November 2017
San Francisco Market Focus November 2017
 
October Housing Report for Southwest California
October Housing Report for Southwest CaliforniaOctober Housing Report for Southwest California
October Housing Report for Southwest California
 
May 2017 Greater Boston Association of Realtors Monthly Indicators Report
May 2017 Greater Boston Association of Realtors Monthly Indicators ReportMay 2017 Greater Boston Association of Realtors Monthly Indicators Report
May 2017 Greater Boston Association of Realtors Monthly Indicators Report
 
2016 01-rental review dec 2015-released jan 2016
2016 01-rental review dec 2015-released jan 20162016 01-rental review dec 2015-released jan 2016
2016 01-rental review dec 2015-released jan 2016
 
Media release-6-december-2017-Sept-2017-quarter
Media release-6-december-2017-Sept-2017-quarterMedia release-6-december-2017-Sept-2017-quarter
Media release-6-december-2017-Sept-2017-quarter
 
Realtor Report for June 2018
Realtor Report for June 2018Realtor Report for June 2018
Realtor Report for June 2018
 
This Month in Real Estate August 2011
This Month in Real Estate August 2011This Month in Real Estate August 2011
This Month in Real Estate August 2011
 
November 2014 Greater Boston Real Estate Market Trends Report
November 2014 Greater Boston Real Estate Market Trends ReportNovember 2014 Greater Boston Real Estate Market Trends Report
November 2014 Greater Boston Real Estate Market Trends Report
 
Facebook report
Facebook reportFacebook report
Facebook report
 
Annie Williams Real Estate Report - September 2021
Annie Williams Real Estate Report - September 2021Annie Williams Real Estate Report - September 2021
Annie Williams Real Estate Report - September 2021
 

Semelhante a October 2017 REBGV Stats Mike Stewart Vancouver Realtor

October 2016 REBGV Statistics Package Vancouver BC Mike Stewart Realtor
October 2016 REBGV Statistics Package Vancouver BC Mike Stewart RealtorOctober 2016 REBGV Statistics Package Vancouver BC Mike Stewart Realtor
October 2016 REBGV Statistics Package Vancouver BC Mike Stewart RealtorMike Stewart
 
November 2017 rebgv stats mike stewart real estate agent
November 2017 rebgv stats mike stewart real estate agentNovember 2017 rebgv stats mike stewart real estate agent
November 2017 rebgv stats mike stewart real estate agentMike Stewart
 
Rebgv stats-pkg-september-2018
Rebgv stats-pkg-september-2018Rebgv stats-pkg-september-2018
Rebgv stats-pkg-september-2018Kathryn Huang
 
Real Estate Board of Greater Vancouver Statistics Package November 2020
Real Estate Board of Greater Vancouver Statistics Package November 2020Real Estate Board of Greater Vancouver Statistics Package November 2020
Real Estate Board of Greater Vancouver Statistics Package November 2020Vicky Aulakh
 
July 2017 Real Estate Board of Greater Vancouver Stats Package Mike Stewart r...
July 2017 Real Estate Board of Greater Vancouver Stats Package Mike Stewart r...July 2017 Real Estate Board of Greater Vancouver Stats Package Mike Stewart r...
July 2017 Real Estate Board of Greater Vancouver Stats Package Mike Stewart r...Mike Stewart
 
REBGV Statistic Package December 2020
REBGV Statistic Package December 2020REBGV Statistic Package December 2020
REBGV Statistic Package December 2020Vicky Aulakh
 
Real Estate Board of Greater Vancouver Statistics Package August 2021
Real Estate Board of Greater Vancouver Statistics Package August 2021Real Estate Board of Greater Vancouver Statistics Package August 2021
Real Estate Board of Greater Vancouver Statistics Package August 2021Vicky Aulakh
 
201807 rebgv-stats-package-for-media
201807 rebgv-stats-package-for-media201807 rebgv-stats-package-for-media
201807 rebgv-stats-package-for-mediaKathryn Huang
 
Rebgv stats-pkg-february-2018
Rebgv stats-pkg-february-2018Rebgv stats-pkg-february-2018
Rebgv stats-pkg-february-2018Kathryn Huang
 
Rebgv stats-pkg-november-2018
Rebgv stats-pkg-november-2018Rebgv stats-pkg-november-2018
Rebgv stats-pkg-november-2018Kathryn Huang
 
Vancouver real estate stats package, August 2013
Vancouver real estate stats package, August 2013Vancouver real estate stats package, August 2013
Vancouver real estate stats package, August 2013Matt Collinge
 
January 2016 rebgv stats mike stewart realtor Corrected Feb 5 2016
January 2016 rebgv stats mike stewart realtor Corrected Feb 5 2016January 2016 rebgv stats mike stewart realtor Corrected Feb 5 2016
January 2016 rebgv stats mike stewart realtor Corrected Feb 5 2016Mike Stewart
 
Real Estate Board of Greater Vancouver Statistics Package March 2021
Real Estate Board of Greater Vancouver Statistics Package March 2021Real Estate Board of Greater Vancouver Statistics Package March 2021
Real Estate Board of Greater Vancouver Statistics Package March 2021Vicky Aulakh
 
Rebgv stats-pkg-december-2018
Rebgv stats-pkg-december-2018Rebgv stats-pkg-december-2018
Rebgv stats-pkg-december-2018Kathryn Huang
 
Real Estate Board of Greater Vancouver Statistics Package - November 2021
Real Estate Board of Greater Vancouver Statistics Package - November 2021Real Estate Board of Greater Vancouver Statistics Package - November 2021
Real Estate Board of Greater Vancouver Statistics Package - November 2021VickyAulakh1
 
Supply response emerges in Metro Vancouver’s active housing market
Supply response emerges in Metro Vancouver’s active housing marketSupply response emerges in Metro Vancouver’s active housing market
Supply response emerges in Metro Vancouver’s active housing marketAlexanderMackenzie13
 
REBGV Statistics Package April 2021
REBGV Statistics Package April 2021REBGV Statistics Package April 2021
REBGV Statistics Package April 2021Vicky Aulakh
 

Semelhante a October 2017 REBGV Stats Mike Stewart Vancouver Realtor (20)

October 2016 REBGV Statistics Package Vancouver BC Mike Stewart Realtor
October 2016 REBGV Statistics Package Vancouver BC Mike Stewart RealtorOctober 2016 REBGV Statistics Package Vancouver BC Mike Stewart Realtor
October 2016 REBGV Statistics Package Vancouver BC Mike Stewart Realtor
 
November 2017 rebgv stats mike stewart real estate agent
November 2017 rebgv stats mike stewart real estate agentNovember 2017 rebgv stats mike stewart real estate agent
November 2017 rebgv stats mike stewart real estate agent
 
Rebgv stats-pkg-september-2018
Rebgv stats-pkg-september-2018Rebgv stats-pkg-september-2018
Rebgv stats-pkg-september-2018
 
Rebgv stats-pkg-november-2020
Rebgv stats-pkg-november-2020Rebgv stats-pkg-november-2020
Rebgv stats-pkg-november-2020
 
Real Estate Board of Greater Vancouver Statistics Package November 2020
Real Estate Board of Greater Vancouver Statistics Package November 2020Real Estate Board of Greater Vancouver Statistics Package November 2020
Real Estate Board of Greater Vancouver Statistics Package November 2020
 
July 2017 Real Estate Board of Greater Vancouver Stats Package Mike Stewart r...
July 2017 Real Estate Board of Greater Vancouver Stats Package Mike Stewart r...July 2017 Real Estate Board of Greater Vancouver Stats Package Mike Stewart r...
July 2017 Real Estate Board of Greater Vancouver Stats Package Mike Stewart r...
 
REBGV Statistic Package December 2020
REBGV Statistic Package December 2020REBGV Statistic Package December 2020
REBGV Statistic Package December 2020
 
Real Estate Board of Greater Vancouver Statistics Package August 2021
Real Estate Board of Greater Vancouver Statistics Package August 2021Real Estate Board of Greater Vancouver Statistics Package August 2021
Real Estate Board of Greater Vancouver Statistics Package August 2021
 
Rebgv stats-pkg-august-2021
Rebgv stats-pkg-august-2021Rebgv stats-pkg-august-2021
Rebgv stats-pkg-august-2021
 
201807 rebgv-stats-package-for-media
201807 rebgv-stats-package-for-media201807 rebgv-stats-package-for-media
201807 rebgv-stats-package-for-media
 
Rebgv stats-pkg-february-2018
Rebgv stats-pkg-february-2018Rebgv stats-pkg-february-2018
Rebgv stats-pkg-february-2018
 
Rebgv stats-pkg-november-2018
Rebgv stats-pkg-november-2018Rebgv stats-pkg-november-2018
Rebgv stats-pkg-november-2018
 
Vancouver real estate stats package, August 2013
Vancouver real estate stats package, August 2013Vancouver real estate stats package, August 2013
Vancouver real estate stats package, August 2013
 
January 2016 rebgv stats mike stewart realtor Corrected Feb 5 2016
January 2016 rebgv stats mike stewart realtor Corrected Feb 5 2016January 2016 rebgv stats mike stewart realtor Corrected Feb 5 2016
January 2016 rebgv stats mike stewart realtor Corrected Feb 5 2016
 
Real Estate Board of Greater Vancouver Statistics Package March 2021
Real Estate Board of Greater Vancouver Statistics Package March 2021Real Estate Board of Greater Vancouver Statistics Package March 2021
Real Estate Board of Greater Vancouver Statistics Package March 2021
 
2018 dec-stats-pkg
2018 dec-stats-pkg2018 dec-stats-pkg
2018 dec-stats-pkg
 
Rebgv stats-pkg-december-2018
Rebgv stats-pkg-december-2018Rebgv stats-pkg-december-2018
Rebgv stats-pkg-december-2018
 
Real Estate Board of Greater Vancouver Statistics Package - November 2021
Real Estate Board of Greater Vancouver Statistics Package - November 2021Real Estate Board of Greater Vancouver Statistics Package - November 2021
Real Estate Board of Greater Vancouver Statistics Package - November 2021
 
Supply response emerges in Metro Vancouver’s active housing market
Supply response emerges in Metro Vancouver’s active housing marketSupply response emerges in Metro Vancouver’s active housing market
Supply response emerges in Metro Vancouver’s active housing market
 
REBGV Statistics Package April 2021
REBGV Statistics Package April 2021REBGV Statistics Package April 2021
REBGV Statistics Package April 2021
 

Mais de Mike Stewart

1_FINTRAC_clientinfo_2021.pdf
1_FINTRAC_clientinfo_2021.pdf1_FINTRAC_clientinfo_2021.pdf
1_FINTRAC_clientinfo_2021.pdfMike Stewart
 
Mike Stewart PREC Listing Contract
Mike Stewart PREC Listing ContractMike Stewart PREC Listing Contract
Mike Stewart PREC Listing ContractMike Stewart
 
REBGV September 2016 Stats Package Mike Stewart Vancouver Realtor
REBGV September 2016 Stats Package Mike Stewart Vancouver RealtorREBGV September 2016 Stats Package Mike Stewart Vancouver Realtor
REBGV September 2016 Stats Package Mike Stewart Vancouver RealtorMike Stewart
 
15% tax on international buyers in vancouver
15% tax on international buyers in vancouver15% tax on international buyers in vancouver
15% tax on international buyers in vancouverMike Stewart
 
REBGV Stats Package June 2016 Mike Stewart Vancouver Realtor
REBGV Stats Package June 2016 Mike Stewart Vancouver RealtorREBGV Stats Package June 2016 Mike Stewart Vancouver Realtor
REBGV Stats Package June 2016 Mike Stewart Vancouver RealtorMike Stewart
 
May 2016 Real Estate Board of Greater Vancouver Statistics Package
May 2016 Real Estate Board of Greater Vancouver Statistics PackageMay 2016 Real Estate Board of Greater Vancouver Statistics Package
May 2016 Real Estate Board of Greater Vancouver Statistics PackageMike Stewart
 
February 2016 REBGV Stats Mike Stewart Realtor
February 2016 REBGV Stats Mike Stewart RealtorFebruary 2016 REBGV Stats Mike Stewart Realtor
February 2016 REBGV Stats Mike Stewart RealtorMike Stewart
 
REBGV November 2015 Statistics Package Mike Stewart Realtor
REBGV November 2015 Statistics Package Mike Stewart RealtorREBGV November 2015 Statistics Package Mike Stewart Realtor
REBGV November 2015 Statistics Package Mike Stewart RealtorMike Stewart
 
October 2015 Vancouver Real Estate Board Statistics Package Mike Stewart Realtor
October 2015 Vancouver Real Estate Board Statistics Package Mike Stewart RealtorOctober 2015 Vancouver Real Estate Board Statistics Package Mike Stewart Realtor
October 2015 Vancouver Real Estate Board Statistics Package Mike Stewart RealtorMike Stewart
 
September 2015 rebgv statistics package mike stewart
September 2015 rebgv statistics package mike stewartSeptember 2015 rebgv statistics package mike stewart
September 2015 rebgv statistics package mike stewartMike Stewart
 
July 2015 rebgv stats package mike stewart
July 2015 rebgv stats package mike stewartJuly 2015 rebgv stats package mike stewart
July 2015 rebgv stats package mike stewartMike Stewart
 
June 2015 rebgv stats package mike stewart
June 2015 rebgv stats package mike stewartJune 2015 rebgv stats package mike stewart
June 2015 rebgv stats package mike stewartMike Stewart
 
REBGV Stats for December 2011 Courtesy Mike Stewart Vancouver Realtor
REBGV Stats for December 2011 Courtesy Mike Stewart Vancouver RealtorREBGV Stats for December 2011 Courtesy Mike Stewart Vancouver Realtor
REBGV Stats for December 2011 Courtesy Mike Stewart Vancouver RealtorMike Stewart
 
October 2011 REBGV Stats Mike Stewart
October 2011 REBGV Stats Mike StewartOctober 2011 REBGV Stats Mike Stewart
October 2011 REBGV Stats Mike StewartMike Stewart
 
REBGV Stats for Sept 2011 Mike Stewart
REBGV Stats for Sept 2011 Mike StewartREBGV Stats for Sept 2011 Mike Stewart
REBGV Stats for Sept 2011 Mike StewartMike Stewart
 

Mais de Mike Stewart (15)

1_FINTRAC_clientinfo_2021.pdf
1_FINTRAC_clientinfo_2021.pdf1_FINTRAC_clientinfo_2021.pdf
1_FINTRAC_clientinfo_2021.pdf
 
Mike Stewart PREC Listing Contract
Mike Stewart PREC Listing ContractMike Stewart PREC Listing Contract
Mike Stewart PREC Listing Contract
 
REBGV September 2016 Stats Package Mike Stewart Vancouver Realtor
REBGV September 2016 Stats Package Mike Stewart Vancouver RealtorREBGV September 2016 Stats Package Mike Stewart Vancouver Realtor
REBGV September 2016 Stats Package Mike Stewart Vancouver Realtor
 
15% tax on international buyers in vancouver
15% tax on international buyers in vancouver15% tax on international buyers in vancouver
15% tax on international buyers in vancouver
 
REBGV Stats Package June 2016 Mike Stewart Vancouver Realtor
REBGV Stats Package June 2016 Mike Stewart Vancouver RealtorREBGV Stats Package June 2016 Mike Stewart Vancouver Realtor
REBGV Stats Package June 2016 Mike Stewart Vancouver Realtor
 
May 2016 Real Estate Board of Greater Vancouver Statistics Package
May 2016 Real Estate Board of Greater Vancouver Statistics PackageMay 2016 Real Estate Board of Greater Vancouver Statistics Package
May 2016 Real Estate Board of Greater Vancouver Statistics Package
 
February 2016 REBGV Stats Mike Stewart Realtor
February 2016 REBGV Stats Mike Stewart RealtorFebruary 2016 REBGV Stats Mike Stewart Realtor
February 2016 REBGV Stats Mike Stewart Realtor
 
REBGV November 2015 Statistics Package Mike Stewart Realtor
REBGV November 2015 Statistics Package Mike Stewart RealtorREBGV November 2015 Statistics Package Mike Stewart Realtor
REBGV November 2015 Statistics Package Mike Stewart Realtor
 
October 2015 Vancouver Real Estate Board Statistics Package Mike Stewart Realtor
October 2015 Vancouver Real Estate Board Statistics Package Mike Stewart RealtorOctober 2015 Vancouver Real Estate Board Statistics Package Mike Stewart Realtor
October 2015 Vancouver Real Estate Board Statistics Package Mike Stewart Realtor
 
September 2015 rebgv statistics package mike stewart
September 2015 rebgv statistics package mike stewartSeptember 2015 rebgv statistics package mike stewart
September 2015 rebgv statistics package mike stewart
 
July 2015 rebgv stats package mike stewart
July 2015 rebgv stats package mike stewartJuly 2015 rebgv stats package mike stewart
July 2015 rebgv stats package mike stewart
 
June 2015 rebgv stats package mike stewart
June 2015 rebgv stats package mike stewartJune 2015 rebgv stats package mike stewart
June 2015 rebgv stats package mike stewart
 
REBGV Stats for December 2011 Courtesy Mike Stewart Vancouver Realtor
REBGV Stats for December 2011 Courtesy Mike Stewart Vancouver RealtorREBGV Stats for December 2011 Courtesy Mike Stewart Vancouver Realtor
REBGV Stats for December 2011 Courtesy Mike Stewart Vancouver Realtor
 
October 2011 REBGV Stats Mike Stewart
October 2011 REBGV Stats Mike StewartOctober 2011 REBGV Stats Mike Stewart
October 2011 REBGV Stats Mike Stewart
 
REBGV Stats for Sept 2011 Mike Stewart
REBGV Stats for Sept 2011 Mike StewartREBGV Stats for Sept 2011 Mike Stewart
REBGV Stats for Sept 2011 Mike Stewart
 

Último

Listing Turkey Green life Istanbul Eyup Catalog
Listing Turkey Green life Istanbul Eyup CatalogListing Turkey Green life Istanbul Eyup Catalog
Listing Turkey Green life Istanbul Eyup CatalogListing Turkey
 
Saheel ITREND Futura At Baner Annexe Pune - PDF.pdf
Saheel ITREND Futura At Baner Annexe Pune - PDF.pdfSaheel ITREND Futura At Baner Annexe Pune - PDF.pdf
Saheel ITREND Futura At Baner Annexe Pune - PDF.pdfmonikasharma630
 
It’s Time to Fight Back Against the Media Narrative Regarding Real Estate Com...
It’s Time to Fight Back Against the Media Narrative Regarding Real Estate Com...It’s Time to Fight Back Against the Media Narrative Regarding Real Estate Com...
It’s Time to Fight Back Against the Media Narrative Regarding Real Estate Com...Tom Blefko
 
Volition Meetup 2024 03 Mortgages & Interest Rates – Is The Worst Behind Us_ ...
Volition Meetup 2024 03 Mortgages & Interest Rates – Is The Worst Behind Us_ ...Volition Meetup 2024 03 Mortgages & Interest Rates – Is The Worst Behind Us_ ...
Volition Meetup 2024 03 Mortgages & Interest Rates – Is The Worst Behind Us_ ...Volition Properties
 
Managing Uncertainty: Newman George Leech's Real Estate Finance Strategy
Managing Uncertainty: Newman George Leech's Real Estate Finance StrategyManaging Uncertainty: Newman George Leech's Real Estate Finance Strategy
Managing Uncertainty: Newman George Leech's Real Estate Finance StrategyNewman George Leech
 
Pride Wonderland Dhanori Pune Brochure.pdf
Pride Wonderland Dhanori Pune Brochure.pdfPride Wonderland Dhanori Pune Brochure.pdf
Pride Wonderland Dhanori Pune Brochure.pdfabbu831446
 
Experion Elements Phase 1 Noida E-Brochure
Experion Elements Phase 1 Noida E-BrochureExperion Elements Phase 1 Noida E-Brochure
Experion Elements Phase 1 Noida E-BrochureRealEstate Info
 
Dubai Real Estate vs Other Global Markets-a-Comparative-Analysis
Dubai Real Estate vs Other Global Markets-a-Comparative-AnalysisDubai Real Estate vs Other Global Markets-a-Comparative-Analysis
Dubai Real Estate vs Other Global Markets-a-Comparative-AnalysisHomeStation1
 
LCAR Unit 21 - Closing the Real Estate Transaction - 14th Edition Revised
LCAR Unit 21 - Closing the Real Estate Transaction - 14th Edition RevisedLCAR Unit 21 - Closing the Real Estate Transaction - 14th Edition Revised
LCAR Unit 21 - Closing the Real Estate Transaction - 14th Edition RevisedTom Blefko
 
Listing Turkey - Viva Perla Maltepe Catalog
Listing Turkey - Viva Perla Maltepe CatalogListing Turkey - Viva Perla Maltepe Catalog
Listing Turkey - Viva Perla Maltepe CatalogListing Turkey
 
LCAR RE Practice - The Power of Your Database
LCAR RE Practice - The Power of Your DatabaseLCAR RE Practice - The Power of Your Database
LCAR RE Practice - The Power of Your DatabaseTom Blefko
 
Clemson Engineering Consultant Dubai For Innovative and Sustainable Engineeri...
Clemson Engineering Consultant Dubai For Innovative and Sustainable Engineeri...Clemson Engineering Consultant Dubai For Innovative and Sustainable Engineeri...
Clemson Engineering Consultant Dubai For Innovative and Sustainable Engineeri...Clemson Engineering Consultant
 
Prestige Sanctuary Nandi Hills Bangalore.pdf
Prestige Sanctuary Nandi Hills Bangalore.pdfPrestige Sanctuary Nandi Hills Bangalore.pdf
Prestige Sanctuary Nandi Hills Bangalore.pdfashiyadav24
 
Kolte Patil Mirabilis at Horamavu Road, Bangalore E brochure.pdf
Kolte Patil Mirabilis at Horamavu Road, Bangalore E brochure.pdfKolte Patil Mirabilis at Horamavu Road, Bangalore E brochure.pdf
Kolte Patil Mirabilis at Horamavu Road, Bangalore E brochure.pdfAhanundefined
 
Lancaster Market Expenses and Company Worksheet
Lancaster Market Expenses and Company WorksheetLancaster Market Expenses and Company Worksheet
Lancaster Market Expenses and Company WorksheetTom Blefko
 
LCAR Unit 19 - Financing the Real Estate Transaction - 14th Edition Revised
LCAR Unit 19 - Financing the Real Estate Transaction - 14th Edition RevisedLCAR Unit 19 - Financing the Real Estate Transaction - 14th Edition Revised
LCAR Unit 19 - Financing the Real Estate Transaction - 14th Edition RevisedTom Blefko
 
Kolte Patil Universe Hinjewadi Pune Brochure.pdf
Kolte Patil Universe Hinjewadi Pune Brochure.pdfKolte Patil Universe Hinjewadi Pune Brochure.pdf
Kolte Patil Universe Hinjewadi Pune Brochure.pdfPrachiRudram
 
Radiance Majestic Valasaravakkam Chennai.pdf
Radiance Majestic Valasaravakkam Chennai.pdfRadiance Majestic Valasaravakkam Chennai.pdf
Radiance Majestic Valasaravakkam Chennai.pdfashiyadav24
 
Maha Mauka Squarefeet Brochure |Maha Mauka Squarefeet PDF Brochure|
Maha Mauka Squarefeet Brochure |Maha Mauka Squarefeet PDF Brochure|Maha Mauka Squarefeet Brochure |Maha Mauka Squarefeet PDF Brochure|
Maha Mauka Squarefeet Brochure |Maha Mauka Squarefeet PDF Brochure|AkshayJoshi575980
 
What is Affordable Housing? Bristol Civic Society April 2024
What is Affordable Housing? Bristol Civic Society April 2024What is Affordable Housing? Bristol Civic Society April 2024
What is Affordable Housing? Bristol Civic Society April 2024Paul Smith
 

Último (20)

Listing Turkey Green life Istanbul Eyup Catalog
Listing Turkey Green life Istanbul Eyup CatalogListing Turkey Green life Istanbul Eyup Catalog
Listing Turkey Green life Istanbul Eyup Catalog
 
Saheel ITREND Futura At Baner Annexe Pune - PDF.pdf
Saheel ITREND Futura At Baner Annexe Pune - PDF.pdfSaheel ITREND Futura At Baner Annexe Pune - PDF.pdf
Saheel ITREND Futura At Baner Annexe Pune - PDF.pdf
 
It’s Time to Fight Back Against the Media Narrative Regarding Real Estate Com...
It’s Time to Fight Back Against the Media Narrative Regarding Real Estate Com...It’s Time to Fight Back Against the Media Narrative Regarding Real Estate Com...
It’s Time to Fight Back Against the Media Narrative Regarding Real Estate Com...
 
Volition Meetup 2024 03 Mortgages & Interest Rates – Is The Worst Behind Us_ ...
Volition Meetup 2024 03 Mortgages & Interest Rates – Is The Worst Behind Us_ ...Volition Meetup 2024 03 Mortgages & Interest Rates – Is The Worst Behind Us_ ...
Volition Meetup 2024 03 Mortgages & Interest Rates – Is The Worst Behind Us_ ...
 
Managing Uncertainty: Newman George Leech's Real Estate Finance Strategy
Managing Uncertainty: Newman George Leech's Real Estate Finance StrategyManaging Uncertainty: Newman George Leech's Real Estate Finance Strategy
Managing Uncertainty: Newman George Leech's Real Estate Finance Strategy
 
Pride Wonderland Dhanori Pune Brochure.pdf
Pride Wonderland Dhanori Pune Brochure.pdfPride Wonderland Dhanori Pune Brochure.pdf
Pride Wonderland Dhanori Pune Brochure.pdf
 
Experion Elements Phase 1 Noida E-Brochure
Experion Elements Phase 1 Noida E-BrochureExperion Elements Phase 1 Noida E-Brochure
Experion Elements Phase 1 Noida E-Brochure
 
Dubai Real Estate vs Other Global Markets-a-Comparative-Analysis
Dubai Real Estate vs Other Global Markets-a-Comparative-AnalysisDubai Real Estate vs Other Global Markets-a-Comparative-Analysis
Dubai Real Estate vs Other Global Markets-a-Comparative-Analysis
 
LCAR Unit 21 - Closing the Real Estate Transaction - 14th Edition Revised
LCAR Unit 21 - Closing the Real Estate Transaction - 14th Edition RevisedLCAR Unit 21 - Closing the Real Estate Transaction - 14th Edition Revised
LCAR Unit 21 - Closing the Real Estate Transaction - 14th Edition Revised
 
Listing Turkey - Viva Perla Maltepe Catalog
Listing Turkey - Viva Perla Maltepe CatalogListing Turkey - Viva Perla Maltepe Catalog
Listing Turkey - Viva Perla Maltepe Catalog
 
LCAR RE Practice - The Power of Your Database
LCAR RE Practice - The Power of Your DatabaseLCAR RE Practice - The Power of Your Database
LCAR RE Practice - The Power of Your Database
 
Clemson Engineering Consultant Dubai For Innovative and Sustainable Engineeri...
Clemson Engineering Consultant Dubai For Innovative and Sustainable Engineeri...Clemson Engineering Consultant Dubai For Innovative and Sustainable Engineeri...
Clemson Engineering Consultant Dubai For Innovative and Sustainable Engineeri...
 
Prestige Sanctuary Nandi Hills Bangalore.pdf
Prestige Sanctuary Nandi Hills Bangalore.pdfPrestige Sanctuary Nandi Hills Bangalore.pdf
Prestige Sanctuary Nandi Hills Bangalore.pdf
 
Kolte Patil Mirabilis at Horamavu Road, Bangalore E brochure.pdf
Kolte Patil Mirabilis at Horamavu Road, Bangalore E brochure.pdfKolte Patil Mirabilis at Horamavu Road, Bangalore E brochure.pdf
Kolte Patil Mirabilis at Horamavu Road, Bangalore E brochure.pdf
 
Lancaster Market Expenses and Company Worksheet
Lancaster Market Expenses and Company WorksheetLancaster Market Expenses and Company Worksheet
Lancaster Market Expenses and Company Worksheet
 
LCAR Unit 19 - Financing the Real Estate Transaction - 14th Edition Revised
LCAR Unit 19 - Financing the Real Estate Transaction - 14th Edition RevisedLCAR Unit 19 - Financing the Real Estate Transaction - 14th Edition Revised
LCAR Unit 19 - Financing the Real Estate Transaction - 14th Edition Revised
 
Kolte Patil Universe Hinjewadi Pune Brochure.pdf
Kolte Patil Universe Hinjewadi Pune Brochure.pdfKolte Patil Universe Hinjewadi Pune Brochure.pdf
Kolte Patil Universe Hinjewadi Pune Brochure.pdf
 
Radiance Majestic Valasaravakkam Chennai.pdf
Radiance Majestic Valasaravakkam Chennai.pdfRadiance Majestic Valasaravakkam Chennai.pdf
Radiance Majestic Valasaravakkam Chennai.pdf
 
Maha Mauka Squarefeet Brochure |Maha Mauka Squarefeet PDF Brochure|
Maha Mauka Squarefeet Brochure |Maha Mauka Squarefeet PDF Brochure|Maha Mauka Squarefeet Brochure |Maha Mauka Squarefeet PDF Brochure|
Maha Mauka Squarefeet Brochure |Maha Mauka Squarefeet PDF Brochure|
 
What is Affordable Housing? Bristol Civic Society April 2024
What is Affordable Housing? Bristol Civic Society April 2024What is Affordable Housing? Bristol Civic Society April 2024
What is Affordable Housing? Bristol Civic Society April 2024
 

October 2017 REBGV Stats Mike Stewart Vancouver Realtor