SlideShare uma empresa Scribd logo
1 de 50
Baixar para ler offline
Understand first, then be understood
How clearly do you understand the story? Does
the information make sense? Is it logical and
believable? What is the context? For example, is
the story about an increase in medical errors?
Consider this:
Illinois has 1,000 medical errors this
year. Rhode Island has 500. Does that
mean medical errors are more likely to
occur in Illinois?
Illinois has 10 million medical
procedures performed annually while
Rhode Island has 2 million procedures
performed annually. Illinois’ error rate
is 1,000/10,000,000 (or 1 in 10,000) and
Rhode Island’s error rate is 500/2,000,000
(or 1 in 4,000).
In fact, the error rate for Rhode Island
is higher than that for Illinois.
Vet and scrutinize the information
Is the information reliable? Do you know the
source and/or the motivation the source has for
supplying the information? Are there holes in the
data? Are there odd trends, such as a big jump in
numbers for no apparent reason?
It’s vital that our readers trust our scrutiny of the
data and believe we have presented it faithfully.
We should walk away from graphics that lack the
data integrity we require.
Ask more sophisticated questions to make better
graphics. Going back to the medical error exam-
ple, consider this:
Is a 100% increase in medical errors the
result of one additional medical error,
or the result of many errors across the
country? Does the increase represent a
significant increase in errors, or has the
error rate gone from one medical error
committed last year to two medical
errors committed this year? Can you
show where errors are occurring? Is
there a geographic pocket where they
occur more often?
Have a point
Think clearly about the purpose of this graphic.
Some graphics reconstruct tangible images, such
as a medical experiment or building layout. Oth-
ers illustrate the intangible, such as a budget or a
health plan merger. Ask, what exactly do I want
the reader to get from this graphic? You should be
able to express the answer in one short sentence: I
want viewers to see that Medicare pay has been
slashed by 25%. Or, that medical errors are most-
ly occurring at hospitals in rural areas.
Run through seven important questions:
n Can we show meaningful
comparisons?
n Can we offer guidance or tips?
n Can we break it down to provide
more context?
n Does the trend tell the story?
n How can we show what words alone
can’t easily explain?
Graphic
handbook
AMERICAN MEDICAL NEWS
How to make a
quality graphic
Secondary items that represent data are
an essential part of the paper and should
receive the same scrutiny as stories. If it
involves the explanation or presentation
of any sort of data, here are some tips to
help it be the best graphic it can be.
n Seven questions to ask yourself
when creating a graphic
n The proofing process
n Math concepts every
journalist should know
PAGE 1
n Can we forecast or handicap an issue?
n Does the reader need highlights?
Talk with others
Think about these things, but don’t be alone in the
process. It is critical that reporters, editors and
art directors sit down and talk about a
graphic as it is starting to take shape.
Maestro-type discussions should occur. They
don’t need to be long. Some may take five minutes
or less.
The conversation with the art director will help
clarify the visual process, and make sure you are
presenting the most essential information
and balancing the needs of the story with the
needs of the secondary elements.
Turn in clean copy
When you request a graphic, provide all the
information necessary for its completion. Too
much information is better than not enough. If
your story cites a trend, and the accompanying
graphic only has information for this year and the
last — well, suffice it to say that two numbers
do not a trend make.
Also consider this:
n Spell-check.
n Double-check numbers against the
original source.
n Add numbers to make sure all rows
and columns add up as they should.
n Treat the graphic the way you would
treat a story.
Remember: Deadlines, deadlines,
deadlines
To create a well-thought-out visual presentation,
all the information has to be available to the art
director in a timely fashion. During the planning
process with the topic editor and art director, a
deadline will be set based on the complexity of the
graphic. But generally, you should plan to
file your graphic well before you file the story
so the art department has time to work on it and
can provide guidance on available space. If the
information gets to the art department late, the
graphics suffer.
How to make a
quality graphic
Secondary items that represent data are
an essential part of the paper and should
receive the same scrutiny as stories. If it
involves the explanation or presentation
of any sort of data, here are some tips to
help it be the best graphic it can be.
n Seven questions to ask yourself
when creating a graphic
n The proofing process
n Math concepts every
journalist should know
PAGE 2
Graphic
handbook
AMERICAN MEDICAL NEWS
Seven questions to ask
yourself when creating
a graphic
A graphic should answer one of these
important questions. The editor also
should be asking these questions of the
reporter to decide which type of graphic
will aid the telling of a specific story.
Stories will be measured against this list
during maestros and front page discus-
sions, so be prepared.
n How to make a quality graphic
n The proofing process
n Math concepts every
journalist should know
1. Can we show meaningful comparisons?
Comparisons allow quick and easy scrutiny of
related bits of information. Pro/con boxes and
tables pairing data across specialties or regions
are naturals for this treatment. While other types
of boxes allow comparisons, paired data is the
primary device we use to draw connections for
the reader, based on how the cells of the chart are
configured.
n Would an advantage/disadvantage
box be helpful?
n Are there two views on an issue,
such as pro/con?
n Do the data compare clinical
measures?
n Can we compare geographically?
n Can we compare by specialty?
n Can company-to-company or product-
to-product comparisons be made?
2. Can we offer guidance or tips?
Specificity directly impacts usefulness. When ex-
pert guidance is vague, the reader isn’t left with
much to act on. These boxes work best as the
marching orders with a story of anecdotes and ex-
pert commentary. Essential for successful “how-
to” features.
n Is there a “how to”?
n Does another organization have
policies our readers can learn from or
implement?
n Are there guidelines to follow?
n Is there list of considerations that
would help physicians make a decision?
3. Can we break it down to
provide more context?
When it’s important to offer greater context than
the story’s narrative structure will allow, data-
driven treatment can be helpful. The story may
focus on the five states leading the charge on a
particular issue, while an accompanying map
shows what the other 45 are doing. This device is
what we use when it’s worth our readers time to
know how every slice of the pie measures up. As a
national publication with a multispecialty
readership, this is a key element for our
storytelling.
n Can the story address the human
side while the graphics address the
numbers?
n Can you go beyond the summary
numbers in a study?
n Do national data provide needed
context for the story?
n Is there something you’ll touch on
broadly that can be detailed in a
graphic?
n What is more important — the
percentage of people who fall into a
category or the raw number?
4. Does the trend tell the story?
A trend chart is intended to speak primarily to
changes that happen over time. In some of the
more complex trend charts, there may be
comparisons among specialties or regions within
the plotting, but this more elaborate handling
should still underscore a relevant behavior over
time. Be aware, though, that in many instances,
PAGE 3
Graphic
handbook
AMERICAN MEDICAL NEWS
specific details of the data will be lost in the
plotting. For example: A bar measuring 6.3% will
look very similar to a bar measuring 6.6%. If that
level of precision must be maintained, we often
handle the data as a table. The trend is a little
harder to detect, but we maintain the nuance that
some data sets require.
n Can we show the progress of one
variable over a long time?
n Is the trend as important as the
comparison between variables, such as
states, specialties or demographics?
n Can we show how the gains of one
variable impact the losses of another?
n Can we add explanations to provide
context for trends?
5. Can we show what words alone can’t
easily explain?
A formula or process presented visually can
provide a clearer understanding than a narrative
explanation. Flow charts or architectural/
environmental image packages fall into this
category. It is difficult to estimate a final size for
this graphic element, so good advance planning is
essential, both to set a realistic story length and to
clarify what should be handled in text and what is
addressed graphically.
n Are there floor plans, diagrams or
before/after visuals that bring an
essential aspect to the story?
n Is there a mathematical or scientific
formula we can show physicians in its
pure form?
n Is there an example to show, perhaps
with commentary? For example,
instead of describing the components
of a tax form, can you show a sample of a
finalized form?
6. Can we forecast or handicap an issue?
This is a difficult treatment to pull off, but if our
research or access to expertise can lead to a
secondary element that quickly handicaps an issue
or the players involved, it can be a potent offering.
As with tips boxes, specificity is important. The
story can handle nuances at greater length while
the box gives the scorecard.
n Are there projections of things to watch
that indicate what could happen on an
issue in the future?
n Is there a “to-watch” list of people?
7. Does the reader need the highlights?
These often come in the form of a bullet box citing
significant facts from a report or news event. Be
mindful of how much the content overlaps with the
story and limit the bulleted points to the most
essential or compelling.
n Can a policy/bill/case be
summarized?
n Can a complicated issue be broken
down and laid out in a way that makes it
easy for the reader to understand?
n Is there a bio box on the person we are
focusing on in the story?
Seven questions to ask
yourself when creating
a graphic
When any graphic is presented, it should
answer one of these important questions.
If a story lacks a graphic and its omission
is not due to space, the editor should be
asking these questions of the reporter to
decide which type of graphic will aid the
storytelling. For maestros and front page
discussions, stories will be measured
against this list, so be prepared.
n How to make a quality graphic
n The proofing process
n Math concepts every
journalist should know
PAGE 4
Graphic
handbook
AMERICAN MEDICAL NEWS
Reporting that more
businesses are
showing interest in
preventive medicine
programs, this feature
targets physicians who
might take advantage
of the trend by sharing
the experiences of
those who are doing it
now. To accompany
another useful graphic,
which outlines how
to make a wellness
program work, this paired data graphic is an
important jump-page device to entice skimming
readers into the story. By delivering simple
comparisons in a familiar advantage/disadvan-
tage format, the graphic acts as a box score.
Interested readers will turn to the story for more
information while those who have read the story
will have a handy reminder of the business
models discussed.
PAGE 5
FOCUS ON PREVENTIVE MEDICINE
Wellness programs come in many shapes and sizes, presenting a wide array of business
opportunities for physicians. Here are descriptions of a few models:
Contracted services
An individual
physician offers services
to a hospital that has
created a wellness
clinic.
You can tailor your own offerings
and develop your practice accord-
ing to how many wellness patients
you want to see.
The partnering company handles
marketing, billing and other
services geared to get the wellness
business off the ground.
You can maintain your own prac-
tice while working with wellness
patients for a few hours each week.
You also don’t have to worry about
marketing the business.
You have to do your own sales
and marketing.
Your schedule is subject to
how busy the wellness clinic
becomes, and you don’t have as
much control as you would if
you ran the clinic yourself.
You have less control over
clinic operations and have to
pay a management fee. You may
not have the space necessary to
accommodate a partnership
clinic, or you might have to
renovate your current space.
Partnership with a
management
company
Developing business-
es offers turnkey
services to physicians
and hospitals for a
management fee.
ADVANTAGESMODEL DISADVANTAGES
Wellness practice
A physician group
offers wellness services
to local businesses.
1
Can we show
meaningful
comparisons?
F
or an afternoon every week
or two, internist Richard Hilde-
brand, MD, practices medicine in
a way that would make most physi-
cians jealous.
As medical director at the Center
for Preventive Medicine, part of St.
Luke’s Health System in Sioux City,
Iowa, Dr. Hildebrand spends two or
three hours with the same patient. He
focuses not on acute illnesses, but on
wellness. He puts the patient through
a series of tests, and actually has time
to go over results with him or her
once they’re completed.
“Over time — and I hate to speak
for everybody — we’ve gotten used to
the appointments every 10 or 20 min-
utes,” Dr. Hildebrand said. “This is a
nice combination of very old-fash-
ioned, but very high-tech. It makes a
lot of sense.”
Employers think so, too. More com-
panies are joining in the wellness
trend, sponsoring pre-
ventive health pro-
grams and asking — or,
in some cases, requir-
ing — their employees
to enroll. Programs
range from one-dimen-
sional, single-issue pro-
grams such as smoking cessation to di-
verse, multipurpose strategies that
look at a person’s overall health.
Sensing a business opportunity,
some physicians are starting to adapt
their practices to fit this trend as well.
Some are providing contracted ser-
vices to hospitals, while others are tai-
loring wellness programs and market-
ing them directly to local businesses.
A few doctors even are partnering
with fledgling businesses providing
turnkey-style support or other ser-
vices to help them get their wellness
practices off the ground.
Regardless of the size of the busi-
ness or practice, they have a straight-
forward sales pitch to employers:
wellness programs will save busi-
nesses money.
“It saves on insurance costs, and
we’ve seen amazing successes in sav-
ing people’s jobs from things like ad-
dictions, surgeries and life stresses,”
said Lee Rice, DO, a family physician
and sports medicine specialist in San
Diego. Dr. Rice is also CEO and med-
ical director of Lifewellness Institute,
a preventive medicine practice. “Busi-
nesses see employees as their most im-
portant asset, and they want their em-
ployees to know it,” Dr. Rice said.
Employers see corporate wellness
programs as a way to both control
health care costs and boost key em-
ployees’ productivity. The theory is a
AMERICAN MEDICAL NEWS AMEDNEWS.COM JUNE 5, 2006
17
BusinessPRACTICE MANAGEMENT n PERSONAL FINANCE n TECHNOLOGY
Physicians score victory in class-action compliance settlement [ PAGE 19 ]
Businesses are
showing more
interest in
preventive medicine
programs, providing
a new business
opportunity for
physicians.
Wellnessgoes to
work
MAKING
WELLNESS
WORK
A 2005 Hewitt Associates
survey says employers
are developing more of
an interest in corporate
wellness programs. Here
are some reasons why:
n Insurance expenses are
rising.
n Healthy employees are
more productive and
miss less work time.
n It’s a cost-effective way
to prove to employees
that the company cares
for their well-being.
Here are some condi-
tions that can make
wellness programs a
good business opportuni-
ty for physicians:
POPULATION
More densely populated
areas could provide a
large enough pool of
people interested in
wellness.
NUMBER OF BUSINESSES
The more corporate
clients you can sign up,
the greater percentage
of your practice you
dedicate to wellness.
TYPES OF BUSINESSES
Large manufacturing
facilities might not find
all-inclusive programs to
be cost-effective, but they
could contract for single
services, such as nutri-
tional counseling or
tobacco cessation. Small,
self-insured, white-collar
businesses, meanwhile,
may be interested in
comprehensive care.
CONTACT WITH DECISION
MAKERS
If you belong to a local
club or know local busi-
ness CEOs through work
or business circles, you
might have a better
chance of marketing
your wellness services
and landing corporate
clients.
Continued on next page
Richard Hildebrand, MD
Story by
Mike Norbut
Photo by
Greg Latza
n Allows physicians to spot areas that need improvement and lets
them use the knowledge to make changes.
n Lets payers reward physicians who perform better with more
referrals and bonus pay.
n Empowers consumers to choose physicians on the basis of both
quality and cost, particularly with the number of patients using
health savings accounts at 3.2 million and growing. Increased
competition for patients will lead to overall quality improvement.
n Quality measurement can be inaccurate if it is based on admin-
istrative claims data that do not capture the entirety of a patient’s
circumstances.
n Compliance can be costly. Either a practice must do timely,
expensive chart reviews or spend heavily on electronic medical
record systems.
n Quality measures can unfairly represent physicians’
performance. For example, outcome-based measures can penalize
physicians who see patients who are sicker or face economic,
cultural and linguistic barriers to complying with doctors’ orders.
n When paired with pay-for-performance, quality measurement
could merely reward larger practices that have made costly
technology investments and practices in higher-income areas.
Perversely, quality measurement could divert resources away
from already underserved areas.
PAGE 6
ASSESSING QUALITY
The era of measuring physician performance is likely here to
stay. Drawn from a range of perspectives, experts say these are
some of the pros and cons of quality measurement.
PROS
CONS
The headline sums up this story well: Quality quandary.
Performance measures have doctors up in arms. Some
physicians can see benefits if it is done right. Other physicians
say the entire idea is flawed. The story focuses on the issue of
physicians being worried that quality measures could leave
behind the sickest and most vulnerable patients because
doctors don’t want to be dinged on quality measures for
patients they know won’t improve. The pro/con box that
accompanies the story takes a bigger look at the pay-for-
performance issue and sums up doctors’ likes and dislikes
about being assessed for quality.
It sums up concerns in many areas,
not just the issue of patient care.
1
Can we show
meaningful
comparisons?
MAY 22/29, 2006 AMEDNEWS.COM AMERICAN MEDICAL NEWS
12
Professional Issues
FSMB data show modest dip in disciplinary actions [ PAGE 15 ]
HEALTH CARE LITIGATION n MEDICAL EDUCATION n ETHICS n PROFESSIONAL REGULATION
C
an a number tell the world how good a doctor is? A lot
of people are counting on it. The government, health
plans and employers are demanding a way to quantify
the value they’re getting for their health care dollars.
Patients, faced with higher co-pays and deductibles and
increasingly invested in health savings accounts, want
reliable public ratings of doctors’ performance.
Only a third of physicians have access to any data about
their own clinical performance, and just a quarter have
the electronic medical records systems considered essen-
tial for continuous quality improvement, according to a
2003 Commonwealth Fund survey of doctors. Still, a small
but growing number of physicians who have assessed the
quality of care they deliver as part of maintenance-of-certi-
fication and pay-for-performance programs see quality
measurement as helpful to care better for their patients.
But many physicians, embittered by early and clumsy
attempts by outsiders to gauge their performance, have
deep concerns about the accuracy and fairness of quality
measurement. With more than 100 pay-for-performance
programs up and running, according to the Leapfrog
Group, and the Centers for Medicare & Medicaid Services
asking physicians to voluntarily report quality data, it
seems quality measurement is here to stay.
Yet as physician groups take over the reins in develop-
ing quality measures for payers and the public to use, a
quandary presents itself: Could attempts to improve quality
by measuring it have the perverse effect of punishing doc-
tors who care for the most vulnerable patient populations?
Skeptical doctors say the medical experts, academicians,
methodologists and statisticians charged with developing
quality measures must be mindful of their potential impact
on practicing physicians and the patients they serve.
Concerns about patient outcomes
R
andall Maxey, MD, PhD, approves of the quality mea-
surement idea in general but worries about whether
its use could wind up penalizing physicians who prac-
tice in underserved areas. While most measures gauge
how often physicians deliver clinically recommended
care, a few very important ones hold doctors accountable
for their patients’ outcomes.
“It’s going to be a lot easier to treat a little old lady from
Beverly Hills,” said Dr. Maxey, an Inglewood, Calif.,
nephrologist who co-chairs the Commission to End Health
Care Disparities and a National Medical Assn. former
president. “Some communities are more compliant and
more health-literate and have more resources to influence
outcomes than others. I may treat you exactly correctly
and give you the right pills, but if you have to choose be-
tween buying pills and giving your baby milk, that drug
may lose out and my performance may be judged as poor
because of it.”
Roy M. Poses, MD, shares Dr. Maxey’s concern.
Qquandary
Quality
PHOTO©JOHNFORASTÉ
ASSESSING
QUALITY
The era of measuring physi-
cian performance is likely
here to stay. Drawn from
a range of perspectives,
experts say these are some of
the pros and cons of quality
measurement.
PROS
n Allows physicians to spot
areas that need improvement
and lets them use the
knowledge to make changes.
n Lets payers reward
physicians who perform
better with more referrals
and bonus pay.
n Empowers consumers to
choose physicians on the
basis of both quality and
cost, particularly with the
number of patients using
health savings accounts at
3.2 million and growing.
Increased competition for
patients will lead to overall
quality improvement.
n Quality measurement can
be inaccurate if it is based on
administrative claims data
that do not capture the
entirety of a patient’s
circumstances.
n Compliance can be costly.
Either a practice must do
timely, expensive chart
reviews or spend heavily on
electronic medical record
systems.
n Quality measures can
unfairly represent
physicians’ performance.
For example, outcome-based
measures can penalize
physicians who see patients
who are sicker or face
economic, cultural and
linguistic barriers to
complying with doctors’
orders.
n When paired with pay-
for-performance, quality
measurement could merely
reward larger practices that
have made costly technology
investments and practices
in higher-income areas.
Perversely, quality measure-
ment could divert resources
away from already under-
served areas.
CONS
As the movement to
measure quality forges
ahead, some physicians
worry their patients
could be left behind.
Story by Kevin B. O’Reilly
Outcome-based measurements need to control for patient characteristics, said internist Roy M. Poses, MD.
PAGE 7
To bring greater clarity to a story
about the link between quality and
volume in nonsurgical care, this
graphic presented valuable data for
comparison. It is based on a study of
pneumonia patients, and in a simple
manner, lays out key findings for
four levels of patient volume. A few
key findings are explained to set up
the top of the story, but it’s the
graphic that carries the essential
details.
1
Can we show
meaningful
comparisons?
n Doctors say the decision
opens the door for “junk
science.”
AMY LYNN SORREL
AMNEWS STAFF
If a New York appeals court ruling
that loosened rules for expert witness
testimony allowed in medical liability
cases stands, physicians say it will
open the gate for unreliable scientific
evidence to enter the courtroom.
In a unanimous opinion, the Appel-
late Division of the Supreme Court,
the state’s intermediate level, said ex-
perts did not need to show peer-re-
viewed medical literature to prove
that their medical opinion was accept-
ed in the scientific community.
Judges found that a lower court ap-
plied the testimony rule “too restric-
tively” when it wouldn’t allow the tes-
timony and dismissed the case.
Physicians say the appeals court
ruling defies state precedent uphold-
ing rigorous scrutiny of what testimo-
ny is permitted to be heard by jurors.
If the courts don’t adhere to the stan-
dard, physicians say, ripple effects
could cause meritless lawsuits to en-
ter the legal system.
Lawyers for the physician in the
case are asking the appeals court to
reconsider. If that doesn’t happen,
they will ask the state’s high court to
overturn the ruling. The medical com-
munity has weighed in on the physi-
cian’s side, with doctors and a phar-
maceutical company fearing that the
ruling would be used as an example
for other courts to relax the rule if it’s
not reversed.
“There should be a high standard,
and it’s up to the courts to make sure
that any medical theory being [pre-
sented] actually has the support of the
profession,” said Donald Moy, general
counsel to the Medical Society of the
State of New York, which filed a
friend-of-the-court brief with the
American Medical Association and
Pfizer. The company didn’t manufac-
ture the drug in the lawsuit but does
not want to see a precedent set.
Allowing only peer-reviewed liter-
ature is critical, Moy explained, be-
cause it is often difficult for a jury to
differentiate between credible science
and “junk science.”
Mary Beth Ott, who represents the
plaintiff, said the appeals court ruling
is correct, “and that’s the law as it
stands now.” Ott declined to comment
further, citing the pending litigation.
Did a drug trigger a disease?
The case, Zito v. Zabarsky, stems from
a November 2003 trial court hearing
to screen expert witness testimony.
New York courts require the testimo-
ny with the plaintiff’s filing of a med-
ical liability case to determine the va-
lidity of claims made. Judges follow
the Frye standard, derived from a 1923
federal ruling that established that
novel scientific evidence presented in
court must “have gained general ac-
ceptance” in the relevant scientific
community.
Pamela Zito sued Queens internist
Gary Zabarsky, MD, alleging that he
had prescribed her an “excessive”
dose of the cholesterol drug, Zocor
(simvastatin), which caused her to de-
velop an autoimmune disease, court
records show. Dr. Zabarsky denies the
n For diseases such as pneumonia, higher
patient volume could mean worse
physician performance.
KEVIN B. O’REILLY
AMNEWS STAFF
Practice makes perfect? Not always. That’s the find-
ing of a recent study that sought to find out whether
physicians who cared for a higher volume of pneu-
monia patients in a given year were more likely
to follow quality guidelines and achieve superior
outcomes.
Hundreds of studies have used patient volume as
a proxy in quality measurement for high-risk surgi-
cal procedures, such as coronary bypass artery
graft or care for complex diseases such as
HIV/AIDS. Nearly 70% of studies examining physi-
cian performance in those areas found a statistical-
ly significant association between higher patient
volume and superior outcomes, according to a 2002
medical literature review published in the Annals
of Internal Medicine.
But the much-touted volume-outcome correla-
tion appears to fall apart for care such as pneumo-
nia, according to a study published in the Feb. 21
Annals of Internal Medicine.
The evaluation of 9,741 doctors who cared for
AMERICAN MEDICAL NEWS AMEDNEWS.COM MAY 1, 2006
11
Professional IssuesHEALTH CARE LITIGATION n MEDICAL EDUCATION n ETHICS n PROFESSIONAL REGULATION
ETHICS FORUM: Apply standards of care equitably [ PAGE 16 ]
Volume-quality correlation
not clear cut, study says
Continued on page 14
Court lowers bar on scientific evidence
CASE AT A GLANCE
Pamela Zito v. Gary Zabarsky, MD
Venue: New York Supreme
Court, Appellate Division,
Second Department
At issue: Whether medical
expert testimony required in
medical liability cases must
include peer-reviewed literature
to show that an opinion is
generally accepted by the
scientific community. The
appeals court said no.
Potential impact: Physicians
say the ruling goes against
precedent, exposing doctors to
more lawsuits. The court said a
high standard deprives injured
plaintiffs of their day in court.
Continued on next page
New York appeals court ruling
“It’s up to the courts to
make sure any medical
theory ... has support of
the profession.”
Donald Moy, MSSNY general counsel
DISCOUNTING VOLUME
Hundreds of studies have found that for complicated surgeries and medical care such as coronary
artery bypass grafting or HIV/AIDS care, the higher the volume of cases a physician or hospital sees,
the better the outcomes. But for care such as pneumonia, the relationship between the volume of cas-
es and physician performance isn’t so clear, according to a recent study of 9,741
doctors who cared for 13,480 patients admitted to hospitals for pneumonia. The study’s authors broke
physicians into four groups based on the volume of pneumonia patients they cared for over a year.
Here are some of the results:
Study groups: 1 2 3 4
Median annual pneumonia cases 4 9 15 29
per physician
Percentage of time task performed
First antibiotic administered less 59% 63% 62% 62%
than four hours after admission
Appropriate antibiotics 82% 81% 81% 79%
Blood cultures obtained before 84% 84% 84% 83%
administration of antibiotics
Screened for or given influenza vaccine 21% 19% 20% 12%
Screened for or given pneumococcal vaccine 16% 13% 13% 9%
Results
Mean length of stay (in days) 6.0 6.0 6.2 6.6
Percentage of patients who died 5.8% 6.0% 5.7% 6.6%
in the hospital
Percentage of patients who died 10.9% 11.8% 11.0% 12.5%
within 30 days
SOURCE: “VOLUME, QUALITY OF CARE, AND OUTCOME IN PNEUMONIA,” ANNALS OF INTERNAL MEDICINE, FEB. 21
VOLUME
OF CASES
QUALITY
INDICATOR
OUTCOMES
DISCOUNTING VOLUME
Hundreds of studies have found that for complicated surgeries and medical care such as coronary
artery bypass grafting or HIV/AIDS care, the higher the volume of cases a physician or hospital sees,
the better the outcomes. But for care such as pneumonia, the relationship between the volume of
cases and physician performance isn’t so clear, according to a recent study of 9,741 doctors who
cared for 13,480 patients admitted to hospitals for pneumonia. The study’s authors broke physicians
into four groups based on the volume of pneumonia patients they cared for over a year. Here are
some of the results:
Study groups: 1 2 3 4
Median annual pneumonia cases 4 9 15 29
per physician
Percentage of time task performed
First antibiotic administered less 59% 63% 62% 62%
than four hours after admission
Appropriate antibiotics 82% 81% 81% 79%
Blood cultures obtained before 84% 84% 84% 83%
administration of antibiotics
Screened for or given influenza vaccine 21% 19% 20% 12%
Screened for or given pneumococcal vaccine 16% 13% 13% 9%
Results
Mean length of stay (in days) 6.0 6.0 6.2 6.6
Percentage of patients who died 5.8% 6.0% 5.7% 6.6%
in the hospital
Percentage of patients who died 10.9% 11.8% 11.0% 12.5%
within 30 days
SOURCE: “VOLUME, QUALITY OF CARE, AND OUTCOME IN PNEUMONIA,” ANNALS OF INTERNAL MEDICINE, FEB. 21
VOLUME
OF CASES
QUALITY
INDICATOR
OUTCOMES
PAGE 8
Heart disease kills more women than
any other disease. This story focuses
on the fact that other diseases are
better screened and looks at which
women are at the highest risk for
heart disease. The graphic shows the
five leading causes of death for
women and gives context for the
story. Easy comparison is drawn from
the plotting to emphasize just how
many more women die from
cardiovascular-related issues than
from the second leading cause,
cancer. By including factoids on
cardiovascular disease, the graphic
teases out more statistics about how
women are impacted.
1
Can we show
meaningful
comparisons?
SOURCE: CENTERS FOR DISEASE CONTROL AND PREVENTION AND
THE NATIONAL HEART, LUNG AND BLOOD INSTITUTE
n Cardiovascular disease (CVD)
ranks first among all disease
categories in hospital dis-
charges for women.
n Of the approximately 5.5
million stroke survivors alive
today, 56% are women.
n Misperceptions still exist that
CVD is not a real problem for
women.
n CVD is a particularly
important problem among mi-
nority women; the death rate
due to CVD is higher in black
women than in white women.
n 38% of women compared with
25% of men will die within one
year after a heart attack.
SOURCE: AMERICAN HEART ASSN.
Cardiovascular death: 484,000
Alzheimer’s
disease: 45,000
Diabetes
mellitus: 39,000
LEADING CAUSES OF DEATH FOR WOMEN
in the United States, 2003
Cancer: 268,000
.
.
. . .
Chronic lower
respiratory diseases: 66,000
28
Health&Science
Risk of second melanoma is higher than previously thought [ PAGE 33 ]
C
ardiovascular disease kills
nearly twice as many women
each year as does cancer, yet
annual mammograms and
Pap smears continue to be an
easier sell than lipid profiles or regular
blood pressure tests.
Despite years of warnings that women
face an even greater risk for cardiovascu-
lar disease than men, the word has been
slow to filter out. Women and their physi-
cians still don’t always acknowledge this
threat, nor do they take steps to slow its onset,
according to many experts. “It is really impor-
tant to keep educating patients and physicians
about this being such a devastating illness for
women,” said Norma Keller, MD, chief of cardiolo-
gy at Bellevue Hospital in New York City.
Figures from the Centers for Disease Control and
Prevention illuminate the problem. In 2003, 484,000
women died from cardiovascular disease compared with
427,000 men. Cancer, the next highest killer disease for
women, claimed 268,000 lives that same year.
The challenge for primary care physicians is to pick out
women most likely to benefit from treatment, said Lori Mosca,
MD, MPH, PhD, director of preventive cardiology at New
York-Presbyterian Hospital in New York City and chair of the
panel that drafted the American Heart Assn.’s Evidence-based
Guidelines for Cardiovascular Disease Prevention in Women.
“It is clear we are undertreating very high-risk women and
that there are many low-risk women who would be better
served by lifestyle changes than drug therapy.”
So how to determine which group is which? Go back to the
basics, she advises.
Evaluating traditional risk factors remains key for prima-
ry care physicians, Dr. Mosca said. “We have many physi-
cians who have not discussed with their patients their risk
factors for heart disease, including lifestyle and family histo-
ry.” Instead of preventive care, too many physicians are rely-
ing on technology that has not been proven to be associated
with beneficial outcomes, she added.
Jim King, MD, a family physician in rural Selmer, Tenn.,
keeps pushing this message to his female patients: “Watch
your cholesterol, blood pressure and weight, and don’t
smoke.” He notes that risk factors are the same for men and
women, although women’s risk starts to increase about
10 years later than men’s. His female patients also are
still more afraid of breast cancer. “They have to un-
derstand that heart disease is a more important
threat.”
The highest risk
African-American women are at the top of the risk
scale for heart disease, but they are the group least
likely to be diagnosed and treated effectively, said
Patricia Davidson, MD, a cardiologist at Washington
Hospital Center in Washington, D.C. “African-Ameri-
can along with Mexican-American and Native American
women have more risk factors lumped together.” Weight is a
problem. Sixty-eight percent of African-American women,
71% of Mexican-American women and 60% of Native Ameri-
can women are overweight, she noted. “With weight gain
comes insulin resistance, which leads to diabetes, which
raises your blood pressure.”
The lack of aggressive treatment to goal is another pitfall,
Getting to
the matter
the heartof
STORY BY SUSAN LANDERS
JUNE 5, 2006 AMEDNEWS.COM AMERICAN MEDICAL NEWS
SOURCE: CENTERS FOR DISEASE CONTROL AND PREVENTION AND
THE NATIONAL HEART, LUNG AND BLOOD INSTITUTE
PUBLIC HEALTH n CLINICAL ISSUES n PATIENTS
n Cardiovascular disease (CVD)
ranks first among all disease
categories in hospital dis-
charges for women.
n Of the approximately 5.5
million stroke survivors alive
today, 56% are women.
n Misperceptions still exist that
CVD is not a real problem for
women.
n CVD is a particularly
important problem among
minority women; the death
rate due to CVD is higher in
black women than in white
women.
n 38% of women compared with
25% of men will die within one
year after a heart attack.
SOURCE: AMERICAN HEART ASSN.
Cardiovascular death: 484,000
Alzheimer’s
disease: 45,000
Diabetes
mellitus: 39,000
LEADING CAUSES OF DEATH FOR WOMEN
in the United States, 2003
Cancer: 268,000
.
.
. . .
Chronic lower
respiratory diseases: 66,000
PHOTO ILLUSTRATION BY PETE MCARTHUR PHOTOGRAPHY
PAGE 9
1
Can we show
meaningful
comparisons?
MEDICATION
Methylphenidate,
amphetamine,
dextroamphetamine
Modafinil
Growth hormone
Testosterone
Nicotinic alpha-7
THERAPEUTIC INDICATION
Narcolepsy,
childhood ADHD
Narcolepsy, sleep apnea,
shift-work sleep disorder
Dwarfism, idiopathic
short stature, AIDS- and
cancer-related wasting
Hypogonadism,
andropause
Alzheimer’s,
schizophrenia
ENHANCEMENT USE
Intensify mental focus,
alertness
Combat jet lag, increase
wakefulness
Delay aging with increased
muscle, thicker skin, denser
bones, less total body fat
Delay aging with increased
muscle, denser bones,
better mood, higher libido,
enhanced cognition
Improve memory,
psychomotor skills
ETHICAL/SOCIAL CONCERNS
Social pressures could lead
to people using it to be
competitive
Could lead to compulsory
workplace doping to increase
effectiveness, safety
Could redefine aging as a
disease; stigmatize those
with short stature
Could redefine aging as a
disease; pose threat to
personal identity
Could present a greater
danger than enhancement
use of stimulants
SCOPE OF USE
Up to 25% of students at competitive
Northeastern universities reported
nontherapeutic use of stimulants
90% of prescriptions are for
off-label uses
About 30% of prescriptions are
for off-label uses
500% increase in total testos-
terone prescription sales have
been seen since 1993
At least 25% of people 85 and
older experience dementia; the
oldest of the country’s 75 million
baby boomers just turned 60
SOURCES: “DRUGS FOR ENHANCING COGNITION AND THEIR ETHICAL IMPLICATIONS: A HOT NEW CUP OF TEA,” EXPERT REVIEW OF NEUROTHERAPEUTICS, MARCH; “PROVISION
OR DISTRIBUTION OF GROWTH HORMONE FOR ‘ANTIAGING,’” JOURNAL OF THE AMERICAN MEDICAL ASSOCIATION, OCT. 26, 2005; “RISKS OF TESTOSTERONE-REPLACEMENT THERAPY
AND RECOMMENDATIONS FOR MONITORING,” NEW ENGLAND JOURNAL OF MEDICINE, JAN. 29, 2004; “SELECTIVE ALPHA7 NICOTINIC ACETYLCHOLINE RECEPTOR LIGANDS,” CURRENT
MEDICINAL CHEMISTRY, VOL. 13, NO. 13, 2006.
TREATMENTS TURNED ENHANCEMENTS GRAPHIC REPORTED BY KEVIN B. O’REILLY
The story discusses the quandaries emerging as some new treatments intended to heal the
sick are also being prescribed to enhance those who are healthy. The table and story work
together, with the text handling what experts are saying and the table highlighting the
types of drugs being discussed. The heavily-researched table adds a valuable dimension by
presenting factors at a level of detail that would have bogged down the story. The final two
columns (ethical/social concerns and scope of use) add meaningful content not available in
the story and describes the magnitude of the issue. The success of the graphic ultimately
rests in its ability to thoroughly present the essential details for a relevant list of drugs.
AMERICAN MEDICAL NEWS AMEDNEWS.COM AUGUST 28, 2006
11
Professional Issues
North Carolina considers limits on physician role in executions [ PAGE 13 ]
HEALTH CARE LITIGATION n MEDICAL EDUCATION n ETHICS n PROFESSIONAL REGULATION
TO HEAL, OR
TO ENHANCE?
L
ecturing a group of students last fall, Martha J.
Farah, PhD, commented that there was proba-
bly someone in the audience making use of
modafinil, approved to treat narcolepsy but
mostly prescribed off-label to long-haul truckers, jet-
lagged ocean hoppers and anyone else too busy to sleep.
“You were right about that!” said a graduate student
who approached Dr. Farah, director of the University of
Pennsylvania’s Center for Cognitive
Neuroscience, after the talk. Once a
week, said the student, who is also a
teaching assistant, he would find himself
falling behind on answering e-mail and
grading work. With modafinil, he could
stay up all night and still work through
the next day.
Dr. Farah’s observation was far from
a shot in the dark. Increasingly, students
at highly competitive universities such as Penn are us-
ing modafinil, or stimulants intended to treat attention-
deficit/hyperactivity disorder, to enhance their already
considerable abilities. Some students are asking doc-
tors for these so-called smart pills, though most obtain
them illegally from campus dealers.
College kids aren’t alone in looking to doctors to do
more than just cure their ills. Middle-aged men ask physi-
cians for testosterone boosters. Some adults even seek
growth hormones, one of the engines that allegedly
helped Barry Bonds overtake Babe Ruth on baseball’s all-
time home run list.
But should doctors say yes when patients ask for en-
hancement instead of healing?
It’s a question that medicine has grappled with on a
smaller scale for years. Cosmetic surgery posed similar
questions decades ago and continues to outpace med-
ically necessary reconstructive surgeries. Peter
Kramer’s 1993 book, Listening to Prozac,
alerted the nation to patients who sought
to feel “better than well.” And it didn’t
take long after Viagra’s 1998 approval be-
fore some normally functioning men be-
gan using the drug to enhance their sexu-
al experiences.
The question of whether to abide pa-
tient requests for enhancement treat-
ments will only continue to intensify as
new drugs hit the market. For example, Alzheimer’s
medication that is in the pipeline could potentially en-
hance healthy individuals’ memory.
In fact, the potential for genetic enhancement is so
great that the National Institutes of Health is funding
an investigation of the ethical implications of the re-
search. The AMA’s Council on Ethical and Judicial Af-
fairs also is studying human enhancement and may is-
sue ethical guidelines for physicians.
MAKING THE CALL
Doctors can be faced with
tough choices when
patients ask for something
to boost their abilities.
Franklin G. Miller, PhD, a
bioethicist at the National
Institutes of Health, and
Howard Brody, MD, PhD,
a family physician and
Michigan State University
bioethicist, offer two
principles to consider:
1. The more clearly an
intervention also
serves a legitimate medical
goal — such as preventing
disease, promoting health,
relieving pain and suffer-
ing, or avoiding premature
death — the more easily it
can be justified.
2. The greater the risks
involved, the more
difficult it is to justify an
enhancement intervention
in the absence of a clear
health rationale.
SOURCE: “ENHANCEMENT
TECHNOLOGIES AND PROFESSIONAL
INTEGRITY,” MAY-JUNE 2005
AMERICAN JOURNAL OF BIOETHICS
New treatments intended to
heal the sick also may help the
healthy flourish. Where should
doctors draw the line?
STORY BY
KEVIN B. O'REILLY
ILLUSTRATION BY
TED GRUDZINSKI
Continued on next page
PAGE 10
This story explores a study that
concluded doctors like the idea of
patient-centered care, but haven’t
adopted it. The story touches on
highlights from the study, while
the graphic allows readers to
do comparisons on a couple of
levels. First, the graphic shows
how three different groupings of
physicians ----- primary care,
specialists and all physicians -----
have adopted aspects of patient-
centered care. It also allows the
reader to quickly compare
numbers of how many have
adopted aspects vs. how many
say they plan to.
1
Can we show
meaningful
comparisons?
n A study reaching that conclusion comes
as some physician organizations are
trying to help practices redesign how they
provide care.
DAMON ADAMS
AMNEWS STAFF
Physicians are pretty good at providing same-day
appointments for patients who want them. And they
usually receive timely test results of patients they
referred to another doctor.
They don’t do as well at routinely using electron-
ic medical records or communicating with patients
via e-mail.
Those conclusions are based on what 1,837 physi-
cians, in practice at least three years, told re-
searchers. The nationwide survey led the authors of
a new study in the April 10 Archives of Internal Med-
icine to find that physicians favor such patient-cen-
tered care practices, but few practice all of them.
Physicians were asked about 11 patient-centered
practices, such as same-day appointments, e-mail
with patients, reminder notices for preventive or
follow-up care, electronic medical records and
patient survey feedback.
The study said that about one in four doctors us-
es electronic medical records and about half send
reminder notices to patients about preventive or fol-
low-up care.
Three in four primary care physicians had prob-
lems with the availability of patients records, test
results or other information at the time of a sched-
uled visit.
But researchers found that doctors favor many
elements of patient-centered care. The study said
87% of primary care physicians support improved
teamwork among health care professionals while
85% of all surveyed physicians favor easy access to
patients of medical records.
“They have the right attitude. They thought a
team approach to care was a good thing, and they’re
planning to look into electronic medical records,”
said lead study author Anne-Marie Audet, MD, vice
president for quality improvement at the Common-
wealth Fund, a private foundation in New York
City.
New models of care
The findings come at a time when some physician
organizations are making patient-centered care a
key component of efforts to redesign how physi-
AMERICAN MEDICAL NEWS AMEDNEWS.COM MAY 15, 2006
9
Professional IssuesHEALTH CARE LITIGATION n MEDICAL EDUCATION n ETHICS n PROFESSIONAL REGULATION
Some New York doctors join the Teamsters [ PAGE 14 ]
PUTTING IT INTO PRACTICE
A new study in the Archives of Internal Medicine found that a majority of physicians like
patient-centered care, but have adopted some aspects faster than others. Here is a look at some
patient-centered areas and the percentage of physicians who adopted the practices:
Doctors favor patient-centered
care but haven’t adopted it fully
“They thought a team approach to
care was a good thing, and they’re
planning to look into electronic
medical records.”
Anne-Marie Audet, MD, Commonwealth Fund
SOURCE: “ADOPTION OF PATIENT-CENTERED CARE PRACTICES BY PHYSICIANS,” ARCHIVES OF INTERNAL MEDICINE, APRIL 10 ISSUE.
Continued on page 13
100%
90%
80%
70%
60%
50%
40%
30%
20%
10%
100%
90%
80%
70%
60%
50%
40%
30%
20%
10%
PRACTICE ADOPTION PRACTICE ATTITUDE
A B C D E F
n Total physicians n Primary care physicians n Specialists
Local hospitals
could hold key to
boost residencies
n Increasing the physician work force
means training more residents, and a
medical school has found how to do so.
MYRLE CROASDALE
AMNEWS STAFF
After more than 20 years as a practicing gastroen-
terologist, Richard Greenwald, MD, is helping
turn his community hospital into a teaching
institution.
This year Dr. Greenwald, now vice president
of medical affairs at Boca Raton Community Hos-
pital, helped develop a module covering gastroen-
terology, the liver and nutrition for medical stu-
dents from the new University of Miami School of
Medicine program at Florida Atlantic University
in Boca Raton. The hospital’s partnership with
FAU and the University of Miami to teach med-
ical students is the first step in a long-range plan
to cultivate more physi-
cians for southeast Florida.
By 2010, some 100 to 125
medical residents are ex-
pected to be training there.
Boca Raton Community
Hospital may be the first
hospital in recent years to
take advantage of a little-
used opportunity to get
Medicare funding for new residencies. Because
the hospital has never sponsored a residency, it is
eligible for Medicare graduate medical education
dollars, money that has been capped for existing
programs since 1996.
Given concerns that a physician shortage may
develop by 2020, Boca Raton could become a mod-
el for those looking for ways to expand residen-
cies and physician numbers, work-force experts
say. Right now, opening residencies at hospitals
that haven’t previously had them is the only
route to get new government funding.
Richard Reynolds, MD, senior vice president
of medical advancement at Boca Raton Commu-
nity Hospital, wouldn’t be surprised if others fol-
lowed his hospital’s lead. “As we look ahead, with
the growth and aging of the population, we’re go-
ing to have a doctor shortage,” he said. “Current
schools are going to expand, and other [communi-
ty] hospitals will become teaching hospitals.”
Many consider such expansion good news. But
if more community hospitals do begin training
residents, some say the practice raises a broader
policy issue of how to best spend graduate med-
ical education dollars.
“Hospitals are feeling a need to increase resi-
dency size, and they aren’t getting the Medicare
funding to do it,” said Karen Fisher, senior asso-
ciate vice president of health care affairs at the
Assn. of American Medical Colleges. “If commu-
nity hospitals are interested in taking on GME,
that’s great. However, from a public policy per-
spective, wouldn’t it make more sense to expand
GME through quality existing programs as well
64 77 58 54 48 57 27 23 28 26 26 26 10 19 6 20 23 19
Continued on page 15
Med schools
expanding to
meet future
demand.
Page 17
A | Always or often provide a same-day appointment
to a patient who requests one
B | Send patients computerized or manual reminder
notices about regular preventive or follow-up care
C | Use electronic patient medical records routinely
or occasionally
D | Medical record(s), test results, or other relevant
clinical information never or rarely not available
at the time of patient’s scheduled visit
E | Plan to send reminder notices about regular
preventive or follow-up care within the next year
F | Plan to use electronic patient medical records
within the next year
PUTTING IT INTO PRACTICE
A new study in the Archives of Internal Medicine found that a majority of physicians like
patient-centered care, but have adopted some aspects faster than others. Here is a look at some
patient-centered areas and the percentage of physicians who adopted the practices:
SOURCE: “ADOPTION OF PATIENT-CENTERED CARE PRACTICES BY PHYSICIANS,” ARCHIVES OF INTERNAL MEDICINE, APRIL 10 ISSUE.
100%
90%
80%
70%
60%
50%
40%
30%
20%
10%
100%
90%
80%
70%
60%
50%
40%
30%
20%
10%
PRACTICE ADOPTION PRACTICE ATTITUDE
A B C D E F
n Total physicians n Primary care physicians n Specialists
64 77 58 54 48 57 27 23 28 26 26 26 10 19 6 20 23 19
A | Always or often provide a same-day appointment
to a patient who requests one
B | Send patients computerized or manual reminder
notices about regular preventive or follow-up care
C | Use electronic patient medical records routinely
or occasionally
D | Medical record(s), test results, or other relevant
clinical information never or rarely not available
at the time of patient’s scheduled visit
E | Plan to send reminder notices about regular
preventive or follow-up care within the next year
F | Plan to use electronic patient medical records
within the next year
PAGE 11
The success of this table is
largely due to the specificity
we provide with the data and
how it complements the main
story. Allowing the story
to focus primarily on the
potential versatility of this
type of employee, the graphic
addresses another key part of
the equation: Salary. The
graphic offers great depth by
showing average salaries
based on years of experience
as well as geographic region.
1
Can we show
meaningful
comparisons?
A
ccording the U.S. Bureau of Labor Statistics,
the fastest-growing health profession in the
country — the fastest-growing profession, pe-
riod — is medical assistant. Physicians such as
Catherine Tabb, MD, are one reason why.
Dr. Tabb, a solo family physician in Louisville,
Ohio, started practice in 1980 with one medical as-
sistant. She now has three full-time and three
part-time MAs. They’re used for all tasks — front,
as well as back office — not performed by her or
the practice’s single nurse practitioner.
Dr. Tabb likes the flexibility of staff who can
assume either front- or back-office duties to make
up for vacations or illness. But having people with
clinical knowledge at the front desk, making them
more useful to patients, is even better. “They can
answer basic questions about taking medications
without having to transfer the patient to me,” she
says. “They help patients decide if they need to
come in.”
Like most doctors who make extensive use of
MAs for clinical tasks, Dr. Tabb believes she’s in
no financial position to hire nurses. But more
than that, she says, they’re not necessary, particu-
larly when most of the clinical work can be
handled by MAs.
Charles Reed, MD, a pediatrician with 12-doc-
tor St. Christopher Pediatric Associates in
Philadelphia, says MAs bring versatility atypical
of other types of staff. “We can move them from of-
fice to office,” he says. “We can use them for clini-
cal tasks, and if we need to fill in, we can put them
in the front office, registering patients and an-
swering phones.”
The combination of versatility and compara-
tively low cost is driving the demand for MAs,
60% of whom work in physician offices. Accord-
ing to an American Assn. of Medical Assistants
survey of 4,057 MAs nationwide, 61.6% of an MA’s
time is spent on clinical duties, including obtain-
ing patient history and vital signs, assisting with
patient exams, scheduling patient appointments
and performing injections; 25.8% is spent on ad-
ministrative duties; 7.3% is taken up with admin-
istrative management; and 5.3% is spent on clini-
cal management. If they’re certified, MAs make
an average salary of $27,951. First-year MAs aver-
age $22,650, according to the AAMA.
Those in the field say doctors are just begin-
ning to tap the potential of MAs.
“Only a minority of physician groups know
how to utilize MAs and take full advantage of
what they can do,” says Don
Balasa, AAMA executive direc-
tor and chief counsel.
But hiring and integrating
MAs into your practice is not
necessarily an easy
task. The duties a me-
dial assistant can per-
form and the level of su-
pervision a physician
must provide can vary
depending on your state
and its regulations.
Generally, states
define what MAs
may or may not do
through scope-of-prac-
tice laws — if a task is
limited to a doctor, nurse
practitioner, physician as-
sistant or nurse, it’s off-
limits to an MA .
Finding a qualified MA
isn’t easy because of the
high demand. Another dif-
ficulty is that few have re-
ceived certification — estimates are at around
15% — through the AAMA or the American Med-
ical Technologists, giving physicians less evi-
dence an MA might be up to the job.
Hiring an MA
P
lenty of colleges and institutions offer two-
year programs for aspiring MAs. But doctors
vary on whether they require certification,
which is generally not required by law.
Dr. Tabb will hire only certified MAs.
Dr. Reed prefers but does not require a candi-
date to be certified. He typically hires only candi-
dates who have graduated from an accredited
post-secondary training program. In fact, most of
his hires are candidates who have completed in-
ternships in his office.
Nick Fabrizio is a consultant with MGMA Con-
sulting Group and serves as practice administra-
tor for a 12-doctor clinic that is part of the Dept. of
Family Medicine at State University of New York
Upstate Medical University, Syracuse. He says
the best way to find a good MA is to work with a
local educational organization that trains them.
His group works with Bryant & Stratton College,
a community college in Syracuse. By inviting stu-
dents to undertake internships at his group, “we
get to know the people intimately before we make
AMERICAN MEDICAL NEWS AMEDNEWS.COM APRIL 17, 2006
19
BusinessPRACTICE MANAGEMENT n PERSONAL FINANCE n TECHNOLOGY
Web site offers list of “average” costs of care [ PAGE 27 ]
Medical assistants
A key to practice efficiency
MAs can be the most versatile
members of your staff — if you
know how to use them.
Continued on next page
Story by Larry Stevens and Illustration by Terry Miura
MEDICAL ASSISTANT PAY
Here are overall and experience-based annual and hourly pay figures from the American Assn. of Medical
Assistants’ salary survey on medical assistant compensation. All figures below pertain to certified medical
assistants, a designation granted by the AAMA. The national average for noncertified MAs is $26,775, compared
with $27,951 for CMAs. Figures are as of 2004, the most recent survey.
New England (Conn., Maine, Mass.,N.H., R.I., Vt.) Annual $28,972 $25,056 $25,809 $29,219 $30,576
Hourly $14.49 $12.31 $13.08 $14.69 $15.22
Middle Atlantic (N.J., N.Y., Pa.) $30,451 $24,042 $28,710 $27,167 $32,341
$14.60 $12.96 $14.00 $13.34 $15.45
East North Central (Ill., Ind., Mich., Ohio, Wis.) $26,835 $22,128 $23,939 $25,070 $28,869
$13.27 $11.14 $11.98 $12.80 $14.15
West North Central (Iowa, Kan., Minn., Mo., $27,335 $23,150 $24,477 $26,900 $28,691
Neb., N.D., S.D.) $13.65 $12.04 $12.49 $13.53 $14.25
South Atlantic (Del., Fla., Ga., Md., N.C., S.C., $27,785 $22,922 $24,779 $26,972 $30,218
Va., W.Va., District of Columbia) $13.24 $11.53 $12.14 $13.05 $14.23
East South Central (Ala., Ky., Miss., Tenn.) $26,726 $22,000 $25,750 $25,974 $27,953
$12.69 $10.88 $11.78 $12.30 $13.29
West South Central (Ark., La., Ok., Texas) $29,115 * $24,600 $26,875 $31,152
$13.26 * $12.27 $12.54 $14.16
Mountain (Ariz., Colo., Idaho, Mont., Nev., $27,380 * $24,800 $25,426 $29,494
N.M., Utah, Wyo.) $13.40 * $12.58 $13.08 $13.98
Pacific (Alaska, Calif., Hawaii, Ore., Wash.) $29,995 $27,472 $27,082 $29,468 $31,534
$14.90 $13.76 $14.28 $14.94 $15.42
*INSUFFICIENT RESPONSE
NOTE: REGIONS ARE AS DEFINED BY THE U.S. DEPT. OF CENSUS.
SOURCE: AMERICAN ASSN. OF MEDICAL ASSISTANTS
REGION OVERALL 1–2 3–5 6–9 10 +
YEARS YEARS YEARS YEARS
PAGE 12
This was an ideal opportunity for a comparative
table. The story discusses an international patient
survey that showed the U.S. lagging behind five
other nations in nearly all areas surveyed. The
story described the nature of the survey and
provided numerous interesting findings, while
the graphic gave side-by-side rankings of the
six nations involved. At a glance, the reader can
compare rankings for the
subcategories that contribute
to the overall rank. Any story
that relies so heavily on
accessible comparisons like
these would suffer if it lacked
a graphic presentation of the
key findings.
1
Can we show
meaningful
comparisons?
n The country was rated
first only in
effectiveness of care.
ELAINE MONAGHAN
AMNEWS STAFF
Washington Adult patients in the
United States are less safe, not as
well informed by their doctors
and more unequally treated than
people in five other developed
nations that spend far less treat-
ing them, according to two stud-
ies released earlier this month
by the Commonwealth Fund.
America ranked last overall
when compared with Australia,
Canada, Germany, New Zealand
and the United Kingdom in one
study, “Mirror, Mirror, on the
Wall: An Update on the Quality
of American Health Care
Through the Patient’s Lens.”
This analysis compared U.S.
health leaders to the vain queen
in “Snow White.” Too often, they
excluded experiences of other coun-
tries, looking only “at our own reflec-
tion in the mirror,” the report states.
Based on 2004 and 2005 surveys, it
found that American patients were
most likely to say they encountered a
laboratory test mistake or delay in re-
ceiving abnormal results, did not get
questions answered by their physi-
cian, struggled to get needed care at
nights or on weekends, and failed to
fill or take prescriptions due to cost.
Janet Corrigan, PhD, president
and CEO of the National Quality Fo-
rum and the National Committee for
Quality Health Care, said the study
should not be read as an indictment of
physicians, but as further evidence of
the need to reform the country’s disor-
ganized health system. She noted
the study’s reliance on patient assess-
ments. “You might get different re-
sults if you asked physicians or
looked at medical records.”
The work, which followed an
Institute of Medicine framework
to evaluate health care system
quality, concluded that the Unit-
ed States ranked first in six out
of 51 indicators, and last or tied
for last in 27. Karen Davis, PhD,
the fund’s president, described
this outcome as “particularly
disturbing considering we lead
the world in health care spend-
ing.” The fund is a private health
foundation that supports re-
search into improving quality
and efficiency.
To arrive at its ratings, the
study used six categories:
l Patient safety addressed
wrong drugs or doses, mistakes
in care, and delayed or incorrect
test results.
l Effectiveness included use
of mammograms, flu shots, med-
ication reviews, diet and exercise
advice, hospital infections and
follow-up visits.
l Patient centeredness exam-
ined such issues as doctor communi-
cation, choice, time with the physi-
cian, pain management and access to
records.
l Timeliness addressed appoint-
ment wait times, emergency depart-
ment lines and access to care at irreg-
AMERICAN MEDICAL NEWS AMEDNEWS.COM APRIL 24, 2006
5
Florida passes bill limiting doctors’ share of liability [ PAGE 8 ]
MEDICARE / MEDICAID n LEGISLATION AND REGULATION n NATIONAL HEALTH POLICY
Government&Medicine
United States fares poorly in international patient survey
Continued on page 7
$40
$0
$60
$80
$100
Expenditures
(in billions)
’98 ’99 ’00 ’01 ’02 ’03 ’04 ’05
8.5% growth
in 2005
1.5% growth
in 1998
n The Centers for Medicare & Medicaid
Services also releases its projection of a
4.6% Medicare pay cut for doctors in 2007.
DAVID GLENDINNING
AMNEWS STAFF
Washington Although Medicare spending on physi-
cian services did not rise as much last year as it did
the year before, the increase was still large enough
to catch the attention of federal officials looking to
find more efficiency in the system.
The Centers for Medicare & Medicaid Services re-
cently estimated that spending on physician ser-
vices increased by 8.5% during 2005. In 2004, this
rate of growth was 11.4%.
But the nearly three percentage point drop was
not due to patients using fewer or less complex
Medicare services. Instead, the change is largely at-
tributable to decreased growth in beneficiary enroll-
ment, spending shifts stemming from the Medicare
drug benefit and lower reimbursement for physi-
cian-administered drugs and lab tests, CMS said.
All but one percentage point of the 8.5% increase
is due to physicians prescribing more services to
their Medicare patients and more intensive levels of
services. Physicians stepped up both the number
and complexity of basic services, such as follow-up
visits; minor procedures, such as physical therapy;
and screening tests, such as imaging scans.
The 16% growth in imaging service expenditures
alone, for example, was nearly twice as high as the
average rise in spending for all physician services.
Doctors’ greater reliance on CT scans and MRIs is
one of the biggest spending drivers in this area, the
agency said.
Such developments worry those who are charged
with making sure the program is paying for what it
views as the right patient care.
“Understanding the relatively rapid growth in
these services, and determining whether there are
ways to promote better health while slowing the
rapid increase in use of these services, is an increas-
ingly important issue,” wrote Herb Kuhn, director
of CMS’ Center for Medicare Management, in an
April 7 letter to the Medicare Payment Advisory
Commission.
PHYSICIAN SERVICES
Medicare expenditures under the physician
fee schedule in recent years have increased
by large enough percentages to catch the at-
tention of federal officials. With preliminary
numbers now in for 2005, here’s how spend-
ing has gone up over time:
SOURCE: CENTERS FOR MEDICARE & MEDICAID SERVICES
Medicare physician spending
growth worries U.S. officials
Continued on next page
HIGH SPENDING, LOW SCORE
The United States spends more per person on health care than any of the other
five countries studied, but it ranks last overall when scores for patient safety, ef-
fectiveness, patient-centeredness, timeliness, efficiency and equity are combined.
AUSTRALIA CANADA GERMANY NEW UNITED UNITED
ZEALAND KINGDOM STATES
OVERALL RANKING 4 5 1 2 3 6
Patient safety 4 5 2 3 1 6
Effectiveness 4 2 3 6 5 1
Patient-
centeredness 3 5 1 2 4 6
Timeliness 4 6 1 2 5 3
Efficiency 4 5 1 2 3 6
Equity 2 4 5 3 1 6
Per capita health
expenditures $2,903 $3,003 $2,996 $1,886 $2,231 $5,635
NOTE: BASED ON 2004 AND 2005 INTERNATIONAL HEALTH POLICY SURVEYS
SOURCE: COMMONWEALTH FUND, APRIL
HIGH SPENDING, LOW SCORE
The United States spends more per person on health care than any of the
other five countries studied, but it ranks last overall when scores for patient
safety, effectiveness, patient-centeredness, timeliness, efficiency and equity
are combined.
AUSTRALIA CANADA GERMANY NEW UNITED UNITED
ZEALAND KINGDOM STATES
OVERALL RANKING 4 5 1 2 3 6
Patient safety 4 5 2 3 1 6
Effectiveness 4 2 3 6 5 1
Patient-
centeredness 3 5 1 2 4 6
Timeliness 4 6 1 2 5 3
Efficiency 4 5 1 2 3 6
Equity 2 4 5 3 1 6
Per capita health
expenditures $2,903 $3,003 $2,996 $1,886 $2,231 $5,635
NOTE: BASED ON 2004 AND 2005 INTERNATIONAL HEALTH POLICY SURVEYS
SOURCE: COMMONWEALTH FUND, APRIL
PAGE 13
To balance a story about increases in Medicare
Part D prices, this graphic compares information
about specific drugs that doctors commonly
prescribe. The graphic gives doctors a sense of how
many health plans increased the cost of a particular
drug, what percent of plans decreased the price and
what the median percent change was. The chart
worked well because it offered tangible
information on drugs that readers commonly
prescribe. Had the information been integrated
into the story, it would have lost much of its utility.
1
Can we show
meaningful
comparisons?
n Pharmaceutical
manufacturers and
Medicare drug plans say the
studies misrepresent what
seniors are actually paying for
medications.
DAVID GLENDINNING
AMNEWS STAFF
Washington In the first three months
of the Medicare drug benefit, the
average wholesale price for roughly
200 of the brand-name drugs most of-
ten used by older Americans under-
went the single biggest jump in the
last six years, according to a recent
study by AARP.
The average price that drugmakers
charged wholesalers for medications
increased by 3.9% in the first quarter
of the year, four times the rate of gen-
eral inflation and the largest quarter-
ly increase since AARP began track-
ing the figures in 2000. For typical
people older than 50 taking four med-
ications per day, this means their av-
erage annual drug bills increased
roughly $240 over the 12 months lead-
ing up to the end of March, compared
with an increase of roughly $190 dur-
ing the previous year.
In a separate study, the consumer
group Families USA found that
Medicare drug plans are responding
to the wholesale price increases by
boosting what they charge for brand-
name medications. For the top 20
drugs prescribed to seniors, the vast
majority of Medicare Part D plans
quoted higher prices in mid-April
than they did in mid-November 2005,
when enrollment for the drug benefit
began.
The study showed that for 15 out of
the 20 medications, more than 80% of
the plans raised prices over that time
period, rather than lowering them or
keeping them the same. The median
percent change was 3.7%.
Both groups said that seniors are
being adversely affected because in-
surers are passing along the price in-
creases to beneficiaries.
“Shortly after the [Medicare drug
law] was enacted, AARP challenged
drug manufacturers to keep the rate
of price increase for drugs widely
used by older Americans to the rate of
general inflation,” the seniors’ group
said. “While the rate of increase did
slow down beginning in mid-2004, the
first quarter 2006 results represent a
disturbing reversal of that trend.”
Families USA Executive Director
Ron Pollack said the data in his
group’s report show that federal offi-
cials’ assertions about the power of
the market to drive prices down are
turning out to be wrong. Centers for
Medicare & Medicaid Services Ad-
ministrator Mark McClellan, MD,
PhD, Republican lawmakers and oth-
er drug benefit supporters have said
that private-sector competition would
do a much better job keeping costs in
check than government intervention.
“At the same time that the Bush ad-
ministration and congressional lead-
ers are touting the effectiveness of the
Medicare drug plans, those plans are
quietly raising the prices that they
charge,” Pollack said. “As a result, se-
niors will pay more and more — as
will America’s taxpayers.”
Both groups said that allowing the
federal government to negotiate with
drug companies over the prices they
charge, a task that is left to pharmacy
benefit managers in the private sec-
tor, would help alleviate cost spikes
such as the ones seen in recent
months. Such direct negotiation,
which would require congressional
approval, is supported by a range of
other groups, including the American
Medical Association.
More to the story
Drug manufacturers and Medicare
drug plans challenged both reports,
saying that the conclusions were
flawed and misleading.
Ken Johnson, senior vice president
for the Pharmaceutical Research and
Manufacturers of America, said that
more reliable official government da-
ta show recent drug prices tracking
the rate of increase in the costs of
medical products. Between January
and May of this year, that medical in-
flation figure was determined to be
JULY 10, 2006 AMEDNEWS.COM AMERICAN MEDICAL NEWS
10 Government & Medicine
WEBLINKS
http://www.familiesusa.org/
resources/publications/reports/
big-dollars-little-sense.html
“Big Dollars, Little Sense: Rising
Medicare Prescription Drug Prices,”
Families USA, June
http://www.aarp.org/research/
health/drugs/aresearch-
import-869-2004-06--IB69.html
“Trends in Manufacturer Prices of
Brand Name Prescription Drugs Used
by Older Americans — First Quarter
2006 Update,” AARP, June
Consumer groups report hike in Medicare Part D drug prices
Continued on page 12
PRESCRIPTION DRUG
PRICES ON THE RISE
In response to recently
increased medication prices
from pharmaceutical manu-
facturers, the vast majority of
Medicare drug plans between
November 2005 and April 2006
raised their listed prices for
the drugs physicians most
commonly prescribe to
seniors. Here is a sample of
those increases:
Drug Name % of plans that % of plans that Median percent
increased prices decreased prices price change
Zocor (40 mg) 100.0% 0.0% 5.7%
Fosamax (70 mg) 98.7% 1.3% 4.9%
Lipitor (10 mg) 97.3% 2.7% 6.5%
Xalatan (0.005 %) 96.8% 3.2% 4.9%
Toprol XL (50 mg) 96.2% 3.8% 3.0%
Actonel (35 mg) 96.1% 3.9% 4.9%
Celebrex (200 mg) 94.8% 5.2% 6.5%
Norvasc (5 mg) 94.6% 5.4% 3.2%
SOURCE: FAMILIES USA, “BIG DOLLARS, LITTLE SENSE: RISING MEDICARE PRESCRIPTION DRUG PRICES,”
JUNE
PAGE 14
Although not labeled as a “how to,”
this box gives readers tips on how a
doctor and patient can challenge an
insurer’s decision. Each bullet item
begins with a short declarative
sentence and is followed by a
description of what action to take. It’s
a good clip-and-save item, while the
story addresses in more depth how
physicians could use patients’ help
when appealing insurance decisions.
2
Can we offer
guidance
or tips?
How you and your patient
can successfully challenge
an insurer’s decision:
n Appeal every denial. Data
show appeals have a high
success rate.
n Record everything.
When you call an insurer
for preauthorization or veri-
fication of a benefit, make a
note of the conversation and
the names of people you
spoke with.
n Send all written correspondence via certified mail and keep
records. Time limits can be placed on insurers. Writing things
such as, “If you do not respond in five business days it will be as-
sumed there are no disputes with the content of this mailing”
can sometimes lead to quicker action.
n If you don’t get an acceptable answer, go up the chain of com-
mand. Copy the plan president with your dispute. For long-
standing disputes, send copies of your correspondence to the
state insurance commissioner or the state’s attorney’s office.
n Get the patient involved. A heartfelt letter explaining how the
patient’s life would improve with a certain procedure or treat-
ment can be compelling. If you anticipate difficulty, submit the
patient’s letter along with the initial claim.
n If another physician has more expertise that speaks to the
scope of the claim, include a second opinion.
n Establish a history with the patient and ensure it is well docu-
mented. Insurers place more weight on the opinions of a physi-
cian who has an established relationship with the policyholder.
n Get the employer or labor union involved. Experts say a com-
plaint from an employer who is paying for a large number of in-
surance plans gets attention.
Share the
heavy
lifting
AMERICAN MEDICAL NEWS AMEDNEWS.COM FEBRUARY 5, 2007
21
BusinessPRACTICE MANAGEMENT n PERSONAL FINANCE n TECHNOLOGY
Companies to fund new push for e-prescribing [ PAGE 26 ]
Insurance Disputes
Patients who deal directly
with insurers are often
more successful at resolving
disputes. But asking a
patient to intervene should
be a carefully considered
decision.
Harnessing
patient power
M
ark Granoff, MD, spent more than
an hour on the phone with an in-
surer trying to get approval for a
non-formulary medication. Three
separate phone calls and no head-
way later, he handed the prover-
bial baton to his patient.
Dr. Granoff, an internist and geriatrician
from Los Angeles, said he generally likes to
handle disputes himself. But in cases where he
clearly is getting nowhere, the former medical
director for Blue Cross of California knows
from experience that it’s the patient who holds
the power to get things done. Sometimes get-
ting the patient involved is key to getting a dis-
pute resolved.
Insurers “are not anxious to make the pa-
tient unhappy,” Dr. Granoff said. “They are
the ones paying.”
Getting a patient directly involved with in-
surance disputes can be tricky and can require
some coaching from the physician. But if done
at the right time and in an appropriate man-
ner, it can pay off.
Because patients have been paying more
out of pocket for their health care in recent
years, some doctors feel patients are more will-
ing to fight for benefits. And the time patients
spend advocating on their own behalf is time
physicians can devote back to patient care.
Kathryn Stewart, MD, MPH, a family physi-
cian and director of care management at Mt.
Sinai Medical Center in Chicago, said she used
to spend a lot of time on the phone advocating
for patients.
“But in this day and age, it’s just not practi-
cal for primary care physicians to do that any-
more,” Dr. Stewart said. “Doctors are in-
creasingly pressed to see more patients, and
many are having a difficult time staying
out of the red.”
While some have taken a proactive ap-
proach and gotten the patient involved
before a dispute arises, others have
found a patient’s voice can be the nudge
that results in a change of heart.
The people making the decisions “are
human, too,” said New York attorney
Richard Quadrino, who has represented
hundreds of doctors and patients in coverage
disputes.
When to get patients involved
T
he choice to get a patient involved should
be made judiciously, Quadrino said. “I
don’t know if the insurance company re-
ally wants to hear from the patient un-
less it’s a real medical necessity. And often the
doctor can speak to the medical issue.”
But Dr. Stewart said having communication
between the patient and the insurer can not on-
ly result in quicker resolutions to disputes in
certain situations, but can also be a good line
of defense if the patient is requesting a proce-
dure that the doctor knows will not be covered.
Because the patient is the client, “it’s really
up to the insurance company to explain to the
patient why or why not it is being covered,”
she said.
For example, she recently had a patient who
wanted to be transferred to a hospital outside
his HMO network. After a fruitless call to the
insurer, she told the patient he would have to
call the insurer directly if he really thought a
transfer should be granted.
Jerry Bridge, president of San Diego-based
Bridge Practice Management Group, encour-
ages physicians to anticipate potential prob-
lems and have new patients sign an appeals au-
thorization on their first visit. Having that
Continued on next page
Story by Pamela Lewis Dolan
Illustration by Jem Sullivan
PAGE 15
According to an IOM panel report, 1.5 million
people are harmed annually by medication
errors. This story explains the panel’s findings
and more importantly, provides something the
reader can act on: Guidance on how physicians
can reduce some of those errors. Presented under
a direct headline, “What you can do to reduce
errors,” this box delivers 13 tips from the IOM
report in simple, useful language. Many reports
and studies outline problems, but no answers.
This is a strong example of providing both.
A CLOSER LOOK AT THE MONEY
Commercial entities — pharmaceuti-
cal companies and medical device
manufacturers — poured a record
amount of money into continuing
medical education and related
education activities in 2005. Propor-
tionally, however, their dollars
accounted for a smaller piece of the
overall CME
n A panel’s report calls on all physicians
to prescribe electronically by 2010, but
experts say that’s a reach.
KEVIN B. O’REILLY
AMNEWS STAFF
At least 1.5 million people are injured annually by
preventable medication errors that occur at every
stage of the process, from prescribing to dispensing
to patient administration, according to a July Insti-
tute of Medicine report.
The new report says physicians, nurses, pharma-
cists, patients and drugmakers must work together
to combat the many factors that contribute to the
persistence of these errors, which the IOM earlier
reported kill an estimated 7,000 people a year.
“The 1999 report [“To Err is Human”] raised
awareness about errors in general,” said J. Lyle
Bootman, PhD, ScD, co-chair of the IOM Committee
on Identifying and Preventing Medication Errors
and dean of the University of Arizona College of
Pharmacy. “The current report makes clear that we
still have a long way to go.”
Albert W. Wu, MD, MPH, a panel member and
professor of health policy and management and in-
ternal medicine at Johns Hopkins University in
Baltimore, said the report’s findings make clear
that medication errors are the most far-reaching of
medical errors.
“I’m a patient-safety researcher, and even as we
went through the process I was surprised by just
how common and how serious a problem this is,”
Dr. Wu said. “We all need to wake up and take a part
in fixing it.”
Most important for physicians, the panel called
on all prescribers to have a plan to implement an
electronic prescribing system by 2008 and to have
such systems in place by 2010.
Wilson D. Pace, MD, a panel member and Green-
Edelman Chair for Practice-based Research at the
University of Colorado, said even the most talented
physicians need electronic systems to help them
prescribe safely.
“With 15,000 medications available, it’s virtually
impossible to track all of those anymore just using
your memory,” Dr. Pace said. “Electronic prescrib-
n But at the local level, some
CME providers say they
have found that there’s less in
the pot for them.
MYRLE CROASDALE
AMNEWS STAFF
Spending on continuing medical edu-
cation over a one-year period was up
nearly 10% in 2005, to $2.25 billion, but
a smaller percentage of that money
came from pharmaceutical compa-
nies and other commercial interests
than in years past, according to the re-
cently released 2005 annual report of
the Accreditation Council for Contin-
uing Medical Education.
Commercial interests — drug com-
panies and medical device manufac-
turers — increased their giving to
CME providers to $1.35 billion in 2005
for such items as education grants
and exhibit space.
But because of increased money
from registration fees and noncom-
mercial groups, the share of spending
by pharmaceutical and device manu-
facturers covering CME costs as well
as CME-related advertising and ex-
hibit fees fell from 62% in 2004 to 60%
in 2005.
Part of this decrease is also attrib-
uted to ACCME changing the defini-
tion of commercial support to exclude
money or services from nonprofit or
government organizations and non-
health care-related companies.
Increased total spending in 2005 al-
so translated into an increased num-
ber of total CME activities, with the
national specialty societies and large
CME providers still capturing a sig-
nificant portion of pharmaceutical
dollars.
Despite the net increase on paper,
locally produced CME is facing a re-
duction in commercial educational
grants as state medical societies and
small- and mid-sized hospitals capture
a smaller share of commercial CME
support, some experts say.
With pharmaceutical and device
manufacturers the largest contribu-
tors to educational activities for prac-
ticing physicians, say the experts, this
could signal a reduction in the
amount of CME available for physi-
cians at the local level.
Murray Kopelow, MD, ACCME
chief executive, said he’s heard from
CME providers that commercial CME
funding is falling, particularly on the
local level, but said the ACCME does
not capture data at the local level.
AMERICAN MEDICAL NEWS AMEDNEWS.COM AUGUST 21, 2006
9
Professional IssuesHEALTH CARE LITIGATION n MEDICAL EDUCATION n ETHICS n PROFESSIONAL REGULATION
Calif. high court shields peer reviewers [ PAGE 13 ]
MEDICATION ERRORS ADD UP
The toll of preventable medication errors
is uncertain, but in a July report, an
Institute of Medicine panel estimates that
at least 1.5 million people are harmed an-
nually by preventable medication errors.
Here’s a breakdown of these estimates:
400,000preventable
drug-related
injuries occur each year in hospitals.
It costs an extra $3.5 billion to treat those
injuries.
800,000preventable
drug-related
injuries occur in long-term care settings.
530,000preventable
drug-related
injuries occur among Medicare recipients
in outpatient clinics. In 2000, it cost $887
million to treat those injuries.
25%of all medication errors are
due to similar drug names.
33%of drug errors, including
30% of deaths, are due to poor
labeling and packaging.
E-prescribing urged as one
error-prevention strategy
More dollars flow into continuing medical education
Continued on next page
Medication mix-ups prevalent
Continued on page 12
$0.0
$0.5
$1.0
$1.5
$2.0
$2.5
2003 2004 2005
BILLIONS OF DOLLARS SPENT
$2.25
$2.05
$1.77
60%
62%
65%
35%
38%
40%
CME FUNDING
Including pharmaceutical and
medical device manufacturer
spending, physician registration fees
and other sources of income.
WHERE CME DOLLARS CAME FROM
n Commercial entities
n Registration fees and other
noncommercial CME income
HOW COMMERCIAL SPENDING BREAKS DOWN
Education, Advertising, Physician fees,
grants, support exhibit income other income
2003 55% 10% 35%
2004 52% 10% 38%
2005 50% 10% 40%
SOURCE: ACCME 2005 ANNUAL REPORT
WHAT YOU CAN DO TO REDUCE ERRORS
A July Institute of Medicine report says office-based physicians should take these steps
to minimize medication errors:
n Put an electronic prescribing plan in place by 2008; implement e-prescribing by 2010.
n Reconcile medications at transition points — admission, discharge and transfer.
n Create a routine to reconcile medication changes with the pharmacy record.
n Keep an accurate medication list for each patient, including over-the-counter and
complementary and alternative medications. Ask patients to bring their medications in
periodically to keep the list up to date.
n Do the following when prescribing new medication: Ask about allergies, inform the
patient of indications for all medications, explain common or significant side effects,
consult electronic or other reference sources for questions, avoid abbreviations and in-
clude patient age and weight when applicable.
n Ask regularly whether patients are taking their medications, including as-needed
drugs. If they aren’t taking the medication, it may signal that a patient had an adverse
reaction to the drug.
n Monitor the patient for response to medication therapy and ask regularly about side
effects or adverse drug events.
n Standardize communication about prescriptions within the practice; standardize and
improve handoffs to the primary pharmacist.
n Ask the primary pharmacy about the patient’s refill history.
n Work as a team with the primary pharmacist and nurses.
n Minimize the use of free samples; when dispensing free samples, apply standards
similar to those a pharmacy would use.
n Exercise particular caution in high-risk situations, such as times when a physician is
stressed, sleep-deprived, angry or is supervising inexperienced personnel.
n Report errors and adverse drug events to the Medication Errors Reporting Program,
jointly run by U.S. Pharmacopeia and the Institute for Safe Medication Practices as well
as the appropriate patient-safety organization or authority, depending on the state.
2
Can we offer
guidance
or tips?
PAGE 16
STANFORD’S RULES
Medical staff, faculty, students and trainees at the Stanford University
School of Medicine, Stanford Hospital and Clinics and the Lucile
Packard Children’s Hospital must follow these standards:
n No personal gifts of any size from industry, under any circumstances.
n No compensation for listening to a sales talk.
n No compensation — including defraying costs — for attending
a continuing medical education event or other activity, unless an
individual is presenting at the event.
n No sales representatives in patient-care areas, unless it’s to train staff
for research or on how to operate clinical equipment. All visits must be
by appointment.
n No sales representative visits with physicians without an appoint-
ment. These appointments may be made at the physician’s discretion.
n No industry support directly to students and trainees. The support
must be provided through the school and must be free of any actual or
perceived conflict of interest and specifically for educational purposes.
SOURCE: STANFORD UNIVERSITY SCHOOL OF MEDICINE
2
Can we offer
guidance
or tips?
For this page 1 story, Stanford is the first school
highlighted in an exploration of academic medical
centers taking firmer stances against pharmaceutical
marketing efforts on campus. It is not until well into
the jump that other institutions are discussed at length,
so it makes sense that Stanford’s rules get prominence.
The guidelines staff and students must follow are already
written clearly and make a compelling graphic about
real-world expectations. The story gets into the policies
of other schools and changes that have come about in
response and also offers a graphic on the JAMA article
challenging academic
medical centers to take the
lead on conflict-of-interest
reforms. Providing
Stanford’s clearly stated
guidelines helps the story
become more tangible.
n Stanford, Yale and the
University of Pennsylvania
have adopted policies to create
a brighter line between medicine
and marketing.
MYRLE CROASDALE
AMNEWS STAFF
On Oct. 1, Stanford University School
of Medicine in California closed its
last avenue for pharmaceutical mar-
keting on campus, shutting down
drug company freebies no matter
what their size.
The ban includes everything from
free lunches to pens touting the latest
medication to hit the market. Also,
pharmaceutical sales representatives
must make appointments if they want
to talk with physicians. The stricter
rules come after the school prohibited
drug samples several years ago, ex-
cept at medical students’ free clinics.
Stanford is one of a handful of acad-
emic medical centers expanding con-
flict-of-interest rules beyond research
to include smaller gifts aimed at influ-
encing physicians’ clinical practices,
namely prescribing.
Although there is no hard number
on how much is spent, Stanford esti-
mates that drug companies lay out
about $250,000 annually on meals
there. Nationwide, the pharmaceuti-
cal industry estimates that it spends
$21 billion a year on marketing,
though some contend that this figure
is too low.
“There’s a growing awareness that
pharmaceutical promotions subtly,
and not so subtly, impact physicians’
decisions,” said internist Clarence
Braddock, MD, MPH, an associate
professor at Stanford and a member of
the Stanford Center for Biomedical
Ethics. “Even if [you believe] there’s
www.amednews.com
AMERICAN MEDICAL NEWS
515 NORTH STATE
CHICAGO, IL 60610
★ ★ ★
CLASSIFIED ADVERTISING – PAGES 37-38
October 9, 2006
VOLUME 49 n NUMBER 38American Medical
Souped-up EMR
Physicians who want to
integrate a patient’s genetic
code into treatment using
bioinformatics need the
technology and ability to
analyze the data.
In Business, page 21
Specialty hospital fight
goes to state’s high court
Government & Medicine, page 7
Online prescribing
spurs criminal charges
Professional Issues, page 16
Hospital competition
breeds quality
Opinion, page 30
Doctors wary about
flu vaccine deliveries
Health & Science, page 32
Promise and
challenges
In the last of a three-part
series, doctors try to look
beyond today’s crisis and see
what lies ahead in fixing the
Medicare pay system.
In Government & Medicine, page 5
Cancer, families
and physicians
The book A Lion in the House
features insights from parents,
doctors and others who cared
for five children at a
Cincinnati hospital.
In Professional Issues, page 12
Restricting drug reps
Some medical schools say no to free lunch
Physician service growth rate slows,
easing Medicare premium increase
STANFORD’S RULES
Medical staff, faculty, students and trainees at the Stanford University
School of Medicine, Stanford Hospital and Clinics and the Lucile
Packard Children’s Hospital must follow these standards:
n No personal gifts of any size from industry, under any circumstances.
n No compensation for listening to a sales talk.
n No compensation — including defraying costs — for attending
a continuing medical education event or other activity, unless an
individual is presenting at the event.
n No sales representatives in patient-care areas, unless it’s to train staff
for research or on how to operate clinical equipment. All visits must be
by appointment.
n No sales representative visits with physicians without an appoint-
ment. These appointments may be made at the physician’s discretion.
n No industry support directly to students and trainees. The support
must be provided through the school and must be free of any actual or
perceived conflict of interest and specifically for educational purposes.
SOURCE: STANFORD UNIVERSITY SCHOOL OF MEDICINE
Continued on next page
n Meanwhile, beneficiaries
with higher incomes will pay
bigger premiums next year as
the result of a 2003 law.
DAVID GLENDINNING
AMNEWS STAFF
Washington Medicare beneficiaries next
year will not see their premiums rise
as much as originally thought now
that federal officials have downgraded
their projections of how much doctor
care is costing the program.
The standard 2007 monthly premi-
um for Medicare Part B, which covers
outpatient physician care, will in-
crease by $5 to $93.50. The Centers for
Medicare & Medicaid Services esti-
mated in July that the premium
would jump by nearly $10 to $98.40.
The new figure will be the smallest in-
crease in six years.
Beneficiaries will pay less because
federal officials have revised the rate
at which spending on physician care
is increasing, said CMS Administra-
tor Mark McClellan, MD, PhD. In par-
ticular, the growth rate for physician
services in 2005 slowed compared
with recent years, altering projec-
tions for the future.
CMS originally thought that the
amount of services that doctors were
billing was spiking, but now officials
have realized that doctors simply were
filing claims more efficiently and re-
ceiving payments more quickly. The
effect of the higher efficiency made it
look to actuaries as if doctors were
boosting the total level of care they
were prescribing to their patients.
The amount that seniors are ex-
pected to pay to receive coverage un-
der the program is dependent in part
on the amount and complexity of ser-
vices that doctors provide. Because
Part B premiums are calculated to
cover 25% of the program’s costs, any
increases in physician services result
Continued on page 4
Alt Story Forms.AMA News

Mais conteúdo relacionado

Destaque

Erfolg Ausgabe 01/2010 vom 2.02.2010
Erfolg Ausgabe 01/2010 vom 2.02.2010 Erfolg Ausgabe 01/2010 vom 2.02.2010
Erfolg Ausgabe 01/2010 vom 2.02.2010 Netzwerk-Verlag
 
Media coverage assocham ladies league celebrating international women's week...
Media coverage  assocham ladies league celebrating international women's week...Media coverage  assocham ladies league celebrating international women's week...
Media coverage assocham ladies league celebrating international women's week...Parvinder Singh
 
Storyboard of emmerdale storyline
Storyboard of emmerdale storylineStoryboard of emmerdale storyline
Storyboard of emmerdale storylineAlexanderBall1
 
Innovation for development and cultivating smart living talents in higher edu...
Innovation for development and cultivating smart living talents in higher edu...Innovation for development and cultivating smart living talents in higher edu...
Innovation for development and cultivating smart living talents in higher edu...European Network of Living Labs (ENoLL)
 
Veodin slide proof manual
Veodin slide proof manualVeodin slide proof manual
Veodin slide proof manualVeodin
 
A demonstration of mushroom cultivation on bracket fungi
A demonstration of mushroom cultivation on bracket fungiA demonstration of mushroom cultivation on bracket fungi
A demonstration of mushroom cultivation on bracket fungiDr. siddhant
 
Diseño de un modelo de calidad en servicio en e-learning
Diseño de un modelo de calidad en servicio en  e-learningDiseño de un modelo de calidad en servicio en  e-learning
Diseño de un modelo de calidad en servicio en e-learningFranco Mana
 
Sistemas solares 2013
Sistemas solares 2013Sistemas solares 2013
Sistemas solares 2013Junkers
 
Ciclo hidrico en cuencas andinas
Ciclo hidrico en cuencas andinasCiclo hidrico en cuencas andinas
Ciclo hidrico en cuencas andinasGidahatari Agua
 
Building Your Roadmap To Agility
Building Your Roadmap To AgilityBuilding Your Roadmap To Agility
Building Your Roadmap To AgilityJason Little
 
Cursos de formación en habilidades directivas en inglés
Cursos de formación en habilidades directivas en inglésCursos de formación en habilidades directivas en inglés
Cursos de formación en habilidades directivas en inglésJaniceHaywood
 

Destaque (18)

Erfolg Ausgabe 01/2010 vom 2.02.2010
Erfolg Ausgabe 01/2010 vom 2.02.2010 Erfolg Ausgabe 01/2010 vom 2.02.2010
Erfolg Ausgabe 01/2010 vom 2.02.2010
 
Presentación coleña
Presentación coleñaPresentación coleña
Presentación coleña
 
Media coverage assocham ladies league celebrating international women's week...
Media coverage  assocham ladies league celebrating international women's week...Media coverage  assocham ladies league celebrating international women's week...
Media coverage assocham ladies league celebrating international women's week...
 
Encimera Smeg SIM562B
Encimera Smeg SIM562BEncimera Smeg SIM562B
Encimera Smeg SIM562B
 
Storyboard of emmerdale storyline
Storyboard of emmerdale storylineStoryboard of emmerdale storyline
Storyboard of emmerdale storyline
 
Innovation for development and cultivating smart living talents in higher edu...
Innovation for development and cultivating smart living talents in higher edu...Innovation for development and cultivating smart living talents in higher edu...
Innovation for development and cultivating smart living talents in higher edu...
 
Veodin slide proof manual
Veodin slide proof manualVeodin slide proof manual
Veodin slide proof manual
 
A demonstration of mushroom cultivation on bracket fungi
A demonstration of mushroom cultivation on bracket fungiA demonstration of mushroom cultivation on bracket fungi
A demonstration of mushroom cultivation on bracket fungi
 
Secretos del Mar
Secretos del MarSecretos del Mar
Secretos del Mar
 
Diseño de un modelo de calidad en servicio en e-learning
Diseño de un modelo de calidad en servicio en  e-learningDiseño de un modelo de calidad en servicio en  e-learning
Diseño de un modelo de calidad en servicio en e-learning
 
Sistemas solares 2013
Sistemas solares 2013Sistemas solares 2013
Sistemas solares 2013
 
Mende ilunak
Mende ilunakMende ilunak
Mende ilunak
 
LATONES
LATONESLATONES
LATONES
 
Training Resource Center Management
Training Resource Center ManagementTraining Resource Center Management
Training Resource Center Management
 
Ciclo hidrico en cuencas andinas
Ciclo hidrico en cuencas andinasCiclo hidrico en cuencas andinas
Ciclo hidrico en cuencas andinas
 
Building Your Roadmap To Agility
Building Your Roadmap To AgilityBuilding Your Roadmap To Agility
Building Your Roadmap To Agility
 
EL MAESTRO CRISTIANO
EL MAESTRO CRISTIANOEL MAESTRO CRISTIANO
EL MAESTRO CRISTIANO
 
Cursos de formación en habilidades directivas en inglés
Cursos de formación en habilidades directivas en inglésCursos de formación en habilidades directivas en inglés
Cursos de formación en habilidades directivas en inglés
 

Semelhante a Alt Story Forms.AMA News

Introduction to Data Visualization
Introduction to Data VisualizationIntroduction to Data Visualization
Introduction to Data VisualizationStephen Tracy
 
Presentation-and-Interpretation-of-Data.pdf
Presentation-and-Interpretation-of-Data.pdfPresentation-and-Interpretation-of-Data.pdf
Presentation-and-Interpretation-of-Data.pdfKrishaMaeGagujas
 
The Data Stroytelling Handbook
The Data Stroytelling HandbookThe Data Stroytelling Handbook
The Data Stroytelling Handbookssuserd075da
 
Graphs represent data in an engaging manner and make c.docx
Graphs represent data in an engaging manner and make c.docxGraphs represent data in an engaging manner and make c.docx
Graphs represent data in an engaging manner and make c.docxshericehewat
 
Statistics, Data Analysis, and Decision Modeling, 5th edition by James R. Eva...
Statistics, Data Analysis, and Decision Modeling, 5th edition by James R. Eva...Statistics, Data Analysis, and Decision Modeling, 5th edition by James R. Eva...
Statistics, Data Analysis, and Decision Modeling, 5th edition by James R. Eva...ssuserf63bd7
 
An Introduction to Data Visualization
An Introduction to Data VisualizationAn Introduction to Data Visualization
An Introduction to Data VisualizationNupur Samaddar
 
How to turn your expert analysis into exceptional reports
How to turn your expert analysis into exceptional reportsHow to turn your expert analysis into exceptional reports
How to turn your expert analysis into exceptional reportsJacob Funnell
 
Data is love data viz best practices
Data is love   data viz best practicesData is love   data viz best practices
Data is love data viz best practicesGregory Nelson
 
Steps for Effective Case Analysis Adapted from Harvard .docx
Steps for Effective Case Analysis  Adapted from Harvard .docxSteps for Effective Case Analysis  Adapted from Harvard .docx
Steps for Effective Case Analysis Adapted from Harvard .docxrjoseph5
 
English grade -8-Quarter 2-Week-1-1.pptx
English grade -8-Quarter 2-Week-1-1.pptxEnglish grade -8-Quarter 2-Week-1-1.pptx
English grade -8-Quarter 2-Week-1-1.pptxChariceLourraineZata
 
Chapter 4 Problem 31. For problem three in chapter four, a teac.docx
Chapter 4 Problem 31. For problem three in chapter four,   a teac.docxChapter 4 Problem 31. For problem three in chapter four,   a teac.docx
Chapter 4 Problem 31. For problem three in chapter four, a teac.docxrobertad6
 
Thinking Passage The Dangers of Ambiguous LanguageKen DavisUn
Thinking Passage The Dangers of Ambiguous LanguageKen DavisUnThinking Passage The Dangers of Ambiguous LanguageKen DavisUn
Thinking Passage The Dangers of Ambiguous LanguageKen DavisUnGrazynaBroyles24
 
Confirming pagesModule 25 Using Visuals 417 In your r.docx
Confirming pagesModule 25 Using Visuals 417  In your r.docxConfirming pagesModule 25 Using Visuals 417  In your r.docx
Confirming pagesModule 25 Using Visuals 417 In your r.docxdonnajames55
 
In Week 1, you chose a topic area and problem or challenge within th.docx
In Week 1, you chose a topic area and problem or challenge within th.docxIn Week 1, you chose a topic area and problem or challenge within th.docx
In Week 1, you chose a topic area and problem or challenge within th.docxEstelaJeffery653
 
AssignmentCoverage by of the news is not carried out by any mono.docx
AssignmentCoverage by of the news is not carried out by any mono.docxAssignmentCoverage by of the news is not carried out by any mono.docx
AssignmentCoverage by of the news is not carried out by any mono.docxrock73
 
Enhancing Research with Statistics
Enhancing Research with StatisticsEnhancing Research with Statistics
Enhancing Research with Statisticskhornberger
 

Semelhante a Alt Story Forms.AMA News (20)

Introduction to Data Visualization
Introduction to Data VisualizationIntroduction to Data Visualization
Introduction to Data Visualization
 
Presentation-and-Interpretation-of-Data.pdf
Presentation-and-Interpretation-of-Data.pdfPresentation-and-Interpretation-of-Data.pdf
Presentation-and-Interpretation-of-Data.pdf
 
The Data Stroytelling Handbook
The Data Stroytelling HandbookThe Data Stroytelling Handbook
The Data Stroytelling Handbook
 
Graphs represent data in an engaging manner and make c.docx
Graphs represent data in an engaging manner and make c.docxGraphs represent data in an engaging manner and make c.docx
Graphs represent data in an engaging manner and make c.docx
 
Statistics, Data Analysis, and Decision Modeling, 5th edition by James R. Eva...
Statistics, Data Analysis, and Decision Modeling, 5th edition by James R. Eva...Statistics, Data Analysis, and Decision Modeling, 5th edition by James R. Eva...
Statistics, Data Analysis, and Decision Modeling, 5th edition by James R. Eva...
 
LIB300 Week 6 Using Visuals
LIB300 Week 6 Using VisualsLIB300 Week 6 Using Visuals
LIB300 Week 6 Using Visuals
 
Report writing
Report writing Report writing
Report writing
 
An Introduction to Data Visualization
An Introduction to Data VisualizationAn Introduction to Data Visualization
An Introduction to Data Visualization
 
How to turn your expert analysis into exceptional reports
How to turn your expert analysis into exceptional reportsHow to turn your expert analysis into exceptional reports
How to turn your expert analysis into exceptional reports
 
Data Visualization
Data VisualizationData Visualization
Data Visualization
 
Data is love data viz best practices
Data is love   data viz best practicesData is love   data viz best practices
Data is love data viz best practices
 
Steps for Effective Case Analysis Adapted from Harvard .docx
Steps for Effective Case Analysis  Adapted from Harvard .docxSteps for Effective Case Analysis  Adapted from Harvard .docx
Steps for Effective Case Analysis Adapted from Harvard .docx
 
English grade -8-Quarter 2-Week-1-1.pptx
English grade -8-Quarter 2-Week-1-1.pptxEnglish grade -8-Quarter 2-Week-1-1.pptx
English grade -8-Quarter 2-Week-1-1.pptx
 
Data Visualization - A Brief Overview
Data Visualization - A Brief OverviewData Visualization - A Brief Overview
Data Visualization - A Brief Overview
 
Chapter 4 Problem 31. For problem three in chapter four, a teac.docx
Chapter 4 Problem 31. For problem three in chapter four,   a teac.docxChapter 4 Problem 31. For problem three in chapter four,   a teac.docx
Chapter 4 Problem 31. For problem three in chapter four, a teac.docx
 
Thinking Passage The Dangers of Ambiguous LanguageKen DavisUn
Thinking Passage The Dangers of Ambiguous LanguageKen DavisUnThinking Passage The Dangers of Ambiguous LanguageKen DavisUn
Thinking Passage The Dangers of Ambiguous LanguageKen DavisUn
 
Confirming pagesModule 25 Using Visuals 417 In your r.docx
Confirming pagesModule 25 Using Visuals 417  In your r.docxConfirming pagesModule 25 Using Visuals 417  In your r.docx
Confirming pagesModule 25 Using Visuals 417 In your r.docx
 
In Week 1, you chose a topic area and problem or challenge within th.docx
In Week 1, you chose a topic area and problem or challenge within th.docxIn Week 1, you chose a topic area and problem or challenge within th.docx
In Week 1, you chose a topic area and problem or challenge within th.docx
 
AssignmentCoverage by of the news is not carried out by any mono.docx
AssignmentCoverage by of the news is not carried out by any mono.docxAssignmentCoverage by of the news is not carried out by any mono.docx
AssignmentCoverage by of the news is not carried out by any mono.docx
 
Enhancing Research with Statistics
Enhancing Research with StatisticsEnhancing Research with Statistics
Enhancing Research with Statistics
 

Mais de Michael Roberts

Mais de Michael Roberts (20)

Republic alt story form guide
Republic alt story form guideRepublic alt story form guide
Republic alt story form guide
 
Video Story Forms
Video Story FormsVideo Story Forms
Video Story Forms
 
Social media policies
Social media policiesSocial media policies
Social media policies
 
Beat mapping
Beat mappingBeat mapping
Beat mapping
 
Five stages of a story
Five stages of a storyFive stages of a story
Five stages of a story
 
Continuous coverage
Continuous coverageContinuous coverage
Continuous coverage
 
Planning & coaching content for multiple platforms
Planning & coaching content for multiple platformsPlanning & coaching content for multiple platforms
Planning & coaching content for multiple platforms
 
Beat Mapping
Beat MappingBeat Mapping
Beat Mapping
 
Skeptical Editing
Skeptical EditingSkeptical Editing
Skeptical Editing
 
Coaching Blogs
Coaching BlogsCoaching Blogs
Coaching Blogs
 
Journalism Education & Define Good
Journalism Education & Define GoodJournalism Education & Define Good
Journalism Education & Define Good
 
Multimedia Planning
Multimedia PlanningMultimedia Planning
Multimedia Planning
 
Define Good
Define GoodDefine Good
Define Good
 
Coaching Print & Online
Coaching Print & OnlineCoaching Print & Online
Coaching Print & Online
 
Five Stages of a Story
Five Stages of a StoryFive Stages of a Story
Five Stages of a Story
 
Cover Breaking News Across Platforms
Cover Breaking News  Across PlatformsCover Breaking News  Across Platforms
Cover Breaking News Across Platforms
 
Slide Show Stories
Slide Show StoriesSlide Show Stories
Slide Show Stories
 
Alternative Story Forms.Oregonian
Alternative Story Forms.OregonianAlternative Story Forms.Oregonian
Alternative Story Forms.Oregonian
 
Training On The Edge Of Change
Training On The Edge Of ChangeTraining On The Edge Of Change
Training On The Edge Of Change
 
Needs Assessment
Needs AssessmentNeeds Assessment
Needs Assessment
 

Último

Call Girls in Faridabad 9000000000 Faridabad Escorts Service
Call Girls in Faridabad 9000000000 Faridabad Escorts ServiceCall Girls in Faridabad 9000000000 Faridabad Escorts Service
Call Girls in Faridabad 9000000000 Faridabad Escorts ServiceTina Ji
 
Authentic No 1 Amil Baba In Pakistan Authentic No 1 Amil Baba In Karachi No 1...
Authentic No 1 Amil Baba In Pakistan Authentic No 1 Amil Baba In Karachi No 1...Authentic No 1 Amil Baba In Pakistan Authentic No 1 Amil Baba In Karachi No 1...
Authentic No 1 Amil Baba In Pakistan Authentic No 1 Amil Baba In Karachi No 1...First NO1 World Amil baba in Faisalabad
 
8377087607 Full Enjoy @24/7 Call Girls in Patel Nagar Delhi NCR
8377087607 Full Enjoy @24/7 Call Girls in Patel Nagar Delhi NCR8377087607 Full Enjoy @24/7 Call Girls in Patel Nagar Delhi NCR
8377087607 Full Enjoy @24/7 Call Girls in Patel Nagar Delhi NCRdollysharma2066
 
定制(UofT毕业证书)加拿大多伦多大学毕业证成绩单原版一比一
定制(UofT毕业证书)加拿大多伦多大学毕业证成绩单原版一比一定制(UofT毕业证书)加拿大多伦多大学毕业证成绩单原版一比一
定制(UofT毕业证书)加拿大多伦多大学毕业证成绩单原版一比一lvtagr7
 
ViP Call Girls In Udaipur 9602870969 Gulab Bagh Escorts SeRvIcE
ViP Call Girls In Udaipur 9602870969 Gulab Bagh Escorts SeRvIcEViP Call Girls In Udaipur 9602870969 Gulab Bagh Escorts SeRvIcE
ViP Call Girls In Udaipur 9602870969 Gulab Bagh Escorts SeRvIcEApsara Of India
 
Hi Class Call Girls In Goa 7028418221 Call Girls In Anjuna Beach Escort Services
Hi Class Call Girls In Goa 7028418221 Call Girls In Anjuna Beach Escort ServicesHi Class Call Girls In Goa 7028418221 Call Girls In Anjuna Beach Escort Services
Hi Class Call Girls In Goa 7028418221 Call Girls In Anjuna Beach Escort ServicesApsara Of India
 
1681275559_haunting-adeline and hunting.pdf
1681275559_haunting-adeline and hunting.pdf1681275559_haunting-adeline and hunting.pdf
1681275559_haunting-adeline and hunting.pdfTanjirokamado769606
 
Call Girls CG Road 7397865700 Independent Call Girls
Call Girls CG Road 7397865700  Independent Call GirlsCall Girls CG Road 7397865700  Independent Call Girls
Call Girls CG Road 7397865700 Independent Call Girlsssuser7cb4ff
 
Kolkata Call Girls Service +918240919228 - Kolkatanightgirls.com
Kolkata Call Girls Service +918240919228 - Kolkatanightgirls.comKolkata Call Girls Service +918240919228 - Kolkatanightgirls.com
Kolkata Call Girls Service +918240919228 - Kolkatanightgirls.comKolkata Call Girls
 
Call Girls Near The Corus Hotel New Delhi 9873777170
Call Girls Near The Corus Hotel New Delhi 9873777170Call Girls Near The Corus Hotel New Delhi 9873777170
Call Girls Near The Corus Hotel New Delhi 9873777170Sonam Pathan
 
Amil Baba in Pakistan Kala jadu Expert Amil baba Black magic Specialist in Is...
Amil Baba in Pakistan Kala jadu Expert Amil baba Black magic Specialist in Is...Amil Baba in Pakistan Kala jadu Expert Amil baba Black magic Specialist in Is...
Amil Baba in Pakistan Kala jadu Expert Amil baba Black magic Specialist in Is...Amil Baba Company
 
Call US '' 8377087607'' !! Call Girls In Model Town Metro (Delhi NCR)
Call US '' 8377087607'' !! Call Girls In Model Town Metro (Delhi NCR)Call US '' 8377087607'' !! Call Girls In Model Town Metro (Delhi NCR)
Call US '' 8377087607'' !! Call Girls In Model Town Metro (Delhi NCR)dollysharma2066
 
Call Girls SG Highway 7397865700 Ridhima Hire Me Full Night
Call Girls SG Highway 7397865700 Ridhima Hire Me Full NightCall Girls SG Highway 7397865700 Ridhima Hire Me Full Night
Call Girls SG Highway 7397865700 Ridhima Hire Me Full Nightssuser7cb4ff
 
Call Girls Near Delhi Pride Hotel New Delhi 9873777170
Call Girls Near Delhi Pride Hotel New Delhi 9873777170Call Girls Near Delhi Pride Hotel New Delhi 9873777170
Call Girls Near Delhi Pride Hotel New Delhi 9873777170Sonam Pathan
 
NO1 WorldWide Amil baba in pakistan Amil Baba in Karachi Black Magic Islamaba...
NO1 WorldWide Amil baba in pakistan Amil Baba in Karachi Black Magic Islamaba...NO1 WorldWide Amil baba in pakistan Amil Baba in Karachi Black Magic Islamaba...
NO1 WorldWide Amil baba in pakistan Amil Baba in Karachi Black Magic Islamaba...Amil baba
 
The Fine Line Between Honest and Evil Comics by Salty Vixen
The Fine Line Between Honest and Evil Comics by Salty VixenThe Fine Line Between Honest and Evil Comics by Salty Vixen
The Fine Line Between Honest and Evil Comics by Salty VixenSalty Vixen Stories & More
 
Call Girls Prahlad Nagar 9920738301 Ridhima Hire Me Full Night
Call Girls Prahlad Nagar 9920738301 Ridhima Hire Me Full NightCall Girls Prahlad Nagar 9920738301 Ridhima Hire Me Full Night
Call Girls Prahlad Nagar 9920738301 Ridhima Hire Me Full Nightssuser7cb4ff
 
Vip Udaipur Call Girls 9602870969 Dabok Airport Udaipur Escorts Service
Vip Udaipur Call Girls 9602870969 Dabok Airport Udaipur Escorts ServiceVip Udaipur Call Girls 9602870969 Dabok Airport Udaipur Escorts Service
Vip Udaipur Call Girls 9602870969 Dabok Airport Udaipur Escorts ServiceApsara Of India
 
Vip Delhi Ncr Call Girls Best Services Available
Vip Delhi Ncr Call Girls Best Services AvailableVip Delhi Ncr Call Girls Best Services Available
Vip Delhi Ncr Call Girls Best Services AvailableKomal Khan
 
Gripping Adult Web Series You Can't Afford to Miss
Gripping Adult Web Series You Can't Afford to MissGripping Adult Web Series You Can't Afford to Miss
Gripping Adult Web Series You Can't Afford to Missget joys
 

Último (20)

Call Girls in Faridabad 9000000000 Faridabad Escorts Service
Call Girls in Faridabad 9000000000 Faridabad Escorts ServiceCall Girls in Faridabad 9000000000 Faridabad Escorts Service
Call Girls in Faridabad 9000000000 Faridabad Escorts Service
 
Authentic No 1 Amil Baba In Pakistan Authentic No 1 Amil Baba In Karachi No 1...
Authentic No 1 Amil Baba In Pakistan Authentic No 1 Amil Baba In Karachi No 1...Authentic No 1 Amil Baba In Pakistan Authentic No 1 Amil Baba In Karachi No 1...
Authentic No 1 Amil Baba In Pakistan Authentic No 1 Amil Baba In Karachi No 1...
 
8377087607 Full Enjoy @24/7 Call Girls in Patel Nagar Delhi NCR
8377087607 Full Enjoy @24/7 Call Girls in Patel Nagar Delhi NCR8377087607 Full Enjoy @24/7 Call Girls in Patel Nagar Delhi NCR
8377087607 Full Enjoy @24/7 Call Girls in Patel Nagar Delhi NCR
 
定制(UofT毕业证书)加拿大多伦多大学毕业证成绩单原版一比一
定制(UofT毕业证书)加拿大多伦多大学毕业证成绩单原版一比一定制(UofT毕业证书)加拿大多伦多大学毕业证成绩单原版一比一
定制(UofT毕业证书)加拿大多伦多大学毕业证成绩单原版一比一
 
ViP Call Girls In Udaipur 9602870969 Gulab Bagh Escorts SeRvIcE
ViP Call Girls In Udaipur 9602870969 Gulab Bagh Escorts SeRvIcEViP Call Girls In Udaipur 9602870969 Gulab Bagh Escorts SeRvIcE
ViP Call Girls In Udaipur 9602870969 Gulab Bagh Escorts SeRvIcE
 
Hi Class Call Girls In Goa 7028418221 Call Girls In Anjuna Beach Escort Services
Hi Class Call Girls In Goa 7028418221 Call Girls In Anjuna Beach Escort ServicesHi Class Call Girls In Goa 7028418221 Call Girls In Anjuna Beach Escort Services
Hi Class Call Girls In Goa 7028418221 Call Girls In Anjuna Beach Escort Services
 
1681275559_haunting-adeline and hunting.pdf
1681275559_haunting-adeline and hunting.pdf1681275559_haunting-adeline and hunting.pdf
1681275559_haunting-adeline and hunting.pdf
 
Call Girls CG Road 7397865700 Independent Call Girls
Call Girls CG Road 7397865700  Independent Call GirlsCall Girls CG Road 7397865700  Independent Call Girls
Call Girls CG Road 7397865700 Independent Call Girls
 
Kolkata Call Girls Service +918240919228 - Kolkatanightgirls.com
Kolkata Call Girls Service +918240919228 - Kolkatanightgirls.comKolkata Call Girls Service +918240919228 - Kolkatanightgirls.com
Kolkata Call Girls Service +918240919228 - Kolkatanightgirls.com
 
Call Girls Near The Corus Hotel New Delhi 9873777170
Call Girls Near The Corus Hotel New Delhi 9873777170Call Girls Near The Corus Hotel New Delhi 9873777170
Call Girls Near The Corus Hotel New Delhi 9873777170
 
Amil Baba in Pakistan Kala jadu Expert Amil baba Black magic Specialist in Is...
Amil Baba in Pakistan Kala jadu Expert Amil baba Black magic Specialist in Is...Amil Baba in Pakistan Kala jadu Expert Amil baba Black magic Specialist in Is...
Amil Baba in Pakistan Kala jadu Expert Amil baba Black magic Specialist in Is...
 
Call US '' 8377087607'' !! Call Girls In Model Town Metro (Delhi NCR)
Call US '' 8377087607'' !! Call Girls In Model Town Metro (Delhi NCR)Call US '' 8377087607'' !! Call Girls In Model Town Metro (Delhi NCR)
Call US '' 8377087607'' !! Call Girls In Model Town Metro (Delhi NCR)
 
Call Girls SG Highway 7397865700 Ridhima Hire Me Full Night
Call Girls SG Highway 7397865700 Ridhima Hire Me Full NightCall Girls SG Highway 7397865700 Ridhima Hire Me Full Night
Call Girls SG Highway 7397865700 Ridhima Hire Me Full Night
 
Call Girls Near Delhi Pride Hotel New Delhi 9873777170
Call Girls Near Delhi Pride Hotel New Delhi 9873777170Call Girls Near Delhi Pride Hotel New Delhi 9873777170
Call Girls Near Delhi Pride Hotel New Delhi 9873777170
 
NO1 WorldWide Amil baba in pakistan Amil Baba in Karachi Black Magic Islamaba...
NO1 WorldWide Amil baba in pakistan Amil Baba in Karachi Black Magic Islamaba...NO1 WorldWide Amil baba in pakistan Amil Baba in Karachi Black Magic Islamaba...
NO1 WorldWide Amil baba in pakistan Amil Baba in Karachi Black Magic Islamaba...
 
The Fine Line Between Honest and Evil Comics by Salty Vixen
The Fine Line Between Honest and Evil Comics by Salty VixenThe Fine Line Between Honest and Evil Comics by Salty Vixen
The Fine Line Between Honest and Evil Comics by Salty Vixen
 
Call Girls Prahlad Nagar 9920738301 Ridhima Hire Me Full Night
Call Girls Prahlad Nagar 9920738301 Ridhima Hire Me Full NightCall Girls Prahlad Nagar 9920738301 Ridhima Hire Me Full Night
Call Girls Prahlad Nagar 9920738301 Ridhima Hire Me Full Night
 
Vip Udaipur Call Girls 9602870969 Dabok Airport Udaipur Escorts Service
Vip Udaipur Call Girls 9602870969 Dabok Airport Udaipur Escorts ServiceVip Udaipur Call Girls 9602870969 Dabok Airport Udaipur Escorts Service
Vip Udaipur Call Girls 9602870969 Dabok Airport Udaipur Escorts Service
 
Vip Delhi Ncr Call Girls Best Services Available
Vip Delhi Ncr Call Girls Best Services AvailableVip Delhi Ncr Call Girls Best Services Available
Vip Delhi Ncr Call Girls Best Services Available
 
Gripping Adult Web Series You Can't Afford to Miss
Gripping Adult Web Series You Can't Afford to MissGripping Adult Web Series You Can't Afford to Miss
Gripping Adult Web Series You Can't Afford to Miss
 

Alt Story Forms.AMA News

  • 1. Understand first, then be understood How clearly do you understand the story? Does the information make sense? Is it logical and believable? What is the context? For example, is the story about an increase in medical errors? Consider this: Illinois has 1,000 medical errors this year. Rhode Island has 500. Does that mean medical errors are more likely to occur in Illinois? Illinois has 10 million medical procedures performed annually while Rhode Island has 2 million procedures performed annually. Illinois’ error rate is 1,000/10,000,000 (or 1 in 10,000) and Rhode Island’s error rate is 500/2,000,000 (or 1 in 4,000). In fact, the error rate for Rhode Island is higher than that for Illinois. Vet and scrutinize the information Is the information reliable? Do you know the source and/or the motivation the source has for supplying the information? Are there holes in the data? Are there odd trends, such as a big jump in numbers for no apparent reason? It’s vital that our readers trust our scrutiny of the data and believe we have presented it faithfully. We should walk away from graphics that lack the data integrity we require. Ask more sophisticated questions to make better graphics. Going back to the medical error exam- ple, consider this: Is a 100% increase in medical errors the result of one additional medical error, or the result of many errors across the country? Does the increase represent a significant increase in errors, or has the error rate gone from one medical error committed last year to two medical errors committed this year? Can you show where errors are occurring? Is there a geographic pocket where they occur more often? Have a point Think clearly about the purpose of this graphic. Some graphics reconstruct tangible images, such as a medical experiment or building layout. Oth- ers illustrate the intangible, such as a budget or a health plan merger. Ask, what exactly do I want the reader to get from this graphic? You should be able to express the answer in one short sentence: I want viewers to see that Medicare pay has been slashed by 25%. Or, that medical errors are most- ly occurring at hospitals in rural areas. Run through seven important questions: n Can we show meaningful comparisons? n Can we offer guidance or tips? n Can we break it down to provide more context? n Does the trend tell the story? n How can we show what words alone can’t easily explain? Graphic handbook AMERICAN MEDICAL NEWS How to make a quality graphic Secondary items that represent data are an essential part of the paper and should receive the same scrutiny as stories. If it involves the explanation or presentation of any sort of data, here are some tips to help it be the best graphic it can be. n Seven questions to ask yourself when creating a graphic n The proofing process n Math concepts every journalist should know PAGE 1
  • 2. n Can we forecast or handicap an issue? n Does the reader need highlights? Talk with others Think about these things, but don’t be alone in the process. It is critical that reporters, editors and art directors sit down and talk about a graphic as it is starting to take shape. Maestro-type discussions should occur. They don’t need to be long. Some may take five minutes or less. The conversation with the art director will help clarify the visual process, and make sure you are presenting the most essential information and balancing the needs of the story with the needs of the secondary elements. Turn in clean copy When you request a graphic, provide all the information necessary for its completion. Too much information is better than not enough. If your story cites a trend, and the accompanying graphic only has information for this year and the last — well, suffice it to say that two numbers do not a trend make. Also consider this: n Spell-check. n Double-check numbers against the original source. n Add numbers to make sure all rows and columns add up as they should. n Treat the graphic the way you would treat a story. Remember: Deadlines, deadlines, deadlines To create a well-thought-out visual presentation, all the information has to be available to the art director in a timely fashion. During the planning process with the topic editor and art director, a deadline will be set based on the complexity of the graphic. But generally, you should plan to file your graphic well before you file the story so the art department has time to work on it and can provide guidance on available space. If the information gets to the art department late, the graphics suffer. How to make a quality graphic Secondary items that represent data are an essential part of the paper and should receive the same scrutiny as stories. If it involves the explanation or presentation of any sort of data, here are some tips to help it be the best graphic it can be. n Seven questions to ask yourself when creating a graphic n The proofing process n Math concepts every journalist should know PAGE 2 Graphic handbook AMERICAN MEDICAL NEWS
  • 3. Seven questions to ask yourself when creating a graphic A graphic should answer one of these important questions. The editor also should be asking these questions of the reporter to decide which type of graphic will aid the telling of a specific story. Stories will be measured against this list during maestros and front page discus- sions, so be prepared. n How to make a quality graphic n The proofing process n Math concepts every journalist should know 1. Can we show meaningful comparisons? Comparisons allow quick and easy scrutiny of related bits of information. Pro/con boxes and tables pairing data across specialties or regions are naturals for this treatment. While other types of boxes allow comparisons, paired data is the primary device we use to draw connections for the reader, based on how the cells of the chart are configured. n Would an advantage/disadvantage box be helpful? n Are there two views on an issue, such as pro/con? n Do the data compare clinical measures? n Can we compare geographically? n Can we compare by specialty? n Can company-to-company or product- to-product comparisons be made? 2. Can we offer guidance or tips? Specificity directly impacts usefulness. When ex- pert guidance is vague, the reader isn’t left with much to act on. These boxes work best as the marching orders with a story of anecdotes and ex- pert commentary. Essential for successful “how- to” features. n Is there a “how to”? n Does another organization have policies our readers can learn from or implement? n Are there guidelines to follow? n Is there list of considerations that would help physicians make a decision? 3. Can we break it down to provide more context? When it’s important to offer greater context than the story’s narrative structure will allow, data- driven treatment can be helpful. The story may focus on the five states leading the charge on a particular issue, while an accompanying map shows what the other 45 are doing. This device is what we use when it’s worth our readers time to know how every slice of the pie measures up. As a national publication with a multispecialty readership, this is a key element for our storytelling. n Can the story address the human side while the graphics address the numbers? n Can you go beyond the summary numbers in a study? n Do national data provide needed context for the story? n Is there something you’ll touch on broadly that can be detailed in a graphic? n What is more important — the percentage of people who fall into a category or the raw number? 4. Does the trend tell the story? A trend chart is intended to speak primarily to changes that happen over time. In some of the more complex trend charts, there may be comparisons among specialties or regions within the plotting, but this more elaborate handling should still underscore a relevant behavior over time. Be aware, though, that in many instances, PAGE 3 Graphic handbook AMERICAN MEDICAL NEWS
  • 4. specific details of the data will be lost in the plotting. For example: A bar measuring 6.3% will look very similar to a bar measuring 6.6%. If that level of precision must be maintained, we often handle the data as a table. The trend is a little harder to detect, but we maintain the nuance that some data sets require. n Can we show the progress of one variable over a long time? n Is the trend as important as the comparison between variables, such as states, specialties or demographics? n Can we show how the gains of one variable impact the losses of another? n Can we add explanations to provide context for trends? 5. Can we show what words alone can’t easily explain? A formula or process presented visually can provide a clearer understanding than a narrative explanation. Flow charts or architectural/ environmental image packages fall into this category. It is difficult to estimate a final size for this graphic element, so good advance planning is essential, both to set a realistic story length and to clarify what should be handled in text and what is addressed graphically. n Are there floor plans, diagrams or before/after visuals that bring an essential aspect to the story? n Is there a mathematical or scientific formula we can show physicians in its pure form? n Is there an example to show, perhaps with commentary? For example, instead of describing the components of a tax form, can you show a sample of a finalized form? 6. Can we forecast or handicap an issue? This is a difficult treatment to pull off, but if our research or access to expertise can lead to a secondary element that quickly handicaps an issue or the players involved, it can be a potent offering. As with tips boxes, specificity is important. The story can handle nuances at greater length while the box gives the scorecard. n Are there projections of things to watch that indicate what could happen on an issue in the future? n Is there a “to-watch” list of people? 7. Does the reader need the highlights? These often come in the form of a bullet box citing significant facts from a report or news event. Be mindful of how much the content overlaps with the story and limit the bulleted points to the most essential or compelling. n Can a policy/bill/case be summarized? n Can a complicated issue be broken down and laid out in a way that makes it easy for the reader to understand? n Is there a bio box on the person we are focusing on in the story? Seven questions to ask yourself when creating a graphic When any graphic is presented, it should answer one of these important questions. If a story lacks a graphic and its omission is not due to space, the editor should be asking these questions of the reporter to decide which type of graphic will aid the storytelling. For maestros and front page discussions, stories will be measured against this list, so be prepared. n How to make a quality graphic n The proofing process n Math concepts every journalist should know PAGE 4 Graphic handbook AMERICAN MEDICAL NEWS
  • 5. Reporting that more businesses are showing interest in preventive medicine programs, this feature targets physicians who might take advantage of the trend by sharing the experiences of those who are doing it now. To accompany another useful graphic, which outlines how to make a wellness program work, this paired data graphic is an important jump-page device to entice skimming readers into the story. By delivering simple comparisons in a familiar advantage/disadvan- tage format, the graphic acts as a box score. Interested readers will turn to the story for more information while those who have read the story will have a handy reminder of the business models discussed. PAGE 5 FOCUS ON PREVENTIVE MEDICINE Wellness programs come in many shapes and sizes, presenting a wide array of business opportunities for physicians. Here are descriptions of a few models: Contracted services An individual physician offers services to a hospital that has created a wellness clinic. You can tailor your own offerings and develop your practice accord- ing to how many wellness patients you want to see. The partnering company handles marketing, billing and other services geared to get the wellness business off the ground. You can maintain your own prac- tice while working with wellness patients for a few hours each week. You also don’t have to worry about marketing the business. You have to do your own sales and marketing. Your schedule is subject to how busy the wellness clinic becomes, and you don’t have as much control as you would if you ran the clinic yourself. You have less control over clinic operations and have to pay a management fee. You may not have the space necessary to accommodate a partnership clinic, or you might have to renovate your current space. Partnership with a management company Developing business- es offers turnkey services to physicians and hospitals for a management fee. ADVANTAGESMODEL DISADVANTAGES Wellness practice A physician group offers wellness services to local businesses. 1 Can we show meaningful comparisons? F or an afternoon every week or two, internist Richard Hilde- brand, MD, practices medicine in a way that would make most physi- cians jealous. As medical director at the Center for Preventive Medicine, part of St. Luke’s Health System in Sioux City, Iowa, Dr. Hildebrand spends two or three hours with the same patient. He focuses not on acute illnesses, but on wellness. He puts the patient through a series of tests, and actually has time to go over results with him or her once they’re completed. “Over time — and I hate to speak for everybody — we’ve gotten used to the appointments every 10 or 20 min- utes,” Dr. Hildebrand said. “This is a nice combination of very old-fash- ioned, but very high-tech. It makes a lot of sense.” Employers think so, too. More com- panies are joining in the wellness trend, sponsoring pre- ventive health pro- grams and asking — or, in some cases, requir- ing — their employees to enroll. Programs range from one-dimen- sional, single-issue pro- grams such as smoking cessation to di- verse, multipurpose strategies that look at a person’s overall health. Sensing a business opportunity, some physicians are starting to adapt their practices to fit this trend as well. Some are providing contracted ser- vices to hospitals, while others are tai- loring wellness programs and market- ing them directly to local businesses. A few doctors even are partnering with fledgling businesses providing turnkey-style support or other ser- vices to help them get their wellness practices off the ground. Regardless of the size of the busi- ness or practice, they have a straight- forward sales pitch to employers: wellness programs will save busi- nesses money. “It saves on insurance costs, and we’ve seen amazing successes in sav- ing people’s jobs from things like ad- dictions, surgeries and life stresses,” said Lee Rice, DO, a family physician and sports medicine specialist in San Diego. Dr. Rice is also CEO and med- ical director of Lifewellness Institute, a preventive medicine practice. “Busi- nesses see employees as their most im- portant asset, and they want their em- ployees to know it,” Dr. Rice said. Employers see corporate wellness programs as a way to both control health care costs and boost key em- ployees’ productivity. The theory is a AMERICAN MEDICAL NEWS AMEDNEWS.COM JUNE 5, 2006 17 BusinessPRACTICE MANAGEMENT n PERSONAL FINANCE n TECHNOLOGY Physicians score victory in class-action compliance settlement [ PAGE 19 ] Businesses are showing more interest in preventive medicine programs, providing a new business opportunity for physicians. Wellnessgoes to work MAKING WELLNESS WORK A 2005 Hewitt Associates survey says employers are developing more of an interest in corporate wellness programs. Here are some reasons why: n Insurance expenses are rising. n Healthy employees are more productive and miss less work time. n It’s a cost-effective way to prove to employees that the company cares for their well-being. Here are some condi- tions that can make wellness programs a good business opportuni- ty for physicians: POPULATION More densely populated areas could provide a large enough pool of people interested in wellness. NUMBER OF BUSINESSES The more corporate clients you can sign up, the greater percentage of your practice you dedicate to wellness. TYPES OF BUSINESSES Large manufacturing facilities might not find all-inclusive programs to be cost-effective, but they could contract for single services, such as nutri- tional counseling or tobacco cessation. Small, self-insured, white-collar businesses, meanwhile, may be interested in comprehensive care. CONTACT WITH DECISION MAKERS If you belong to a local club or know local busi- ness CEOs through work or business circles, you might have a better chance of marketing your wellness services and landing corporate clients. Continued on next page Richard Hildebrand, MD Story by Mike Norbut Photo by Greg Latza
  • 6. n Allows physicians to spot areas that need improvement and lets them use the knowledge to make changes. n Lets payers reward physicians who perform better with more referrals and bonus pay. n Empowers consumers to choose physicians on the basis of both quality and cost, particularly with the number of patients using health savings accounts at 3.2 million and growing. Increased competition for patients will lead to overall quality improvement. n Quality measurement can be inaccurate if it is based on admin- istrative claims data that do not capture the entirety of a patient’s circumstances. n Compliance can be costly. Either a practice must do timely, expensive chart reviews or spend heavily on electronic medical record systems. n Quality measures can unfairly represent physicians’ performance. For example, outcome-based measures can penalize physicians who see patients who are sicker or face economic, cultural and linguistic barriers to complying with doctors’ orders. n When paired with pay-for-performance, quality measurement could merely reward larger practices that have made costly technology investments and practices in higher-income areas. Perversely, quality measurement could divert resources away from already underserved areas. PAGE 6 ASSESSING QUALITY The era of measuring physician performance is likely here to stay. Drawn from a range of perspectives, experts say these are some of the pros and cons of quality measurement. PROS CONS The headline sums up this story well: Quality quandary. Performance measures have doctors up in arms. Some physicians can see benefits if it is done right. Other physicians say the entire idea is flawed. The story focuses on the issue of physicians being worried that quality measures could leave behind the sickest and most vulnerable patients because doctors don’t want to be dinged on quality measures for patients they know won’t improve. The pro/con box that accompanies the story takes a bigger look at the pay-for- performance issue and sums up doctors’ likes and dislikes about being assessed for quality. It sums up concerns in many areas, not just the issue of patient care. 1 Can we show meaningful comparisons? MAY 22/29, 2006 AMEDNEWS.COM AMERICAN MEDICAL NEWS 12 Professional Issues FSMB data show modest dip in disciplinary actions [ PAGE 15 ] HEALTH CARE LITIGATION n MEDICAL EDUCATION n ETHICS n PROFESSIONAL REGULATION C an a number tell the world how good a doctor is? A lot of people are counting on it. The government, health plans and employers are demanding a way to quantify the value they’re getting for their health care dollars. Patients, faced with higher co-pays and deductibles and increasingly invested in health savings accounts, want reliable public ratings of doctors’ performance. Only a third of physicians have access to any data about their own clinical performance, and just a quarter have the electronic medical records systems considered essen- tial for continuous quality improvement, according to a 2003 Commonwealth Fund survey of doctors. Still, a small but growing number of physicians who have assessed the quality of care they deliver as part of maintenance-of-certi- fication and pay-for-performance programs see quality measurement as helpful to care better for their patients. But many physicians, embittered by early and clumsy attempts by outsiders to gauge their performance, have deep concerns about the accuracy and fairness of quality measurement. With more than 100 pay-for-performance programs up and running, according to the Leapfrog Group, and the Centers for Medicare & Medicaid Services asking physicians to voluntarily report quality data, it seems quality measurement is here to stay. Yet as physician groups take over the reins in develop- ing quality measures for payers and the public to use, a quandary presents itself: Could attempts to improve quality by measuring it have the perverse effect of punishing doc- tors who care for the most vulnerable patient populations? Skeptical doctors say the medical experts, academicians, methodologists and statisticians charged with developing quality measures must be mindful of their potential impact on practicing physicians and the patients they serve. Concerns about patient outcomes R andall Maxey, MD, PhD, approves of the quality mea- surement idea in general but worries about whether its use could wind up penalizing physicians who prac- tice in underserved areas. While most measures gauge how often physicians deliver clinically recommended care, a few very important ones hold doctors accountable for their patients’ outcomes. “It’s going to be a lot easier to treat a little old lady from Beverly Hills,” said Dr. Maxey, an Inglewood, Calif., nephrologist who co-chairs the Commission to End Health Care Disparities and a National Medical Assn. former president. “Some communities are more compliant and more health-literate and have more resources to influence outcomes than others. I may treat you exactly correctly and give you the right pills, but if you have to choose be- tween buying pills and giving your baby milk, that drug may lose out and my performance may be judged as poor because of it.” Roy M. Poses, MD, shares Dr. Maxey’s concern. Qquandary Quality PHOTO©JOHNFORASTÉ ASSESSING QUALITY The era of measuring physi- cian performance is likely here to stay. Drawn from a range of perspectives, experts say these are some of the pros and cons of quality measurement. PROS n Allows physicians to spot areas that need improvement and lets them use the knowledge to make changes. n Lets payers reward physicians who perform better with more referrals and bonus pay. n Empowers consumers to choose physicians on the basis of both quality and cost, particularly with the number of patients using health savings accounts at 3.2 million and growing. Increased competition for patients will lead to overall quality improvement. n Quality measurement can be inaccurate if it is based on administrative claims data that do not capture the entirety of a patient’s circumstances. n Compliance can be costly. Either a practice must do timely, expensive chart reviews or spend heavily on electronic medical record systems. n Quality measures can unfairly represent physicians’ performance. For example, outcome-based measures can penalize physicians who see patients who are sicker or face economic, cultural and linguistic barriers to complying with doctors’ orders. n When paired with pay- for-performance, quality measurement could merely reward larger practices that have made costly technology investments and practices in higher-income areas. Perversely, quality measure- ment could divert resources away from already under- served areas. CONS As the movement to measure quality forges ahead, some physicians worry their patients could be left behind. Story by Kevin B. O’Reilly Outcome-based measurements need to control for patient characteristics, said internist Roy M. Poses, MD.
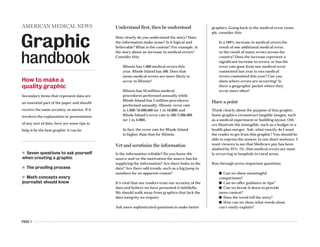
  • 7. PAGE 7 To bring greater clarity to a story about the link between quality and volume in nonsurgical care, this graphic presented valuable data for comparison. It is based on a study of pneumonia patients, and in a simple manner, lays out key findings for four levels of patient volume. A few key findings are explained to set up the top of the story, but it’s the graphic that carries the essential details. 1 Can we show meaningful comparisons? n Doctors say the decision opens the door for “junk science.” AMY LYNN SORREL AMNEWS STAFF If a New York appeals court ruling that loosened rules for expert witness testimony allowed in medical liability cases stands, physicians say it will open the gate for unreliable scientific evidence to enter the courtroom. In a unanimous opinion, the Appel- late Division of the Supreme Court, the state’s intermediate level, said ex- perts did not need to show peer-re- viewed medical literature to prove that their medical opinion was accept- ed in the scientific community. Judges found that a lower court ap- plied the testimony rule “too restric- tively” when it wouldn’t allow the tes- timony and dismissed the case. Physicians say the appeals court ruling defies state precedent uphold- ing rigorous scrutiny of what testimo- ny is permitted to be heard by jurors. If the courts don’t adhere to the stan- dard, physicians say, ripple effects could cause meritless lawsuits to en- ter the legal system. Lawyers for the physician in the case are asking the appeals court to reconsider. If that doesn’t happen, they will ask the state’s high court to overturn the ruling. The medical com- munity has weighed in on the physi- cian’s side, with doctors and a phar- maceutical company fearing that the ruling would be used as an example for other courts to relax the rule if it’s not reversed. “There should be a high standard, and it’s up to the courts to make sure that any medical theory being [pre- sented] actually has the support of the profession,” said Donald Moy, general counsel to the Medical Society of the State of New York, which filed a friend-of-the-court brief with the American Medical Association and Pfizer. The company didn’t manufac- ture the drug in the lawsuit but does not want to see a precedent set. Allowing only peer-reviewed liter- ature is critical, Moy explained, be- cause it is often difficult for a jury to differentiate between credible science and “junk science.” Mary Beth Ott, who represents the plaintiff, said the appeals court ruling is correct, “and that’s the law as it stands now.” Ott declined to comment further, citing the pending litigation. Did a drug trigger a disease? The case, Zito v. Zabarsky, stems from a November 2003 trial court hearing to screen expert witness testimony. New York courts require the testimo- ny with the plaintiff’s filing of a med- ical liability case to determine the va- lidity of claims made. Judges follow the Frye standard, derived from a 1923 federal ruling that established that novel scientific evidence presented in court must “have gained general ac- ceptance” in the relevant scientific community. Pamela Zito sued Queens internist Gary Zabarsky, MD, alleging that he had prescribed her an “excessive” dose of the cholesterol drug, Zocor (simvastatin), which caused her to de- velop an autoimmune disease, court records show. Dr. Zabarsky denies the n For diseases such as pneumonia, higher patient volume could mean worse physician performance. KEVIN B. O’REILLY AMNEWS STAFF Practice makes perfect? Not always. That’s the find- ing of a recent study that sought to find out whether physicians who cared for a higher volume of pneu- monia patients in a given year were more likely to follow quality guidelines and achieve superior outcomes. Hundreds of studies have used patient volume as a proxy in quality measurement for high-risk surgi- cal procedures, such as coronary bypass artery graft or care for complex diseases such as HIV/AIDS. Nearly 70% of studies examining physi- cian performance in those areas found a statistical- ly significant association between higher patient volume and superior outcomes, according to a 2002 medical literature review published in the Annals of Internal Medicine. But the much-touted volume-outcome correla- tion appears to fall apart for care such as pneumo- nia, according to a study published in the Feb. 21 Annals of Internal Medicine. The evaluation of 9,741 doctors who cared for AMERICAN MEDICAL NEWS AMEDNEWS.COM MAY 1, 2006 11 Professional IssuesHEALTH CARE LITIGATION n MEDICAL EDUCATION n ETHICS n PROFESSIONAL REGULATION ETHICS FORUM: Apply standards of care equitably [ PAGE 16 ] Volume-quality correlation not clear cut, study says Continued on page 14 Court lowers bar on scientific evidence CASE AT A GLANCE Pamela Zito v. Gary Zabarsky, MD Venue: New York Supreme Court, Appellate Division, Second Department At issue: Whether medical expert testimony required in medical liability cases must include peer-reviewed literature to show that an opinion is generally accepted by the scientific community. The appeals court said no. Potential impact: Physicians say the ruling goes against precedent, exposing doctors to more lawsuits. The court said a high standard deprives injured plaintiffs of their day in court. Continued on next page New York appeals court ruling “It’s up to the courts to make sure any medical theory ... has support of the profession.” Donald Moy, MSSNY general counsel DISCOUNTING VOLUME Hundreds of studies have found that for complicated surgeries and medical care such as coronary artery bypass grafting or HIV/AIDS care, the higher the volume of cases a physician or hospital sees, the better the outcomes. But for care such as pneumonia, the relationship between the volume of cas- es and physician performance isn’t so clear, according to a recent study of 9,741 doctors who cared for 13,480 patients admitted to hospitals for pneumonia. The study’s authors broke physicians into four groups based on the volume of pneumonia patients they cared for over a year. Here are some of the results: Study groups: 1 2 3 4 Median annual pneumonia cases 4 9 15 29 per physician Percentage of time task performed First antibiotic administered less 59% 63% 62% 62% than four hours after admission Appropriate antibiotics 82% 81% 81% 79% Blood cultures obtained before 84% 84% 84% 83% administration of antibiotics Screened for or given influenza vaccine 21% 19% 20% 12% Screened for or given pneumococcal vaccine 16% 13% 13% 9% Results Mean length of stay (in days) 6.0 6.0 6.2 6.6 Percentage of patients who died 5.8% 6.0% 5.7% 6.6% in the hospital Percentage of patients who died 10.9% 11.8% 11.0% 12.5% within 30 days SOURCE: “VOLUME, QUALITY OF CARE, AND OUTCOME IN PNEUMONIA,” ANNALS OF INTERNAL MEDICINE, FEB. 21 VOLUME OF CASES QUALITY INDICATOR OUTCOMES DISCOUNTING VOLUME Hundreds of studies have found that for complicated surgeries and medical care such as coronary artery bypass grafting or HIV/AIDS care, the higher the volume of cases a physician or hospital sees, the better the outcomes. But for care such as pneumonia, the relationship between the volume of cases and physician performance isn’t so clear, according to a recent study of 9,741 doctors who cared for 13,480 patients admitted to hospitals for pneumonia. The study’s authors broke physicians into four groups based on the volume of pneumonia patients they cared for over a year. Here are some of the results: Study groups: 1 2 3 4 Median annual pneumonia cases 4 9 15 29 per physician Percentage of time task performed First antibiotic administered less 59% 63% 62% 62% than four hours after admission Appropriate antibiotics 82% 81% 81% 79% Blood cultures obtained before 84% 84% 84% 83% administration of antibiotics Screened for or given influenza vaccine 21% 19% 20% 12% Screened for or given pneumococcal vaccine 16% 13% 13% 9% Results Mean length of stay (in days) 6.0 6.0 6.2 6.6 Percentage of patients who died 5.8% 6.0% 5.7% 6.6% in the hospital Percentage of patients who died 10.9% 11.8% 11.0% 12.5% within 30 days SOURCE: “VOLUME, QUALITY OF CARE, AND OUTCOME IN PNEUMONIA,” ANNALS OF INTERNAL MEDICINE, FEB. 21 VOLUME OF CASES QUALITY INDICATOR OUTCOMES
  • 8. PAGE 8 Heart disease kills more women than any other disease. This story focuses on the fact that other diseases are better screened and looks at which women are at the highest risk for heart disease. The graphic shows the five leading causes of death for women and gives context for the story. Easy comparison is drawn from the plotting to emphasize just how many more women die from cardiovascular-related issues than from the second leading cause, cancer. By including factoids on cardiovascular disease, the graphic teases out more statistics about how women are impacted. 1 Can we show meaningful comparisons? SOURCE: CENTERS FOR DISEASE CONTROL AND PREVENTION AND THE NATIONAL HEART, LUNG AND BLOOD INSTITUTE n Cardiovascular disease (CVD) ranks first among all disease categories in hospital dis- charges for women. n Of the approximately 5.5 million stroke survivors alive today, 56% are women. n Misperceptions still exist that CVD is not a real problem for women. n CVD is a particularly important problem among mi- nority women; the death rate due to CVD is higher in black women than in white women. n 38% of women compared with 25% of men will die within one year after a heart attack. SOURCE: AMERICAN HEART ASSN. Cardiovascular death: 484,000 Alzheimer’s disease: 45,000 Diabetes mellitus: 39,000 LEADING CAUSES OF DEATH FOR WOMEN in the United States, 2003 Cancer: 268,000 . . . . . Chronic lower respiratory diseases: 66,000 28 Health&Science Risk of second melanoma is higher than previously thought [ PAGE 33 ] C ardiovascular disease kills nearly twice as many women each year as does cancer, yet annual mammograms and Pap smears continue to be an easier sell than lipid profiles or regular blood pressure tests. Despite years of warnings that women face an even greater risk for cardiovascu- lar disease than men, the word has been slow to filter out. Women and their physi- cians still don’t always acknowledge this threat, nor do they take steps to slow its onset, according to many experts. “It is really impor- tant to keep educating patients and physicians about this being such a devastating illness for women,” said Norma Keller, MD, chief of cardiolo- gy at Bellevue Hospital in New York City. Figures from the Centers for Disease Control and Prevention illuminate the problem. In 2003, 484,000 women died from cardiovascular disease compared with 427,000 men. Cancer, the next highest killer disease for women, claimed 268,000 lives that same year. The challenge for primary care physicians is to pick out women most likely to benefit from treatment, said Lori Mosca, MD, MPH, PhD, director of preventive cardiology at New York-Presbyterian Hospital in New York City and chair of the panel that drafted the American Heart Assn.’s Evidence-based Guidelines for Cardiovascular Disease Prevention in Women. “It is clear we are undertreating very high-risk women and that there are many low-risk women who would be better served by lifestyle changes than drug therapy.” So how to determine which group is which? Go back to the basics, she advises. Evaluating traditional risk factors remains key for prima- ry care physicians, Dr. Mosca said. “We have many physi- cians who have not discussed with their patients their risk factors for heart disease, including lifestyle and family histo- ry.” Instead of preventive care, too many physicians are rely- ing on technology that has not been proven to be associated with beneficial outcomes, she added. Jim King, MD, a family physician in rural Selmer, Tenn., keeps pushing this message to his female patients: “Watch your cholesterol, blood pressure and weight, and don’t smoke.” He notes that risk factors are the same for men and women, although women’s risk starts to increase about 10 years later than men’s. His female patients also are still more afraid of breast cancer. “They have to un- derstand that heart disease is a more important threat.” The highest risk African-American women are at the top of the risk scale for heart disease, but they are the group least likely to be diagnosed and treated effectively, said Patricia Davidson, MD, a cardiologist at Washington Hospital Center in Washington, D.C. “African-Ameri- can along with Mexican-American and Native American women have more risk factors lumped together.” Weight is a problem. Sixty-eight percent of African-American women, 71% of Mexican-American women and 60% of Native Ameri- can women are overweight, she noted. “With weight gain comes insulin resistance, which leads to diabetes, which raises your blood pressure.” The lack of aggressive treatment to goal is another pitfall, Getting to the matter the heartof STORY BY SUSAN LANDERS JUNE 5, 2006 AMEDNEWS.COM AMERICAN MEDICAL NEWS SOURCE: CENTERS FOR DISEASE CONTROL AND PREVENTION AND THE NATIONAL HEART, LUNG AND BLOOD INSTITUTE PUBLIC HEALTH n CLINICAL ISSUES n PATIENTS n Cardiovascular disease (CVD) ranks first among all disease categories in hospital dis- charges for women. n Of the approximately 5.5 million stroke survivors alive today, 56% are women. n Misperceptions still exist that CVD is not a real problem for women. n CVD is a particularly important problem among minority women; the death rate due to CVD is higher in black women than in white women. n 38% of women compared with 25% of men will die within one year after a heart attack. SOURCE: AMERICAN HEART ASSN. Cardiovascular death: 484,000 Alzheimer’s disease: 45,000 Diabetes mellitus: 39,000 LEADING CAUSES OF DEATH FOR WOMEN in the United States, 2003 Cancer: 268,000 . . . . . Chronic lower respiratory diseases: 66,000 PHOTO ILLUSTRATION BY PETE MCARTHUR PHOTOGRAPHY
  • 9. PAGE 9 1 Can we show meaningful comparisons? MEDICATION Methylphenidate, amphetamine, dextroamphetamine Modafinil Growth hormone Testosterone Nicotinic alpha-7 THERAPEUTIC INDICATION Narcolepsy, childhood ADHD Narcolepsy, sleep apnea, shift-work sleep disorder Dwarfism, idiopathic short stature, AIDS- and cancer-related wasting Hypogonadism, andropause Alzheimer’s, schizophrenia ENHANCEMENT USE Intensify mental focus, alertness Combat jet lag, increase wakefulness Delay aging with increased muscle, thicker skin, denser bones, less total body fat Delay aging with increased muscle, denser bones, better mood, higher libido, enhanced cognition Improve memory, psychomotor skills ETHICAL/SOCIAL CONCERNS Social pressures could lead to people using it to be competitive Could lead to compulsory workplace doping to increase effectiveness, safety Could redefine aging as a disease; stigmatize those with short stature Could redefine aging as a disease; pose threat to personal identity Could present a greater danger than enhancement use of stimulants SCOPE OF USE Up to 25% of students at competitive Northeastern universities reported nontherapeutic use of stimulants 90% of prescriptions are for off-label uses About 30% of prescriptions are for off-label uses 500% increase in total testos- terone prescription sales have been seen since 1993 At least 25% of people 85 and older experience dementia; the oldest of the country’s 75 million baby boomers just turned 60 SOURCES: “DRUGS FOR ENHANCING COGNITION AND THEIR ETHICAL IMPLICATIONS: A HOT NEW CUP OF TEA,” EXPERT REVIEW OF NEUROTHERAPEUTICS, MARCH; “PROVISION OR DISTRIBUTION OF GROWTH HORMONE FOR ‘ANTIAGING,’” JOURNAL OF THE AMERICAN MEDICAL ASSOCIATION, OCT. 26, 2005; “RISKS OF TESTOSTERONE-REPLACEMENT THERAPY AND RECOMMENDATIONS FOR MONITORING,” NEW ENGLAND JOURNAL OF MEDICINE, JAN. 29, 2004; “SELECTIVE ALPHA7 NICOTINIC ACETYLCHOLINE RECEPTOR LIGANDS,” CURRENT MEDICINAL CHEMISTRY, VOL. 13, NO. 13, 2006. TREATMENTS TURNED ENHANCEMENTS GRAPHIC REPORTED BY KEVIN B. O’REILLY The story discusses the quandaries emerging as some new treatments intended to heal the sick are also being prescribed to enhance those who are healthy. The table and story work together, with the text handling what experts are saying and the table highlighting the types of drugs being discussed. The heavily-researched table adds a valuable dimension by presenting factors at a level of detail that would have bogged down the story. The final two columns (ethical/social concerns and scope of use) add meaningful content not available in the story and describes the magnitude of the issue. The success of the graphic ultimately rests in its ability to thoroughly present the essential details for a relevant list of drugs. AMERICAN MEDICAL NEWS AMEDNEWS.COM AUGUST 28, 2006 11 Professional Issues North Carolina considers limits on physician role in executions [ PAGE 13 ] HEALTH CARE LITIGATION n MEDICAL EDUCATION n ETHICS n PROFESSIONAL REGULATION TO HEAL, OR TO ENHANCE? L ecturing a group of students last fall, Martha J. Farah, PhD, commented that there was proba- bly someone in the audience making use of modafinil, approved to treat narcolepsy but mostly prescribed off-label to long-haul truckers, jet- lagged ocean hoppers and anyone else too busy to sleep. “You were right about that!” said a graduate student who approached Dr. Farah, director of the University of Pennsylvania’s Center for Cognitive Neuroscience, after the talk. Once a week, said the student, who is also a teaching assistant, he would find himself falling behind on answering e-mail and grading work. With modafinil, he could stay up all night and still work through the next day. Dr. Farah’s observation was far from a shot in the dark. Increasingly, students at highly competitive universities such as Penn are us- ing modafinil, or stimulants intended to treat attention- deficit/hyperactivity disorder, to enhance their already considerable abilities. Some students are asking doc- tors for these so-called smart pills, though most obtain them illegally from campus dealers. College kids aren’t alone in looking to doctors to do more than just cure their ills. Middle-aged men ask physi- cians for testosterone boosters. Some adults even seek growth hormones, one of the engines that allegedly helped Barry Bonds overtake Babe Ruth on baseball’s all- time home run list. But should doctors say yes when patients ask for en- hancement instead of healing? It’s a question that medicine has grappled with on a smaller scale for years. Cosmetic surgery posed similar questions decades ago and continues to outpace med- ically necessary reconstructive surgeries. Peter Kramer’s 1993 book, Listening to Prozac, alerted the nation to patients who sought to feel “better than well.” And it didn’t take long after Viagra’s 1998 approval be- fore some normally functioning men be- gan using the drug to enhance their sexu- al experiences. The question of whether to abide pa- tient requests for enhancement treat- ments will only continue to intensify as new drugs hit the market. For example, Alzheimer’s medication that is in the pipeline could potentially en- hance healthy individuals’ memory. In fact, the potential for genetic enhancement is so great that the National Institutes of Health is funding an investigation of the ethical implications of the re- search. The AMA’s Council on Ethical and Judicial Af- fairs also is studying human enhancement and may is- sue ethical guidelines for physicians. MAKING THE CALL Doctors can be faced with tough choices when patients ask for something to boost their abilities. Franklin G. Miller, PhD, a bioethicist at the National Institutes of Health, and Howard Brody, MD, PhD, a family physician and Michigan State University bioethicist, offer two principles to consider: 1. The more clearly an intervention also serves a legitimate medical goal — such as preventing disease, promoting health, relieving pain and suffer- ing, or avoiding premature death — the more easily it can be justified. 2. The greater the risks involved, the more difficult it is to justify an enhancement intervention in the absence of a clear health rationale. SOURCE: “ENHANCEMENT TECHNOLOGIES AND PROFESSIONAL INTEGRITY,” MAY-JUNE 2005 AMERICAN JOURNAL OF BIOETHICS New treatments intended to heal the sick also may help the healthy flourish. Where should doctors draw the line? STORY BY KEVIN B. O'REILLY ILLUSTRATION BY TED GRUDZINSKI Continued on next page
  • 10. PAGE 10 This story explores a study that concluded doctors like the idea of patient-centered care, but haven’t adopted it. The story touches on highlights from the study, while the graphic allows readers to do comparisons on a couple of levels. First, the graphic shows how three different groupings of physicians ----- primary care, specialists and all physicians ----- have adopted aspects of patient- centered care. It also allows the reader to quickly compare numbers of how many have adopted aspects vs. how many say they plan to. 1 Can we show meaningful comparisons? n A study reaching that conclusion comes as some physician organizations are trying to help practices redesign how they provide care. DAMON ADAMS AMNEWS STAFF Physicians are pretty good at providing same-day appointments for patients who want them. And they usually receive timely test results of patients they referred to another doctor. They don’t do as well at routinely using electron- ic medical records or communicating with patients via e-mail. Those conclusions are based on what 1,837 physi- cians, in practice at least three years, told re- searchers. The nationwide survey led the authors of a new study in the April 10 Archives of Internal Med- icine to find that physicians favor such patient-cen- tered care practices, but few practice all of them. Physicians were asked about 11 patient-centered practices, such as same-day appointments, e-mail with patients, reminder notices for preventive or follow-up care, electronic medical records and patient survey feedback. The study said that about one in four doctors us- es electronic medical records and about half send reminder notices to patients about preventive or fol- low-up care. Three in four primary care physicians had prob- lems with the availability of patients records, test results or other information at the time of a sched- uled visit. But researchers found that doctors favor many elements of patient-centered care. The study said 87% of primary care physicians support improved teamwork among health care professionals while 85% of all surveyed physicians favor easy access to patients of medical records. “They have the right attitude. They thought a team approach to care was a good thing, and they’re planning to look into electronic medical records,” said lead study author Anne-Marie Audet, MD, vice president for quality improvement at the Common- wealth Fund, a private foundation in New York City. New models of care The findings come at a time when some physician organizations are making patient-centered care a key component of efforts to redesign how physi- AMERICAN MEDICAL NEWS AMEDNEWS.COM MAY 15, 2006 9 Professional IssuesHEALTH CARE LITIGATION n MEDICAL EDUCATION n ETHICS n PROFESSIONAL REGULATION Some New York doctors join the Teamsters [ PAGE 14 ] PUTTING IT INTO PRACTICE A new study in the Archives of Internal Medicine found that a majority of physicians like patient-centered care, but have adopted some aspects faster than others. Here is a look at some patient-centered areas and the percentage of physicians who adopted the practices: Doctors favor patient-centered care but haven’t adopted it fully “They thought a team approach to care was a good thing, and they’re planning to look into electronic medical records.” Anne-Marie Audet, MD, Commonwealth Fund SOURCE: “ADOPTION OF PATIENT-CENTERED CARE PRACTICES BY PHYSICIANS,” ARCHIVES OF INTERNAL MEDICINE, APRIL 10 ISSUE. Continued on page 13 100% 90% 80% 70% 60% 50% 40% 30% 20% 10% 100% 90% 80% 70% 60% 50% 40% 30% 20% 10% PRACTICE ADOPTION PRACTICE ATTITUDE A B C D E F n Total physicians n Primary care physicians n Specialists Local hospitals could hold key to boost residencies n Increasing the physician work force means training more residents, and a medical school has found how to do so. MYRLE CROASDALE AMNEWS STAFF After more than 20 years as a practicing gastroen- terologist, Richard Greenwald, MD, is helping turn his community hospital into a teaching institution. This year Dr. Greenwald, now vice president of medical affairs at Boca Raton Community Hos- pital, helped develop a module covering gastroen- terology, the liver and nutrition for medical stu- dents from the new University of Miami School of Medicine program at Florida Atlantic University in Boca Raton. The hospital’s partnership with FAU and the University of Miami to teach med- ical students is the first step in a long-range plan to cultivate more physi- cians for southeast Florida. By 2010, some 100 to 125 medical residents are ex- pected to be training there. Boca Raton Community Hospital may be the first hospital in recent years to take advantage of a little- used opportunity to get Medicare funding for new residencies. Because the hospital has never sponsored a residency, it is eligible for Medicare graduate medical education dollars, money that has been capped for existing programs since 1996. Given concerns that a physician shortage may develop by 2020, Boca Raton could become a mod- el for those looking for ways to expand residen- cies and physician numbers, work-force experts say. Right now, opening residencies at hospitals that haven’t previously had them is the only route to get new government funding. Richard Reynolds, MD, senior vice president of medical advancement at Boca Raton Commu- nity Hospital, wouldn’t be surprised if others fol- lowed his hospital’s lead. “As we look ahead, with the growth and aging of the population, we’re go- ing to have a doctor shortage,” he said. “Current schools are going to expand, and other [communi- ty] hospitals will become teaching hospitals.” Many consider such expansion good news. But if more community hospitals do begin training residents, some say the practice raises a broader policy issue of how to best spend graduate med- ical education dollars. “Hospitals are feeling a need to increase resi- dency size, and they aren’t getting the Medicare funding to do it,” said Karen Fisher, senior asso- ciate vice president of health care affairs at the Assn. of American Medical Colleges. “If commu- nity hospitals are interested in taking on GME, that’s great. However, from a public policy per- spective, wouldn’t it make more sense to expand GME through quality existing programs as well 64 77 58 54 48 57 27 23 28 26 26 26 10 19 6 20 23 19 Continued on page 15 Med schools expanding to meet future demand. Page 17 A | Always or often provide a same-day appointment to a patient who requests one B | Send patients computerized or manual reminder notices about regular preventive or follow-up care C | Use electronic patient medical records routinely or occasionally D | Medical record(s), test results, or other relevant clinical information never or rarely not available at the time of patient’s scheduled visit E | Plan to send reminder notices about regular preventive or follow-up care within the next year F | Plan to use electronic patient medical records within the next year PUTTING IT INTO PRACTICE A new study in the Archives of Internal Medicine found that a majority of physicians like patient-centered care, but have adopted some aspects faster than others. Here is a look at some patient-centered areas and the percentage of physicians who adopted the practices: SOURCE: “ADOPTION OF PATIENT-CENTERED CARE PRACTICES BY PHYSICIANS,” ARCHIVES OF INTERNAL MEDICINE, APRIL 10 ISSUE. 100% 90% 80% 70% 60% 50% 40% 30% 20% 10% 100% 90% 80% 70% 60% 50% 40% 30% 20% 10% PRACTICE ADOPTION PRACTICE ATTITUDE A B C D E F n Total physicians n Primary care physicians n Specialists 64 77 58 54 48 57 27 23 28 26 26 26 10 19 6 20 23 19 A | Always or often provide a same-day appointment to a patient who requests one B | Send patients computerized or manual reminder notices about regular preventive or follow-up care C | Use electronic patient medical records routinely or occasionally D | Medical record(s), test results, or other relevant clinical information never or rarely not available at the time of patient’s scheduled visit E | Plan to send reminder notices about regular preventive or follow-up care within the next year F | Plan to use electronic patient medical records within the next year
  • 11. PAGE 11 The success of this table is largely due to the specificity we provide with the data and how it complements the main story. Allowing the story to focus primarily on the potential versatility of this type of employee, the graphic addresses another key part of the equation: Salary. The graphic offers great depth by showing average salaries based on years of experience as well as geographic region. 1 Can we show meaningful comparisons? A ccording the U.S. Bureau of Labor Statistics, the fastest-growing health profession in the country — the fastest-growing profession, pe- riod — is medical assistant. Physicians such as Catherine Tabb, MD, are one reason why. Dr. Tabb, a solo family physician in Louisville, Ohio, started practice in 1980 with one medical as- sistant. She now has three full-time and three part-time MAs. They’re used for all tasks — front, as well as back office — not performed by her or the practice’s single nurse practitioner. Dr. Tabb likes the flexibility of staff who can assume either front- or back-office duties to make up for vacations or illness. But having people with clinical knowledge at the front desk, making them more useful to patients, is even better. “They can answer basic questions about taking medications without having to transfer the patient to me,” she says. “They help patients decide if they need to come in.” Like most doctors who make extensive use of MAs for clinical tasks, Dr. Tabb believes she’s in no financial position to hire nurses. But more than that, she says, they’re not necessary, particu- larly when most of the clinical work can be handled by MAs. Charles Reed, MD, a pediatrician with 12-doc- tor St. Christopher Pediatric Associates in Philadelphia, says MAs bring versatility atypical of other types of staff. “We can move them from of- fice to office,” he says. “We can use them for clini- cal tasks, and if we need to fill in, we can put them in the front office, registering patients and an- swering phones.” The combination of versatility and compara- tively low cost is driving the demand for MAs, 60% of whom work in physician offices. Accord- ing to an American Assn. of Medical Assistants survey of 4,057 MAs nationwide, 61.6% of an MA’s time is spent on clinical duties, including obtain- ing patient history and vital signs, assisting with patient exams, scheduling patient appointments and performing injections; 25.8% is spent on ad- ministrative duties; 7.3% is taken up with admin- istrative management; and 5.3% is spent on clini- cal management. If they’re certified, MAs make an average salary of $27,951. First-year MAs aver- age $22,650, according to the AAMA. Those in the field say doctors are just begin- ning to tap the potential of MAs. “Only a minority of physician groups know how to utilize MAs and take full advantage of what they can do,” says Don Balasa, AAMA executive direc- tor and chief counsel. But hiring and integrating MAs into your practice is not necessarily an easy task. The duties a me- dial assistant can per- form and the level of su- pervision a physician must provide can vary depending on your state and its regulations. Generally, states define what MAs may or may not do through scope-of-prac- tice laws — if a task is limited to a doctor, nurse practitioner, physician as- sistant or nurse, it’s off- limits to an MA . Finding a qualified MA isn’t easy because of the high demand. Another dif- ficulty is that few have re- ceived certification — estimates are at around 15% — through the AAMA or the American Med- ical Technologists, giving physicians less evi- dence an MA might be up to the job. Hiring an MA P lenty of colleges and institutions offer two- year programs for aspiring MAs. But doctors vary on whether they require certification, which is generally not required by law. Dr. Tabb will hire only certified MAs. Dr. Reed prefers but does not require a candi- date to be certified. He typically hires only candi- dates who have graduated from an accredited post-secondary training program. In fact, most of his hires are candidates who have completed in- ternships in his office. Nick Fabrizio is a consultant with MGMA Con- sulting Group and serves as practice administra- tor for a 12-doctor clinic that is part of the Dept. of Family Medicine at State University of New York Upstate Medical University, Syracuse. He says the best way to find a good MA is to work with a local educational organization that trains them. His group works with Bryant & Stratton College, a community college in Syracuse. By inviting stu- dents to undertake internships at his group, “we get to know the people intimately before we make AMERICAN MEDICAL NEWS AMEDNEWS.COM APRIL 17, 2006 19 BusinessPRACTICE MANAGEMENT n PERSONAL FINANCE n TECHNOLOGY Web site offers list of “average” costs of care [ PAGE 27 ] Medical assistants A key to practice efficiency MAs can be the most versatile members of your staff — if you know how to use them. Continued on next page Story by Larry Stevens and Illustration by Terry Miura MEDICAL ASSISTANT PAY Here are overall and experience-based annual and hourly pay figures from the American Assn. of Medical Assistants’ salary survey on medical assistant compensation. All figures below pertain to certified medical assistants, a designation granted by the AAMA. The national average for noncertified MAs is $26,775, compared with $27,951 for CMAs. Figures are as of 2004, the most recent survey. New England (Conn., Maine, Mass.,N.H., R.I., Vt.) Annual $28,972 $25,056 $25,809 $29,219 $30,576 Hourly $14.49 $12.31 $13.08 $14.69 $15.22 Middle Atlantic (N.J., N.Y., Pa.) $30,451 $24,042 $28,710 $27,167 $32,341 $14.60 $12.96 $14.00 $13.34 $15.45 East North Central (Ill., Ind., Mich., Ohio, Wis.) $26,835 $22,128 $23,939 $25,070 $28,869 $13.27 $11.14 $11.98 $12.80 $14.15 West North Central (Iowa, Kan., Minn., Mo., $27,335 $23,150 $24,477 $26,900 $28,691 Neb., N.D., S.D.) $13.65 $12.04 $12.49 $13.53 $14.25 South Atlantic (Del., Fla., Ga., Md., N.C., S.C., $27,785 $22,922 $24,779 $26,972 $30,218 Va., W.Va., District of Columbia) $13.24 $11.53 $12.14 $13.05 $14.23 East South Central (Ala., Ky., Miss., Tenn.) $26,726 $22,000 $25,750 $25,974 $27,953 $12.69 $10.88 $11.78 $12.30 $13.29 West South Central (Ark., La., Ok., Texas) $29,115 * $24,600 $26,875 $31,152 $13.26 * $12.27 $12.54 $14.16 Mountain (Ariz., Colo., Idaho, Mont., Nev., $27,380 * $24,800 $25,426 $29,494 N.M., Utah, Wyo.) $13.40 * $12.58 $13.08 $13.98 Pacific (Alaska, Calif., Hawaii, Ore., Wash.) $29,995 $27,472 $27,082 $29,468 $31,534 $14.90 $13.76 $14.28 $14.94 $15.42 *INSUFFICIENT RESPONSE NOTE: REGIONS ARE AS DEFINED BY THE U.S. DEPT. OF CENSUS. SOURCE: AMERICAN ASSN. OF MEDICAL ASSISTANTS REGION OVERALL 1–2 3–5 6–9 10 + YEARS YEARS YEARS YEARS
  • 12. PAGE 12 This was an ideal opportunity for a comparative table. The story discusses an international patient survey that showed the U.S. lagging behind five other nations in nearly all areas surveyed. The story described the nature of the survey and provided numerous interesting findings, while the graphic gave side-by-side rankings of the six nations involved. At a glance, the reader can compare rankings for the subcategories that contribute to the overall rank. Any story that relies so heavily on accessible comparisons like these would suffer if it lacked a graphic presentation of the key findings. 1 Can we show meaningful comparisons? n The country was rated first only in effectiveness of care. ELAINE MONAGHAN AMNEWS STAFF Washington Adult patients in the United States are less safe, not as well informed by their doctors and more unequally treated than people in five other developed nations that spend far less treat- ing them, according to two stud- ies released earlier this month by the Commonwealth Fund. America ranked last overall when compared with Australia, Canada, Germany, New Zealand and the United Kingdom in one study, “Mirror, Mirror, on the Wall: An Update on the Quality of American Health Care Through the Patient’s Lens.” This analysis compared U.S. health leaders to the vain queen in “Snow White.” Too often, they excluded experiences of other coun- tries, looking only “at our own reflec- tion in the mirror,” the report states. Based on 2004 and 2005 surveys, it found that American patients were most likely to say they encountered a laboratory test mistake or delay in re- ceiving abnormal results, did not get questions answered by their physi- cian, struggled to get needed care at nights or on weekends, and failed to fill or take prescriptions due to cost. Janet Corrigan, PhD, president and CEO of the National Quality Fo- rum and the National Committee for Quality Health Care, said the study should not be read as an indictment of physicians, but as further evidence of the need to reform the country’s disor- ganized health system. She noted the study’s reliance on patient assess- ments. “You might get different re- sults if you asked physicians or looked at medical records.” The work, which followed an Institute of Medicine framework to evaluate health care system quality, concluded that the Unit- ed States ranked first in six out of 51 indicators, and last or tied for last in 27. Karen Davis, PhD, the fund’s president, described this outcome as “particularly disturbing considering we lead the world in health care spend- ing.” The fund is a private health foundation that supports re- search into improving quality and efficiency. To arrive at its ratings, the study used six categories: l Patient safety addressed wrong drugs or doses, mistakes in care, and delayed or incorrect test results. l Effectiveness included use of mammograms, flu shots, med- ication reviews, diet and exercise advice, hospital infections and follow-up visits. l Patient centeredness exam- ined such issues as doctor communi- cation, choice, time with the physi- cian, pain management and access to records. l Timeliness addressed appoint- ment wait times, emergency depart- ment lines and access to care at irreg- AMERICAN MEDICAL NEWS AMEDNEWS.COM APRIL 24, 2006 5 Florida passes bill limiting doctors’ share of liability [ PAGE 8 ] MEDICARE / MEDICAID n LEGISLATION AND REGULATION n NATIONAL HEALTH POLICY Government&Medicine United States fares poorly in international patient survey Continued on page 7 $40 $0 $60 $80 $100 Expenditures (in billions) ’98 ’99 ’00 ’01 ’02 ’03 ’04 ’05 8.5% growth in 2005 1.5% growth in 1998 n The Centers for Medicare & Medicaid Services also releases its projection of a 4.6% Medicare pay cut for doctors in 2007. DAVID GLENDINNING AMNEWS STAFF Washington Although Medicare spending on physi- cian services did not rise as much last year as it did the year before, the increase was still large enough to catch the attention of federal officials looking to find more efficiency in the system. The Centers for Medicare & Medicaid Services re- cently estimated that spending on physician ser- vices increased by 8.5% during 2005. In 2004, this rate of growth was 11.4%. But the nearly three percentage point drop was not due to patients using fewer or less complex Medicare services. Instead, the change is largely at- tributable to decreased growth in beneficiary enroll- ment, spending shifts stemming from the Medicare drug benefit and lower reimbursement for physi- cian-administered drugs and lab tests, CMS said. All but one percentage point of the 8.5% increase is due to physicians prescribing more services to their Medicare patients and more intensive levels of services. Physicians stepped up both the number and complexity of basic services, such as follow-up visits; minor procedures, such as physical therapy; and screening tests, such as imaging scans. The 16% growth in imaging service expenditures alone, for example, was nearly twice as high as the average rise in spending for all physician services. Doctors’ greater reliance on CT scans and MRIs is one of the biggest spending drivers in this area, the agency said. Such developments worry those who are charged with making sure the program is paying for what it views as the right patient care. “Understanding the relatively rapid growth in these services, and determining whether there are ways to promote better health while slowing the rapid increase in use of these services, is an increas- ingly important issue,” wrote Herb Kuhn, director of CMS’ Center for Medicare Management, in an April 7 letter to the Medicare Payment Advisory Commission. PHYSICIAN SERVICES Medicare expenditures under the physician fee schedule in recent years have increased by large enough percentages to catch the at- tention of federal officials. With preliminary numbers now in for 2005, here’s how spend- ing has gone up over time: SOURCE: CENTERS FOR MEDICARE & MEDICAID SERVICES Medicare physician spending growth worries U.S. officials Continued on next page HIGH SPENDING, LOW SCORE The United States spends more per person on health care than any of the other five countries studied, but it ranks last overall when scores for patient safety, ef- fectiveness, patient-centeredness, timeliness, efficiency and equity are combined. AUSTRALIA CANADA GERMANY NEW UNITED UNITED ZEALAND KINGDOM STATES OVERALL RANKING 4 5 1 2 3 6 Patient safety 4 5 2 3 1 6 Effectiveness 4 2 3 6 5 1 Patient- centeredness 3 5 1 2 4 6 Timeliness 4 6 1 2 5 3 Efficiency 4 5 1 2 3 6 Equity 2 4 5 3 1 6 Per capita health expenditures $2,903 $3,003 $2,996 $1,886 $2,231 $5,635 NOTE: BASED ON 2004 AND 2005 INTERNATIONAL HEALTH POLICY SURVEYS SOURCE: COMMONWEALTH FUND, APRIL HIGH SPENDING, LOW SCORE The United States spends more per person on health care than any of the other five countries studied, but it ranks last overall when scores for patient safety, effectiveness, patient-centeredness, timeliness, efficiency and equity are combined. AUSTRALIA CANADA GERMANY NEW UNITED UNITED ZEALAND KINGDOM STATES OVERALL RANKING 4 5 1 2 3 6 Patient safety 4 5 2 3 1 6 Effectiveness 4 2 3 6 5 1 Patient- centeredness 3 5 1 2 4 6 Timeliness 4 6 1 2 5 3 Efficiency 4 5 1 2 3 6 Equity 2 4 5 3 1 6 Per capita health expenditures $2,903 $3,003 $2,996 $1,886 $2,231 $5,635 NOTE: BASED ON 2004 AND 2005 INTERNATIONAL HEALTH POLICY SURVEYS SOURCE: COMMONWEALTH FUND, APRIL
  • 13. PAGE 13 To balance a story about increases in Medicare Part D prices, this graphic compares information about specific drugs that doctors commonly prescribe. The graphic gives doctors a sense of how many health plans increased the cost of a particular drug, what percent of plans decreased the price and what the median percent change was. The chart worked well because it offered tangible information on drugs that readers commonly prescribe. Had the information been integrated into the story, it would have lost much of its utility. 1 Can we show meaningful comparisons? n Pharmaceutical manufacturers and Medicare drug plans say the studies misrepresent what seniors are actually paying for medications. DAVID GLENDINNING AMNEWS STAFF Washington In the first three months of the Medicare drug benefit, the average wholesale price for roughly 200 of the brand-name drugs most of- ten used by older Americans under- went the single biggest jump in the last six years, according to a recent study by AARP. The average price that drugmakers charged wholesalers for medications increased by 3.9% in the first quarter of the year, four times the rate of gen- eral inflation and the largest quarter- ly increase since AARP began track- ing the figures in 2000. For typical people older than 50 taking four med- ications per day, this means their av- erage annual drug bills increased roughly $240 over the 12 months lead- ing up to the end of March, compared with an increase of roughly $190 dur- ing the previous year. In a separate study, the consumer group Families USA found that Medicare drug plans are responding to the wholesale price increases by boosting what they charge for brand- name medications. For the top 20 drugs prescribed to seniors, the vast majority of Medicare Part D plans quoted higher prices in mid-April than they did in mid-November 2005, when enrollment for the drug benefit began. The study showed that for 15 out of the 20 medications, more than 80% of the plans raised prices over that time period, rather than lowering them or keeping them the same. The median percent change was 3.7%. Both groups said that seniors are being adversely affected because in- surers are passing along the price in- creases to beneficiaries. “Shortly after the [Medicare drug law] was enacted, AARP challenged drug manufacturers to keep the rate of price increase for drugs widely used by older Americans to the rate of general inflation,” the seniors’ group said. “While the rate of increase did slow down beginning in mid-2004, the first quarter 2006 results represent a disturbing reversal of that trend.” Families USA Executive Director Ron Pollack said the data in his group’s report show that federal offi- cials’ assertions about the power of the market to drive prices down are turning out to be wrong. Centers for Medicare & Medicaid Services Ad- ministrator Mark McClellan, MD, PhD, Republican lawmakers and oth- er drug benefit supporters have said that private-sector competition would do a much better job keeping costs in check than government intervention. “At the same time that the Bush ad- ministration and congressional lead- ers are touting the effectiveness of the Medicare drug plans, those plans are quietly raising the prices that they charge,” Pollack said. “As a result, se- niors will pay more and more — as will America’s taxpayers.” Both groups said that allowing the federal government to negotiate with drug companies over the prices they charge, a task that is left to pharmacy benefit managers in the private sec- tor, would help alleviate cost spikes such as the ones seen in recent months. Such direct negotiation, which would require congressional approval, is supported by a range of other groups, including the American Medical Association. More to the story Drug manufacturers and Medicare drug plans challenged both reports, saying that the conclusions were flawed and misleading. Ken Johnson, senior vice president for the Pharmaceutical Research and Manufacturers of America, said that more reliable official government da- ta show recent drug prices tracking the rate of increase in the costs of medical products. Between January and May of this year, that medical in- flation figure was determined to be JULY 10, 2006 AMEDNEWS.COM AMERICAN MEDICAL NEWS 10 Government & Medicine WEBLINKS http://www.familiesusa.org/ resources/publications/reports/ big-dollars-little-sense.html “Big Dollars, Little Sense: Rising Medicare Prescription Drug Prices,” Families USA, June http://www.aarp.org/research/ health/drugs/aresearch- import-869-2004-06--IB69.html “Trends in Manufacturer Prices of Brand Name Prescription Drugs Used by Older Americans — First Quarter 2006 Update,” AARP, June Consumer groups report hike in Medicare Part D drug prices Continued on page 12 PRESCRIPTION DRUG PRICES ON THE RISE In response to recently increased medication prices from pharmaceutical manu- facturers, the vast majority of Medicare drug plans between November 2005 and April 2006 raised their listed prices for the drugs physicians most commonly prescribe to seniors. Here is a sample of those increases: Drug Name % of plans that % of plans that Median percent increased prices decreased prices price change Zocor (40 mg) 100.0% 0.0% 5.7% Fosamax (70 mg) 98.7% 1.3% 4.9% Lipitor (10 mg) 97.3% 2.7% 6.5% Xalatan (0.005 %) 96.8% 3.2% 4.9% Toprol XL (50 mg) 96.2% 3.8% 3.0% Actonel (35 mg) 96.1% 3.9% 4.9% Celebrex (200 mg) 94.8% 5.2% 6.5% Norvasc (5 mg) 94.6% 5.4% 3.2% SOURCE: FAMILIES USA, “BIG DOLLARS, LITTLE SENSE: RISING MEDICARE PRESCRIPTION DRUG PRICES,” JUNE
  • 14. PAGE 14 Although not labeled as a “how to,” this box gives readers tips on how a doctor and patient can challenge an insurer’s decision. Each bullet item begins with a short declarative sentence and is followed by a description of what action to take. It’s a good clip-and-save item, while the story addresses in more depth how physicians could use patients’ help when appealing insurance decisions. 2 Can we offer guidance or tips? How you and your patient can successfully challenge an insurer’s decision: n Appeal every denial. Data show appeals have a high success rate. n Record everything. When you call an insurer for preauthorization or veri- fication of a benefit, make a note of the conversation and the names of people you spoke with. n Send all written correspondence via certified mail and keep records. Time limits can be placed on insurers. Writing things such as, “If you do not respond in five business days it will be as- sumed there are no disputes with the content of this mailing” can sometimes lead to quicker action. n If you don’t get an acceptable answer, go up the chain of com- mand. Copy the plan president with your dispute. For long- standing disputes, send copies of your correspondence to the state insurance commissioner or the state’s attorney’s office. n Get the patient involved. A heartfelt letter explaining how the patient’s life would improve with a certain procedure or treat- ment can be compelling. If you anticipate difficulty, submit the patient’s letter along with the initial claim. n If another physician has more expertise that speaks to the scope of the claim, include a second opinion. n Establish a history with the patient and ensure it is well docu- mented. Insurers place more weight on the opinions of a physi- cian who has an established relationship with the policyholder. n Get the employer or labor union involved. Experts say a com- plaint from an employer who is paying for a large number of in- surance plans gets attention. Share the heavy lifting AMERICAN MEDICAL NEWS AMEDNEWS.COM FEBRUARY 5, 2007 21 BusinessPRACTICE MANAGEMENT n PERSONAL FINANCE n TECHNOLOGY Companies to fund new push for e-prescribing [ PAGE 26 ] Insurance Disputes Patients who deal directly with insurers are often more successful at resolving disputes. But asking a patient to intervene should be a carefully considered decision. Harnessing patient power M ark Granoff, MD, spent more than an hour on the phone with an in- surer trying to get approval for a non-formulary medication. Three separate phone calls and no head- way later, he handed the prover- bial baton to his patient. Dr. Granoff, an internist and geriatrician from Los Angeles, said he generally likes to handle disputes himself. But in cases where he clearly is getting nowhere, the former medical director for Blue Cross of California knows from experience that it’s the patient who holds the power to get things done. Sometimes get- ting the patient involved is key to getting a dis- pute resolved. Insurers “are not anxious to make the pa- tient unhappy,” Dr. Granoff said. “They are the ones paying.” Getting a patient directly involved with in- surance disputes can be tricky and can require some coaching from the physician. But if done at the right time and in an appropriate man- ner, it can pay off. Because patients have been paying more out of pocket for their health care in recent years, some doctors feel patients are more will- ing to fight for benefits. And the time patients spend advocating on their own behalf is time physicians can devote back to patient care. Kathryn Stewart, MD, MPH, a family physi- cian and director of care management at Mt. Sinai Medical Center in Chicago, said she used to spend a lot of time on the phone advocating for patients. “But in this day and age, it’s just not practi- cal for primary care physicians to do that any- more,” Dr. Stewart said. “Doctors are in- creasingly pressed to see more patients, and many are having a difficult time staying out of the red.” While some have taken a proactive ap- proach and gotten the patient involved before a dispute arises, others have found a patient’s voice can be the nudge that results in a change of heart. The people making the decisions “are human, too,” said New York attorney Richard Quadrino, who has represented hundreds of doctors and patients in coverage disputes. When to get patients involved T he choice to get a patient involved should be made judiciously, Quadrino said. “I don’t know if the insurance company re- ally wants to hear from the patient un- less it’s a real medical necessity. And often the doctor can speak to the medical issue.” But Dr. Stewart said having communication between the patient and the insurer can not on- ly result in quicker resolutions to disputes in certain situations, but can also be a good line of defense if the patient is requesting a proce- dure that the doctor knows will not be covered. Because the patient is the client, “it’s really up to the insurance company to explain to the patient why or why not it is being covered,” she said. For example, she recently had a patient who wanted to be transferred to a hospital outside his HMO network. After a fruitless call to the insurer, she told the patient he would have to call the insurer directly if he really thought a transfer should be granted. Jerry Bridge, president of San Diego-based Bridge Practice Management Group, encour- ages physicians to anticipate potential prob- lems and have new patients sign an appeals au- thorization on their first visit. Having that Continued on next page Story by Pamela Lewis Dolan Illustration by Jem Sullivan
  • 15. PAGE 15 According to an IOM panel report, 1.5 million people are harmed annually by medication errors. This story explains the panel’s findings and more importantly, provides something the reader can act on: Guidance on how physicians can reduce some of those errors. Presented under a direct headline, “What you can do to reduce errors,” this box delivers 13 tips from the IOM report in simple, useful language. Many reports and studies outline problems, but no answers. This is a strong example of providing both. A CLOSER LOOK AT THE MONEY Commercial entities — pharmaceuti- cal companies and medical device manufacturers — poured a record amount of money into continuing medical education and related education activities in 2005. Propor- tionally, however, their dollars accounted for a smaller piece of the overall CME n A panel’s report calls on all physicians to prescribe electronically by 2010, but experts say that’s a reach. KEVIN B. O’REILLY AMNEWS STAFF At least 1.5 million people are injured annually by preventable medication errors that occur at every stage of the process, from prescribing to dispensing to patient administration, according to a July Insti- tute of Medicine report. The new report says physicians, nurses, pharma- cists, patients and drugmakers must work together to combat the many factors that contribute to the persistence of these errors, which the IOM earlier reported kill an estimated 7,000 people a year. “The 1999 report [“To Err is Human”] raised awareness about errors in general,” said J. Lyle Bootman, PhD, ScD, co-chair of the IOM Committee on Identifying and Preventing Medication Errors and dean of the University of Arizona College of Pharmacy. “The current report makes clear that we still have a long way to go.” Albert W. Wu, MD, MPH, a panel member and professor of health policy and management and in- ternal medicine at Johns Hopkins University in Baltimore, said the report’s findings make clear that medication errors are the most far-reaching of medical errors. “I’m a patient-safety researcher, and even as we went through the process I was surprised by just how common and how serious a problem this is,” Dr. Wu said. “We all need to wake up and take a part in fixing it.” Most important for physicians, the panel called on all prescribers to have a plan to implement an electronic prescribing system by 2008 and to have such systems in place by 2010. Wilson D. Pace, MD, a panel member and Green- Edelman Chair for Practice-based Research at the University of Colorado, said even the most talented physicians need electronic systems to help them prescribe safely. “With 15,000 medications available, it’s virtually impossible to track all of those anymore just using your memory,” Dr. Pace said. “Electronic prescrib- n But at the local level, some CME providers say they have found that there’s less in the pot for them. MYRLE CROASDALE AMNEWS STAFF Spending on continuing medical edu- cation over a one-year period was up nearly 10% in 2005, to $2.25 billion, but a smaller percentage of that money came from pharmaceutical compa- nies and other commercial interests than in years past, according to the re- cently released 2005 annual report of the Accreditation Council for Contin- uing Medical Education. Commercial interests — drug com- panies and medical device manufac- turers — increased their giving to CME providers to $1.35 billion in 2005 for such items as education grants and exhibit space. But because of increased money from registration fees and noncom- mercial groups, the share of spending by pharmaceutical and device manu- facturers covering CME costs as well as CME-related advertising and ex- hibit fees fell from 62% in 2004 to 60% in 2005. Part of this decrease is also attrib- uted to ACCME changing the defini- tion of commercial support to exclude money or services from nonprofit or government organizations and non- health care-related companies. Increased total spending in 2005 al- so translated into an increased num- ber of total CME activities, with the national specialty societies and large CME providers still capturing a sig- nificant portion of pharmaceutical dollars. Despite the net increase on paper, locally produced CME is facing a re- duction in commercial educational grants as state medical societies and small- and mid-sized hospitals capture a smaller share of commercial CME support, some experts say. With pharmaceutical and device manufacturers the largest contribu- tors to educational activities for prac- ticing physicians, say the experts, this could signal a reduction in the amount of CME available for physi- cians at the local level. Murray Kopelow, MD, ACCME chief executive, said he’s heard from CME providers that commercial CME funding is falling, particularly on the local level, but said the ACCME does not capture data at the local level. AMERICAN MEDICAL NEWS AMEDNEWS.COM AUGUST 21, 2006 9 Professional IssuesHEALTH CARE LITIGATION n MEDICAL EDUCATION n ETHICS n PROFESSIONAL REGULATION Calif. high court shields peer reviewers [ PAGE 13 ] MEDICATION ERRORS ADD UP The toll of preventable medication errors is uncertain, but in a July report, an Institute of Medicine panel estimates that at least 1.5 million people are harmed an- nually by preventable medication errors. Here’s a breakdown of these estimates: 400,000preventable drug-related injuries occur each year in hospitals. It costs an extra $3.5 billion to treat those injuries. 800,000preventable drug-related injuries occur in long-term care settings. 530,000preventable drug-related injuries occur among Medicare recipients in outpatient clinics. In 2000, it cost $887 million to treat those injuries. 25%of all medication errors are due to similar drug names. 33%of drug errors, including 30% of deaths, are due to poor labeling and packaging. E-prescribing urged as one error-prevention strategy More dollars flow into continuing medical education Continued on next page Medication mix-ups prevalent Continued on page 12 $0.0 $0.5 $1.0 $1.5 $2.0 $2.5 2003 2004 2005 BILLIONS OF DOLLARS SPENT $2.25 $2.05 $1.77 60% 62% 65% 35% 38% 40% CME FUNDING Including pharmaceutical and medical device manufacturer spending, physician registration fees and other sources of income. WHERE CME DOLLARS CAME FROM n Commercial entities n Registration fees and other noncommercial CME income HOW COMMERCIAL SPENDING BREAKS DOWN Education, Advertising, Physician fees, grants, support exhibit income other income 2003 55% 10% 35% 2004 52% 10% 38% 2005 50% 10% 40% SOURCE: ACCME 2005 ANNUAL REPORT WHAT YOU CAN DO TO REDUCE ERRORS A July Institute of Medicine report says office-based physicians should take these steps to minimize medication errors: n Put an electronic prescribing plan in place by 2008; implement e-prescribing by 2010. n Reconcile medications at transition points — admission, discharge and transfer. n Create a routine to reconcile medication changes with the pharmacy record. n Keep an accurate medication list for each patient, including over-the-counter and complementary and alternative medications. Ask patients to bring their medications in periodically to keep the list up to date. n Do the following when prescribing new medication: Ask about allergies, inform the patient of indications for all medications, explain common or significant side effects, consult electronic or other reference sources for questions, avoid abbreviations and in- clude patient age and weight when applicable. n Ask regularly whether patients are taking their medications, including as-needed drugs. If they aren’t taking the medication, it may signal that a patient had an adverse reaction to the drug. n Monitor the patient for response to medication therapy and ask regularly about side effects or adverse drug events. n Standardize communication about prescriptions within the practice; standardize and improve handoffs to the primary pharmacist. n Ask the primary pharmacy about the patient’s refill history. n Work as a team with the primary pharmacist and nurses. n Minimize the use of free samples; when dispensing free samples, apply standards similar to those a pharmacy would use. n Exercise particular caution in high-risk situations, such as times when a physician is stressed, sleep-deprived, angry or is supervising inexperienced personnel. n Report errors and adverse drug events to the Medication Errors Reporting Program, jointly run by U.S. Pharmacopeia and the Institute for Safe Medication Practices as well as the appropriate patient-safety organization or authority, depending on the state. 2 Can we offer guidance or tips?
  • 16. PAGE 16 STANFORD’S RULES Medical staff, faculty, students and trainees at the Stanford University School of Medicine, Stanford Hospital and Clinics and the Lucile Packard Children’s Hospital must follow these standards: n No personal gifts of any size from industry, under any circumstances. n No compensation for listening to a sales talk. n No compensation — including defraying costs — for attending a continuing medical education event or other activity, unless an individual is presenting at the event. n No sales representatives in patient-care areas, unless it’s to train staff for research or on how to operate clinical equipment. All visits must be by appointment. n No sales representative visits with physicians without an appoint- ment. These appointments may be made at the physician’s discretion. n No industry support directly to students and trainees. The support must be provided through the school and must be free of any actual or perceived conflict of interest and specifically for educational purposes. SOURCE: STANFORD UNIVERSITY SCHOOL OF MEDICINE 2 Can we offer guidance or tips? For this page 1 story, Stanford is the first school highlighted in an exploration of academic medical centers taking firmer stances against pharmaceutical marketing efforts on campus. It is not until well into the jump that other institutions are discussed at length, so it makes sense that Stanford’s rules get prominence. The guidelines staff and students must follow are already written clearly and make a compelling graphic about real-world expectations. The story gets into the policies of other schools and changes that have come about in response and also offers a graphic on the JAMA article challenging academic medical centers to take the lead on conflict-of-interest reforms. Providing Stanford’s clearly stated guidelines helps the story become more tangible. n Stanford, Yale and the University of Pennsylvania have adopted policies to create a brighter line between medicine and marketing. MYRLE CROASDALE AMNEWS STAFF On Oct. 1, Stanford University School of Medicine in California closed its last avenue for pharmaceutical mar- keting on campus, shutting down drug company freebies no matter what their size. The ban includes everything from free lunches to pens touting the latest medication to hit the market. Also, pharmaceutical sales representatives must make appointments if they want to talk with physicians. The stricter rules come after the school prohibited drug samples several years ago, ex- cept at medical students’ free clinics. Stanford is one of a handful of acad- emic medical centers expanding con- flict-of-interest rules beyond research to include smaller gifts aimed at influ- encing physicians’ clinical practices, namely prescribing. Although there is no hard number on how much is spent, Stanford esti- mates that drug companies lay out about $250,000 annually on meals there. Nationwide, the pharmaceuti- cal industry estimates that it spends $21 billion a year on marketing, though some contend that this figure is too low. “There’s a growing awareness that pharmaceutical promotions subtly, and not so subtly, impact physicians’ decisions,” said internist Clarence Braddock, MD, MPH, an associate professor at Stanford and a member of the Stanford Center for Biomedical Ethics. “Even if [you believe] there’s www.amednews.com AMERICAN MEDICAL NEWS 515 NORTH STATE CHICAGO, IL 60610 ★ ★ ★ CLASSIFIED ADVERTISING – PAGES 37-38 October 9, 2006 VOLUME 49 n NUMBER 38American Medical Souped-up EMR Physicians who want to integrate a patient’s genetic code into treatment using bioinformatics need the technology and ability to analyze the data. In Business, page 21 Specialty hospital fight goes to state’s high court Government & Medicine, page 7 Online prescribing spurs criminal charges Professional Issues, page 16 Hospital competition breeds quality Opinion, page 30 Doctors wary about flu vaccine deliveries Health & Science, page 32 Promise and challenges In the last of a three-part series, doctors try to look beyond today’s crisis and see what lies ahead in fixing the Medicare pay system. In Government & Medicine, page 5 Cancer, families and physicians The book A Lion in the House features insights from parents, doctors and others who cared for five children at a Cincinnati hospital. In Professional Issues, page 12 Restricting drug reps Some medical schools say no to free lunch Physician service growth rate slows, easing Medicare premium increase STANFORD’S RULES Medical staff, faculty, students and trainees at the Stanford University School of Medicine, Stanford Hospital and Clinics and the Lucile Packard Children’s Hospital must follow these standards: n No personal gifts of any size from industry, under any circumstances. n No compensation for listening to a sales talk. n No compensation — including defraying costs — for attending a continuing medical education event or other activity, unless an individual is presenting at the event. n No sales representatives in patient-care areas, unless it’s to train staff for research or on how to operate clinical equipment. All visits must be by appointment. n No sales representative visits with physicians without an appoint- ment. These appointments may be made at the physician’s discretion. n No industry support directly to students and trainees. The support must be provided through the school and must be free of any actual or perceived conflict of interest and specifically for educational purposes. SOURCE: STANFORD UNIVERSITY SCHOOL OF MEDICINE Continued on next page n Meanwhile, beneficiaries with higher incomes will pay bigger premiums next year as the result of a 2003 law. DAVID GLENDINNING AMNEWS STAFF Washington Medicare beneficiaries next year will not see their premiums rise as much as originally thought now that federal officials have downgraded their projections of how much doctor care is costing the program. The standard 2007 monthly premi- um for Medicare Part B, which covers outpatient physician care, will in- crease by $5 to $93.50. The Centers for Medicare & Medicaid Services esti- mated in July that the premium would jump by nearly $10 to $98.40. The new figure will be the smallest in- crease in six years. Beneficiaries will pay less because federal officials have revised the rate at which spending on physician care is increasing, said CMS Administra- tor Mark McClellan, MD, PhD. In par- ticular, the growth rate for physician services in 2005 slowed compared with recent years, altering projec- tions for the future. CMS originally thought that the amount of services that doctors were billing was spiking, but now officials have realized that doctors simply were filing claims more efficiently and re- ceiving payments more quickly. The effect of the higher efficiency made it look to actuaries as if doctors were boosting the total level of care they were prescribing to their patients. The amount that seniors are ex- pected to pay to receive coverage un- der the program is dependent in part on the amount and complexity of ser- vices that doctors provide. Because Part B premiums are calculated to cover 25% of the program’s costs, any increases in physician services result Continued on page 4