9. central y sudamérica
•
0 likes•184 views

This study analyzed 164 Toxoplasma gondii isolates from chickens and cats across 9 countries in Central and South America. Multilocus PCR-RFLP genotyping of 11 genetic markers identified 42 distinct genotypes. There was high genetic diversity within and between populations. The major lineages identified were ToxoDB PCR-RFLP #7, Type III, and Type II. Linkage disequilibrium analysis found evidence of frequent genetic recombination in some populations. Bayesian and phylogenetic network analyses identified at least three main genetic clusters. Overall, the study demonstrated high genetic diversity of T. gondii in Central and South America, with dominance of the Type III and closely related ToxoDB PCR-RFLP #7

Recommended
Recommended
More Related Content
What's hot
What's hot (20)
Viewers also liked
Viewers also liked (20)
Similar to 9. central y sudamérica
Similar to 9. central y sudamérica (20)
Recently uploaded
Recently uploaded (20)
9. central y sudamérica
- 1. Molecular genotyping of Toxoplasma gondii from Central and South America revealed high diversity within and between populations C. Rajendran a , C. Su b , J.P. Dubey a,⇑ a United States Department of Agriculture, Agricultural Research Service, Animal and Natural Resources Institute, Animal Parasitic Diseases Laboratory, Building 1001, Beltsville, MD 20705-2350, USA b Department of Microbiology, The University of Tennessee, Knoxville, TN 37996-0845, USA a r t i c l e i n f o Article history: Received 12 July 2011 Received in revised form 14 December 2011 Accepted 16 December 2011 Available online 29 December 2011 Keywords: Toxoplasma gondii Chicken (Gallus domesticus) Cat (Felis catus) Genetic characterization Genetic diversity Population genetics a b s t r a c t Recent population studies revealed that a few major clonal lineages of Toxoplasma gondii dominate in different geographical regions. The Type II and III lineages are widespread in all continents and dominate in Europe, Africa and North America. In addition, the type 12 lineage is the most common type in wildlife in North America, the Africa 1 and 3 are among the major types in Africa, and ToxoDB PCR–RFLP #9 is the major type in China. Overall the T. gondii strains are more diverse in South America than any other regions. Here, we analyzed 164 T. gondii isolates from three countries in Central America (Guatemala, Nicaragua, Costa Rica), from one country in Caribbean (Grenada) and five countries from South America (Venezuela, Colombia, Peru, Chile, and Argentina). The multilocous polymerase chain reaction–restriction fragment length polymorphism (PCR–RFLP) based genotyping of 11 polymorphic markers (SAG1, SAG2, alt.SAG2, SAG3, BTUB, GRA6, L358, PK1, C22-8, C29-2 and Apico) were applied to 148 free-range chicken (Gallus domesticus) isolates and 16 isolates from domestic cats (Felis catus) in Colombia; 42 genotypes were identified. Linkage disequilibrium analysis indicated more frequent genetic recombination in pop- ulations of Nicaragua and Colombia, and to a lesser degree in populations of Costa Rica and Argentina. Bayesian structural analysis identified at least three genetic clusters, and phylogenetic network analysis identified four major groups. The ToxoDB PCR–RFLP #7, Type III and II were major lineages identified from Central and South America, with high frequencies of the closely related ToxoDB PCR–RFLP #7 and Type III lineages. Taken together, this study revealed high diversity within and between T. gondii populations in Central and South America, and the dominance of Type III and its closely related ToxoDB PCR–RFLP #7 lineages. Ó 2011 Elsevier B.V. All rights reserved. 1. Introduction Toxoplasma gondii is an intracellular protozoan parasite that infects most warm blooded vertebrates including birds and mam- mals. Cats play an important role in the transmission of T. gondii to humans and animals because they are the only hosts that excrete the environmentally resistant oocysts in their feces (Dubey, 2010a). Human become infected by ingesting tissue cysts from undercooked meat, food or water contaminated with oocysts or by accidental ingestion of oocysts from the environment. In general, T. gondii isolates were considered a single species without geographical boundaries, and with little genetic diversity (Dubey and Beattie, 1988; Dardé et al., 1992; Sibley and Boothroyd, 1992; Howe and Sibley, 1995; Dardé, 1996; Ajzenberg et al., 2002a). Based on early molecular genotyping studies, T. gondii iso- lates in North America and Europe have been classified into three genetic types (I, II, III) (Dardé et al., 1992; Howe and Sibley, 1995; Dardé, 1996; Howe et al., 1997; Lehmann et al., 2000; Su et al., 2003). Phenotypically, Type I strains are uniformly lethal to out-bred mice and Type II and III strains are significantly less virulent (Sibley and Boothroyd, 1992; Howe and Sibley, 1995). Studies of human toxoplasmosis in France showed the dominance of Type II strains and Type I infection was rare (Ajzenberg et al., 2002b, 2009; Ajzenberg 2010). Recent studies of T. gondii in human and animals in South America suggested that this parasite is genet- ically diverse (Lehmann et al., 2004, 2006; Dubey et al., 2007a,b, 2008a,b,c; Demar et al., 2007; Pena et al., 2008), and severe toxo- plasmosis in immunocompetent human patients often was associ- ated with atypical genotypes (non-Type I, II and III) in South America (Carme et al., 2002; Delhaes et al., 2010). Other studies showed the dominance of genotype ToxoDB PCR–RFLP #9 (also known as China 1) in China (Dubey et al., 2007c; Zhou et al., 2009; Chen et al., 2011), and high prevalence of Type II, III, Africa 1 and Africa 3 genotypes in Africa (Velmurugan et al., 2008; Mercier et al., 2010; Al-Kappany et al., 2010). 1567-1348/$ - see front matter Ó 2011 Elsevier B.V. All rights reserved. doi:10.1016/j.meegid.2011.12.010 ⇑ Corresponding author. Tel.: +1 301 504 8128; fax: +1 301 504 9222. E-mail address: jitender.dubey@ars.usda.gov (J.P. Dubey). Infection, Genetics and Evolution 12 (2012) 359–368 Contents lists available at SciVerse ScienceDirect Infection, Genetics and Evolution journal homepage: www.elsevier.com/locate/meegid
- 2. Table 1 Summary of genotyping results by countries. SAG1 50 - 30 SAG2 alt.SAG2 SAG3 BTUB GRA6 c22- 8 c29- 2 L358 PK1 Apico ID n = ToxoDB PCR– RFLP genotype# Comments Reference I I I I I I I I I I I RH88 10 Type I Reference II or III II II II II II II II II II II PTG 1 Type II Reference II or III III III III III III III III III III III CTG 2 Type III Reference I II II III II II II u-1 I u-2 I TgCgCa1 66 Atypical Reference u-1 I II III III III u-1 I I III I MAS 17 Atypical Reference I III III III III III I I I u-1 I TgCatBr5 19 Atypical Chile chickens n = 22 I III III III III III III I III III III TgCkCh1 1 14 Genotype previously reported (Pena et al., 2008). II or III II II II II II II II II II I TgCkCh2, 4, 5, 7, 8, 9, 12, 13, 14, 17, 19, 21, 22 13 3 Genotype previously reported (Pena et al., 2008). II or III III III III III III III III III III III TgCkCh3, 15, 18, 20 4 2 Type III II or III II II II II II II II II II II TgCkCh6, 10, 11, 16 4 1 Type II Colombia cats n = 16 I I I I I I II I III I III TgCtCo1 1 28 Genotype previously reported (Dubey et al., 2008c). I I I I I I I I I I I TgCtCo2, 7 2 10 Genotype previously reported (Pena et al., 2008). I III III III I I I III I I III TgCtCo4, 10, 11 3 38 Genotype previously reported (Dubey et al., 2007b). u-1 I II III III III III III I III I TgCtCo5x 1 40 Genotype previously reported (Dubey et al., 2008c). I I II III I III II III III III I TgCtCo3, 9 2 62 This study I I II III I III II III I u-2 I TgCtCo5, 6 2 61 This study I I II III I III II I I u-2 I TgCtCo15 1 101 This study I III III III III III III I III III III TgCtCo14 1 14 Genotype previously reported (Pena et al., 2008). II or III II II II II II II III II II I TgCtCo8 1 128 This study I I I III I III II I III III I TgCtCo12, 13 2 18 Genotype previously reported (Dubey et al., 2007c). Costa Rica chickens n = 32 I I I I I I I III I I III TgCkCr3, 4, 5, 6 4 35 This study I I II I II I I I I u-1 I TgCkCr7, 9, 10 3 43 This study II or III III III III III III III III III III III TgCkCr11 1 2 Type III I I II I I I II I I I I TgCkCr1 1 91 This study I III III III III III III III III III I TgCkCr8, 12, 13, 14, 15, 16, 17, 18, 19, 20, 21, 22, 23, 24, 25, 26, 27 17 7 Genotype previously reported (Dubey et al., 2008c). I I I I III I I I I I III TgCkCr2, 28, 29, 30, 31, 32 6 24 This study Nicaragua chickens n = 44 I I II III III I III I III III I TgCkNi1, 11, 22, 23, 26, 29, 33, 36, 38, 46, 47y 11 16 This study II or III III III III III III III III III III III TgCkNi3, 8, 13, 44, 48, 2x 6 2 Type III II or III III III III III III II III III I III TgCkNi27 1 140 This study I I II III I III II I III u-1 I TgCkNi4, 6, 10, 17, 21, 34, 37 7 23 This study I I II III I III II I III u-1 III TgCkNi35 1 102 This study u-1 I II III I III u-2 I I III I TgCkNi12, 32 2 52 Genotype previously reported (Dubey et al., 2009). I III III III III III III III III III I TgCkNi14, 15, 20, 25, 30 5 7 Genotype previously reported (Dubey et al., 2008c). II or III II II II II II II II I II I TgCkNi18, 39, 42 3 4 Genotype previously reported (Velmurugan et al., 2009; Dubey et al., 2008a; Sundar et al., 2008). II or III III III I III I III III III III III TgCkNi16, 45, 7x 3 50 This study I I I I I I I III I I I TgCkNi7, 9, 40, 41, 43 5 27 This study Grenada II or III III III III III III III III III III TgCkGr12, 16, 23, 24, 29 5 2 Type III 360C.Rajendranetal./Infection,GeneticsandEvolution12(2012)359–368
- 3. chickens n = 9 III I I I I I III II III III I III TgCkGr25, 26 2 13 Genotype previously reported (Dubey et al., 2008c). II or III III III III III III II III III III III TgCkGr17, 18 2 187 This study Argentina chickens n = 10 II or III III III III III III III III III III III TgCkAr2, 6, 24 3 2 Type III I III III III III III III III III III I TgCkAr16, 18 2 7 Genotype previously reported (Pena et al., 2008). I I II III III III I III I II III TgCkAr1 1 11 Genotype previously reported (Pena et al., 2008). I III III III III III III III III III III TgCkAr7 1 48 Genotype previously reported (Dubey et al., 2007a,b,c,d) u-1 I II III III III u-1 I I III I TgCkAr27, 28 2 17 Genotype previously reported (Pena et al., 2008). u-1 I II III III III III I I III I TgCkAr25 1 15 Genotype previously reported (Dubey et al., 2008a,b,c,d) Guatemala chickens n = 3 I III III III III III III III III III I TgCkGa6 1 7 Genotype previously reported (Pena et al., 2008). I III III III I I II III III I III TgCkGa01 1 190 This study I I I I I I II III III I III TgCkGa04 1 191 This study Venezuela chickens n = 7 I III III III III III II III III III III TgCkVe1 1 8 Genotype previously reported (Pena et al., 2008). I III III III III III III III III III III TgCkVe 4, 5, 10 3 48 Genotype previously reported (Dubey et al., 2007a,b,c,d) I III III III III III III I III III III TgCkVe3 1 14 Genotype previously reported (Pena et al., 2008). I III III III I III II III III III III TgCkVe11, 1 116 Genotype previously reported (Dubey et al., 2008c). II or III II II III III II III III III u-2 III TgCkVe6 1 185 This study Colombia chickens n = 16 I III III III I I I III I I III TgCkCo6, 10, 12, 13, 21, 23, 24, 8, 15 9 38 Genotype previously reported (Dubey et al., 2007b). I I II III I III II I III III I TgCkCo20 1 29 Genotype previously reported (Dubey et al., 2007a). I I I I I I II I III I III TgCkCo5 1 28 Genotype previously reported (Pena et al., 2008). I III III III III III III I III III III TgCkCo2 1 14 Genotype previously reported (Pena et al., 2008). I I II III I III I III III III III TgCkCo17, 22 2 179 This study II or III III III III III III III III I I III TgCkCo9 1 188 This study I I I III I III II I I III I TgCkCo4 1 178 This study Peru chickens n = 5 II or III III III III III III III III III III III TgCkPe2 1 2 Type III u-1 I II III III III u-1 I I III I TgCkPe4, 6 2 17 Genotype previously reported (Pena et al., 2008). I III III III I III II III III III III TgCkPe3 1 116 Genotype previously reported (Dubey et al., 2008c). u-1 I II I I I I I I III I TgCkPe5 1 189 This study C.Rajendranetal./Infection,GeneticsandEvolution12(2012)359–368361
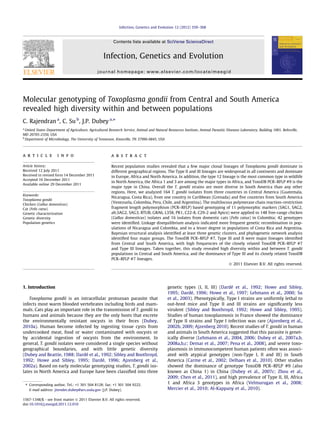
- 4. Existing data suggest T. gondii populations are highly different between North and South America, with a few dominant genotypes in the North, and highly diverse population in the South (Velmur- ugan et al., 2009; Dubey et al., 2008c, 2011; Pena et al., 2008; Khan et al., 2011). At present, there are limited data regarding T. gondii diversity from Central America. In this study we identified 42 genotypes from 164 T. gondii isolates from selected countries from Central America and South America using 11 polymerase chain reaction–restriction fragment length polymorphism (PCR–RFLP) markers. The results showed that populations in Central and South America are diverse except Chile where the Type II and III strains are dominant. 2. Materials and methods 2.1. Revival of T. gondii strains The cryopreserved infected mouse brains or lung tissues from previous studies in our laboratory (Lehmann et al., 2006; Dubey, 2010b) were collected from liquid nitrogen and thawed at 37 °C water bath for few min and an aliquot was seeded onto CV1 cell culture flask (25 cm2 ) and an aliquot was inoculated subcutane- ously into 1–2 gamma interferon gene knock out (KO) mice for the isolation of viable tachyzoites (Dubey, 2010a). Lung tissue of KO mice that died were homogenized in 1 ml of RPMI 1640 medium containing 3% fetal bovine serum and then seeded onto new CV1 cell culture. The expanded tachyzoites from cell cultures were cryopreserved in liquid nitrogen and used to isolate T. gondii genomic DNA for multilocus genotyping studies. A total of 50 T. gondii isolates from previous studies were revived. In brief, nine isolates were isolated from chickens in Gre- nada (Dubey et al., 2005a), three isolates from Guatemala (Dubey et al., 2005b), 10 isolates from chickens in Argentina (Dubey et al., 2003), seven isolates from Venezuela (Dubey et al., 2005c), five isolates from chickens in Peru (Dubey et al., 2004) and 16 isolates from chickens in Colombia (Dubey et al., 2005a,b,c). In addition, DNA samples from previous studies that were genotyped by six of the 11 markers were used to generate complete typing results in this experiment. These samples included 22 isolates from chickens in Chile (Dubey et al., 2006b), 32 isolates from chickens in Costa Rica (Dubey et al., 2006a), 44 isolates from chickens in Nicaragua (Dubey et al., 2006d) and 16 cat isolates from Colombia (Dubey et al., 2006c). A total of 164 T. gondii isolates were analyzed in this study, including 148 chicken and 16 cat isolates. For comparison, one T. gondii population from chickens in Africa (Velmurugan et al., 2008) and two populations from chickens in Brazil (Dubey et al., 2007a) were included as reference populations for analysis. 2.2. DNA extraction and purification Culture-derived tachyzoites of T. gondii isolates were processed for the collection of DNA using the Qiagen DNeasy blood and tissue kit (Qiagen, USA) and with proteinase K to have the final concen- tration of 1 mg/ml. The samples were then incubated at 56 °C in water bath for 3 h and vortexed several times during incubation. Genomic DNA was extracted using elution buffer provided with the kit and the genomic DNA was eluted in 40 ll of elution buffer and stored at À20 °C until use. 2.3. Multilocus PCR–RFLP genotyping The parasite genomic DNA samples were subjected to multilo- cus PCR–RFLP genotyping using 11 molecular markers including SAG1, 50 -30 SAG2, alt.SAG2, SAG3, GRA6, BTUB, C22-8, C29-2, L358, PK1 and Apico (Table 1) with two rounds of amplification. The first round of amplification consisted of external forward and reverse primers of all markers together followed by second round of amplification carried out separately with individual forward and reverses primers (nested PCR) of the particular markers (Su et al., Fig. 1. Map of countries where Toxoplasma gondii isolates were collected. Black dots represent approximate location for sampling. Number of samples collected is listed for each location. 362 C. Rajendran et al. / Infection, Genetics and Evolution 12 (2012) 359–368
- 5. 2010). The reaction volume consisted of 25 ll containing 100 ng genomic DNA with positive control samples. Eight T. gondii strains were included as the positive controls including GT1, PTG, CTG, TgCgCa1, MAS TgCtBr5, TgCtBr64 and TgRsCr1 (Table 1). The PCR reaction composed of 1Â PCR buffer, 0.2 mM of each primer, 200 lM dNTPs, 2 mM MgCl2, 0.2 U of FastStart Taq DNA polymer- ase (Roche-Applied Science, USA). The PCR amplification was per- formed using thermal cycler (PTC 200, Bio-RAD). All samples were incubated at 95 °C for 5 min to activate the DNA polymerase, then 30 cycles of PCR at 95 °C for 30 s, 55 °C for 60 s and 72 °C for 90 s. Similar program was used for the nested PCR. The nested PCR were carried out with the annealing temperature at 60 °C for 60 s for all the markers except Apico, which was amplified at 55 °C for 60 s. Further, the amplified PCR products were subjected to RFLP analysis with suitable restriction enzymes for the analysis of genotyping results. Restriction enzyme digested PCR products were analysed using 2.5% agarose gel for all markers and 3% for Apico and 2% for C29-2 marker, respectively. The gel was run at 100 V for 80 min prior to staining by ethidium bromide (1 mg/ ml) and the gel was observed under ultraviolet light and documented the image for the interpretation of genotyping data. 2.4. Data analysis Multilocus PCR–RFLP typing data was analyzed using several population genetic softwares. Basic statistics, within and between Table 2 Summary of typing results by genotypes. SAG1 50 -30 SAG2 alt.SAG2 SAG3 BTUB GRA6 c22- 8 c29- 2 L358 PK1 Apico n = ToxoDB PCR– RFLP genotype# II II II II II II II II II II II TgCkCh6, 10, 11, 16 4 1 (Type II) II or III III III III III III III III III III III TgCkCh3, 15, 18, 20, TgCkCr11, TgCkNi3, 8, 13, 44, 48, 2x, TgCkGr12, 16, 23, 24, 29, TgCkAr2, 6, 24, TgCkPe2 20 2 (Type III) II or III II II II II II II II II II I TgCkCh2, 4, 5, 7, 8, 9, 12, 13, 14, 17, 19, 21, 22 13 3 (Type II variant) II or III II II II II II II II I II I TgCkNi18, 39, 42 3 4 I III III III III III III III III III I TgCkCr8, 12, 13, 14, 15, 16, 17, 18, 19, 20, 21, 22, 23, 24, 25, 26, 27, TgCkNi14, 15, 20, 25, 30, TgCkAr16, 18, TgCkGa6 25 7 I III III III III III II III III III III TgCkVe1 1 8 I I I I I I I I I I I TgCtCo2, 7 2 10 I I II III III III I III I II III TgCkAr1 1 11 I I I I I III II III III I III TgCkGr25, 26 2 13 I III III III III III III I III III III TgCkCh1, TgCtCo14, TgCkCo2, TgCkVe3 4 14 u-1 I II III III III III I I III I TgCkAr 25 1 15 I I II III III I III I III III I TgCkNi1, 11, 22, 23, 26, 29, 33, 36, 38, 46, 47y 11 16 u-1 I II III III III u-1 I I III I TgCkAr27, 28, TgCkPe4, 6 4 17 I I I III I III II I III III I TgCtCo12, 13 2 18 I I II III I III II I III u-1 I TgCkNi4, 6, 10, 17, 21, 34, 37 7 23 I I I I III I I I I I III TgCkCr2, 28, 29, 30, 31, 32 6 24 I I I I I I I III I I I TgCkNi7, 9, 40, 41, 43 5 27 I I I I I I II I III I III TgCtCo1, TgCkCo 5 2 28 I I II III I III II I III III I TgCkCo20 1 29 I I I I I I I III I I III TgCkCr3, 4, 5, 6 4 35 I III III III I I I III I I III TgCtCo4, 10, 11, TgCkCo6, 8, 10, 12, 13, 15, 21, 23, 24 12 38 u-1 I II III III III III III I III I TgCtCo5x 1 40 I I II I II I I I I u-1 I TgCkCr7, 9, 10 3 43 I III III III III III III III III III III TgCkAr7, TgCkVe4, 5, 10 4 48 II or III III III I III I III III III III III TgCkNi16, 45, 7x 3 50 u-1 I II III I III u-2 I I III I TgCkNi12, 32 2 52 I I II III I III II III I u-2 I TgCtCo5, 6 2 61 I I II III I III II III III III I TgCtCo3, 9 2 62 I I II I I I II I I I I TgCkCr1 1 91 I I II III I III II I I u-2 I TgCtCo15 1 101 I I II III I III II I III u-1 III TgCkNi35 1 102 I III III III I III II III III III III TgCkVe11, TgCkPe3 2 116 II or III II II II II II II III II II I TgCtCo8 1 128 II or III III III III III III II III III I III TgCkNi27 1 140 I I I III I III II I I III I TgCkCo4 1 178 I I II III I III I III III III III TgCkCo17, 22 2 179 II or III II II III III II III III III u-2 III TgCkVe6 1 185 II or III III III III III III II III III III III TgCkGr17, 18 2 187 II or III III III III III III III III I I III TgCkCo9 1 188 u-1 I II I I I I I I III I TgCkPe5 1 189 I III III III I I II III III I III TgCkGa1 1 190 I I I I I I II III III I III TgCkGa4 1 191 164 Isolates. C. Rajendran et al. / Infection, Genetics and Evolution 12 (2012) 359–368 363
- 6. population diversity, linkage disequilibrium were analyzed by Arlequin v3.5 (Excoffier and Lischer, 2010). For these analyses, multilocus PCR–RFLP typing data was coded for all genetic loci. For a given locus, presence or absence of DNA restriction fragments were coded with 1s and 0s, respectively. Therefore, a string of 1s and 0s were used to represent DNA banding pattern of an allele for a locus. For example, at locus PK1, alleles I, II, III, u-1, u-2 and u-3 were coded as 1001000101, 0000111101, 1000010101, 0100000110, 0100010101 and 0010010110, respec- tively. To analyze by Arlequin, the data type was set as ‘‘haplo- typic’’ data, and the data form was set as ‘‘Standard’’ which compares the data for their content at each locus without taking special consideration about the nature of the alleles. Phylogenetic network of all unique genotypes were inferred by SplitsTree v4.4 (Huson and Bryant, 2006) using the genotyping data coded as above. Standardized index of association IsA for each population was calculated by LIAN v. 3.5 (Haubold and Hudson, 2000). Clustering analysis was carried out using STRUCTRURE v2.3.3 (Pritchard et al., 2000). Ten replicate simulations were conducted for each of K = 1 to K = 10 using a length of burn-in of 104 and 104 replicates of Markov Chain Monte Carlo simulation. The simulation was conducted using the linkage model for estimating the ancestral populations. The natural log probability of data under a given mod- el was estimated for ln P(D/K). The DK value for clustering was determined to infer the best K value for clustering using CorrSieve (Campana et al., 2010), the result was processed by CLUMPP v1.1.2 (Jakobsson and Rosenberg, 2007) and the graph was generated by Distruct v1.1 (Rosenberg, 2004). 3. Results The 164 samples analyzed here were divided into 10 populations based on countries and animal hosts in Central and South America (Fig. 1, Table 1) and were identified by PCR–RFLP typing (Table 2). Each genotype was compared to ToxoDB genotyping database (ToxoDB.org), and designated with the matching ToxoDB PCR–RFLP genotype # (Tables 1 and 2). New genotypes are assigned to new ToxoDB genotype # and deposited to the database for future Table3 BasicstatisticsofToxoplasmapopulationsfromCentralandSouthAmerica. Argentina Cks ChileCksPeruCksColombia Cats Colombia Cks Venezuela Cks Costa RicaCks Nicaragua Cks Guatemala Cks Grenada Cks Brazil PACksa Brazil RSCksa AfricaCksb No.ofisolates1022516167324439151919 No.ofhaplotypes6441075610331174 No.ofloci10101010101010101010101010 No.ofpolym.loci710910107101076101010 Genediversity(haplotype)0.889±0.0750.610±0.0930.900±0.1610.942±0.0360.692±0.1240.857±0.1370.677±0.0740.875±0.0241.000±0.2720.667±0.1320.952±0.0400.819±0.0630.509±0.117 Meannumberofpairwise differenceoverloci 3.533±1.9473.645±1.9125.400±3.0815.217±2.6513.550±1.8952.191±1.3584.611±2.3185.163±2.5444.667±3.0492.500±1.4720.554±0.3150.424±0.2450.409±0.238 IsA 0.2130.8170.2900.1530.2520.1350.5440.251nd0.4310.1190.3430.784 P-valueofIsA <0.001<<0.0010.002<0.001<0.0010.02<0.001<0.001nd<0.001<0.001<0.001<<0.001 IsA foreachpopulationisdeterminedbyLIANv3.5. a Datafrompreviouslypublishedreport(Dubeyetal.,2007a). b Datafrompreviouslypublishedreport(Velmuruganetal.,2008). Population pairwise Fst Fst 0.5 0.4 0.3 0.2 0.1 0.0 Costa Rica cks Nicaragua cks Guatemala cks Colombia cats Colombia cks Venezuela cks Grenada cks Chile cks Argentina cks Peru cks Brazil PA cks Brazil RS cks Africa cks Costa Rica cks Nicaragua cks Guatemala cks Colombia cats Colombia cks Venezuela cks Grenada cks Chile cks Argentina cks Peru cks Brazil PA cks Brazil RS cks Africa cks CostaRicacks Nicaraguacks Guatemalacks Colombiacats Colombiacks Venezuelacks Grenadacks Chilecks Argentinacks Perucks BrazilPAcks BrazilRScks Africacks CostaRicacks Nicaraguacks Guatemalacks Colombiacats Colombiacks Venezuelacks Grenadacks Chilecks Argentinacks Perucks BrazilPAcks BrazilRScks Africacks Fig. 2. Pairwise Fst of 10 sample populations and three reference populations. Comparison of populations were conducted using Arlequin ver 3.5. The heat map indicates the Fst value. 364 C. Rajendran et al. / Infection, Genetics and Evolution 12 (2012) 359–368
- 7. reference. Of these 164 isolates, 42 different genotypes were identi- fied. Among these 42 different genotypes, ToxoDB #7 (n = 25), ToxoDB #2 (Type III, n = 20), and ToxoDB #3 (variant of Type II, n = 13) are the three most prevalent genotypes. 1.5 1.5 Colombia cats, n 16 haplotypes 10 Nicaragua cks, 44 h l t 10 1.5 Colombia cks 16 h l t 7 1.0 1.0 n=16, haplotypes=10 n=44, haplotypes=10 1 0 1.5 n=16, haplotypes=7 0.5 0 50 5 1.0 ax 0.0 0 0 0.5 0 0 0.5 Dma -0.5 0 5 0.0 0 5 0.0 ’=D/D -1.0 1 0 -0.5 1 0 -0.5 D’ -1.5 0 -1.0-1.0 1.5 0 200 400 -1.5 0 200 400 -1.5 0 200 400 0 200 400 A i k 0 200 400 Chil kC Ri k 1.5 Argentina cks, n=10 haplotypes=6 1.5 Chile cks, n=22 haplotypes=4 1.5 Costa Rica cks n=32 haplotypes=6 1.0 n=10, haplotypes=6 1.0 n=22, haplotypes=4 1.0 n=32, haplotypes=6 0.50.50.5 max 0.00.00.0 D/Dm -0.5-0.5-0.5 D’=D -1.0-1.0-1.0 D -1.5-1.5-1.5 0 200 4000 200 4000 200 400 1.5 1.5 1 5 Africa cks,Brazil RS cks,Brazil PA cks, h l 1.0 1.0 1 0 1.5 , n=19, haplotypes=4n=19, haplotypes=7n=15, haplotypes=11 0.5 0.5 0 5 1.0 max 0 0 0.5 0.0 0 0 0.5 /Dm -0 5 0.0 -0.5 -0 5 0.0 D’=D/ 1 0 -0.5 -1.0 -1 0 -0.5 D 1 5 -1.0 -1.5 -1 5 -1.0 -1.5 0 200 400 0 200 400 -1.5 0 200 4000 200 400 Fig. 3. Distribution of D0 = D/Dmax within populations. Populations that have 10 or more Toxoplasma gondii isolates were analyzed for linkage disequilibrium D0 . D0 = À1 or 1 suggests strong disequilibrium, whereas D0 = 0 suggests complete equilibrium. X-axis represents the number of comparisons among alleles between polymorphic loci. K Mean lnP(D/K) ΔK /K)P(D/ K lnP ΔK eanMe Argentina Chile Peru Colombiacats ColombiaCks Venezuela CostaRica Nicaragua Guatemala Grenada A B Fig. 4. Clustering analysis of Toxoplasma populations. (A) Analysis of ln P(D/K) and DK. At K = 3, the mean posterior probability of data ln P(D/K) approaches the plateau, the rate of change in the log probability of data between successive K values (DK) also reaches the peak point. Taken together, K = 3 is the best estimation of ancestral clusters for the populations studied. (B) Structures of the 10 Toxoplasma populations. It is shown that Chile chicken population is different from all other populations. C. Rajendran et al. / Infection, Genetics and Evolution 12 (2012) 359–368 365
- 8. Basic statistics, within and between population diversity, link- age disequilibrium were analyzed on haplotype data by Arlequin v3.5 (Excoffier and Lischer, 2010). Analyses of the 10 sample popu- lations and three reference populations are summarized in Table 3. Fst values of pairwise comparison of the 13 populations were summarized in Fig. 2. The results showed high diversity within and between populations. Haplotype diversity within the popula- tions from the order of high to low is: Guatemala > Brazil PA > Colombia cat > Peru > Argentina > Nicaragua > Venezuela > Brazil RS > Colombia chickens > Costa Rica > Grenada > Chile > Africa. The mean number of pairwise difference among loci within population from high to low is: Brazil PA > Peru > Colombia cat > Nicara- gua > Guatemala > Costa Rica > Brazil RS > Africa > Chile > Colom- bia chicken > Argentina > Grenada > Venezuela. Fst values of pairwise comparison of the 13 populations (Fig. 2) showed that Chile chicken population is highly different from all other popula- tions. The two Colombia populations (chicken and cat) do not show statistic difference (at P = 0.01). To determine allelic linkage disequilibrium among different loci, distribution of D0 = D/Dmax within populations that have 10 or more isolates was analyzed by Arlequin v3.5 (Fig. 3). Populations with less than 10 isolates were not used because small sample size maybe more sensitive to variation and less meaningful. Linkage disequilibrium among multiple loci was also analyzed using stan- dardized index of association (IsA ) (Haubold and Hudson, 2000), the results are summarized in Table 3. Linkage disequilibrium analysis of D0 values and IsA showed comparable results among the populations. IsA quantifies the strength of linkage disequilib- rium among different genetic loci. IsA = 1 indicates complete link- age disequilibrium, whereas IsA = 0 indicates complete linkage equilibrium (Haubold and Hudson, 2000). Both methods identified strong linkage disequilibrium in Chile chicken isolates (D0 = À1 or 1, IsA = 0.817), followed by Africa chicken isolates (IsA = 0.784) (Fig. 3. Table 3), suggesting both have a clonal population struc- ture. Both methods also identified low linkage disequilibrium in Colombia cat isolates, Nicaragua and Brazil PA chicken isolates (D0 with high frequency of values close to 0, IsA with low values, Fig. 3, Table 3), indicating high frequency of genetic recombination in these populations. Colombia, Argentina and Brazil RS chicken isolates have medium to high frequency of low D0 values among polymorphic loci of RFLP markers (Fig. 3), and medium to low IsA values (0.252, 0.213 and 0.343, respectively, Table 3) indicating frequent genetic recombination within these populations. Costa Rica chicken population has medium level of low D0 values, and relatively high IsA (0.544), indicate relatively infrequent genetic exchange within its population. Due to small sample sizes (less than 10 isolates) in Grenada, Guatemala, Venezuela and Peru, link- age equilibrium analysis of these locations may not be informative. Structure analysis identified K = 3 to be the best estimation of ancestral populations from these 164 T. gondii samples (Fig. 4A). At K = 3, the mean posterior probability of data ln P(D/K) approxi- mately reaches the plateau, whereas the DK, the rate of change in the log probability of data between successive K values, also reaches the peak point. Using K = 3 for the estimation of ancestral clusters, genetic structure for each population is inferred and pre- sented in Fig. 4B. It is shown that most of these populations are made of two of the three clusters (represented by red and blue clusters). However, the Chile chicken population is unique in that the third cluster (green) dominates. This cluster is represented by the clonal Type II strains. Phylogenetic network of all unique genotypes were inferred by SplitsTree v4.4 (Huson and Bryant, 2006). The network analysis of #1, PTG, TgCkCh6, 10, 11, 16 #3, TgCkCh2 , 4, 5, 7, 8, 9, 12, 13, 14, 17, 19, 21, 22 #128, TgCtCo8 #4, TgCkNi18, 39, 42 #66, TgCgCa1 #185, TgCkVe6 #11 (BrII), TgCkAr1 #40, TgCtCo5x #15, TgCkAr25 #17, M AS,TgC kAr27,28, TgC kPe4,6 #52,TgCkNi12,32 #61,TgCtCo5,6 #101,TgCtCo15#23,TgCkNi4,6, 10,17,21,34,37 #102,TgCkNi35 #179,TgCkCo17,22 #62,TgCtCo3,9 #29,TgCkCo20 #18,TgCtCo12,13 #178,TgCkCo4 #19, TgCatBr5 #38, TgCtCo4, 10, 11, TgCkCo6, 8, 10, 12, 13, 15, 21, 23, 24 #190, TgCkGa1 #116, TgCkVe11, TgCkPe3 #8 (BrIII), TgCkVe1 #7 #7: TgCkCr8, 12, 13, 14, 15, 16, 17, 18, 19, 20, 21, 22, 23, 24, 25, 26, 27, TgCkNi14, 15, 20, 25, 30, TgCkAr16, 18, TgCkGa6 #48, TgCkAr7, TgCkVe4, 5, 10 #14 #188, TgCkCo9#2 #2: CTG, TgCkCh3, 15, 18, 20, TgCkCr11, TgCkNi3, 8, 13, 44, 48, 2x, TgCkGr12, 16, 23, 24, 29, TgCkAr2, 6, 24, TgCkPe2 #187, TgCkG r17, 18 #140,TgCkNi27 #50, TgCkNi16,45,7x #13, TgCkG r25, 26 #191,TgCkG a4 #28,TgCtCo1, TgCkCo5 #10,RH88,TgCtCo2,7 #27, TgCkNi7, 9, 40, 41, 43 #35, TgCkCr3, 4, 5, 6 #91, TgCkCr1 #189, TgCkPe5 #43, TgCkCr7, 9, 10 #16, TgCkNi1, 11, 22, 23, 26, 29, 33, 36, 38, 46, 47y #14, TgCkCh1, TgCtCo14, TgCkCo2, TgCkVe3 #24,TgCkCr2,28, 29,30,31,32 Group 1 n=27 Group 3 n=76Group 2 n=22 Group 4 n=28 Fig. 5. Phylogenetic network analysis of Toxoplasma from Central and South America. From the 164 samples, 42 genotypes were identified. These genotypes are divided into four major groups. Populations with n P 10 are color coded: Nicaragua Cks – red; Chile Cks – green; Costa Rica Cks – blue; Colombia Cks – magenta; Colombia Cats –purple; Argentina Cks – brown. Reference strains were underlined. (For interpretation of the references to colour in this figure legend, the reader is referred to the web version of this article.) 366 C. Rajendran et al. / Infection, Genetics and Evolution 12 (2012) 359–368
- 9. the 164 isolates is summarized in Fig. 5. A total of 42 genoytpes were identified and these genotypes are divided into four major groups (Fig. 5). This result indicated high diversity of T. gondii strains. Groups 1, 2, 3 and 4 have 27, 22, 76 and 28 isolates, respec- tively. The clonal Type I, II and III lineages are associated with Groups 1, 2 and 3, respectively. Analysis of the data revealed no association of genotypes with geographical locations in the popu- lations investigated. 4. Discussion This study revealed high diversity within and between T. gondii populations and the dominance of Type III and its closely related ToxoDB PCR–RFLP #7 lineages in Central and South America. The diversity of T. gondii in this region might have been generated by frequent genetic recombination among these populations. This is supported by linkage disequilibrium analysis which showed low levels of IsA and D0 values in several populations studied, and lim- ited ancestral clusters identified by STRUCTURE analysis. Though the Type II strains were identified, it was mainly con- centrated in Chile and absent from other populations in Central and South American countries included in this study (Table 1, Fig. 4). The lack of Type II strain was previously reported in a large collection of T. gondii strains from mainland Brazil (Pena et al., 2008; Dubey et al., 2008c). A more recent study reported Type II strains (Type II at all loci but Type I alllele at Apico) in sheep from the state in the south of Brazil, but this Type II lineage was possibly imported from other country (da Silva et al., 2011). The prevalence of genetic types of T. gondii in all hosts studied is different from the results obtained from chickens from Fernando de Noronha, an is- land 350 km northeast to the mainland of Brazil where clonal Type II predominated (Dubey et al., 2010). Because Fernando de Noro- nha was occupied by Europeans, it is likely that the Type II strain in Fernando de Noronha spread from Europe. In summary, existing data indicated that Type II strain is absent or rare in the inland of South America continent. This data suggest that Type II could have originated outside of South America. The high frequency of Type II strain in Chile is interesting. Chile is a long and narrow coastal country located on the west side of the Andes Mountains which separate it from most of the countries in South America. To its west is the Pacific Ocean, which provides ports and harbors convenient to maritime transportation to other countries. The unique geo- graphical location of Chile may limit migration of animals to and from surrounding countries in South America, which can explain why its T. gondii population is different. In addition, trading with countries in other regions (North America, Europe, Asia etc.) might bring in the Type II strains which eventually expanded and become dominant in Chile. Type III strains were frequently identified from Central and South America in this study. Several genotypes identical or closely related to Type III lineage are identified, including ToxoDB #2, Tox- oDB #7, ToxoDB #8, ToxoDB #14, ToxoDB #48, ToxoDB #140, Tox- oDB #187 and ToxoDB #188 (Fig. 5), similar data were reported in chickens and cats in Brazil (Pena et al., 2008). Clonal Type I strains were also rare in the populations studied. However, identical and closely related genotypes of Type I lineages are identified from this study (ToxoDB #10, ToxoDB #27 and ToxoDB #35) and from chick- ens and cats in Brazil (Pena et al., 2008). Taken together, these data suggest that, in contrast to Type II lineage, clonal Type I and III lin- eages might have a South America origin (Lehmann et al., 2006). However, this need to be confirmed by sampling more T. gondii iso- lates from wild animals in other continents such as Africa and Asia, from which only limited typing data is available for comparison at present. Overall, there are genetic substructures in several T. gondii populations from Central and South America. Currently sampling of population genetic studies only revealed a small proportion of diversity which warrants more in depth study in the future. 5. Conclusion This study of 164 T. gondi isolates revealed high diversity within and between T. gondii populations in Central and South America. However, the T. gondii population in Chile is unique in that it is lar- gely represented by the Type II lineage. Our data clearly revealed the lack of Type II strain in Central and South America. Previous studies using microsatellite and intron sequence data suggested four clusters of ancestral populations (Lehmann et al., 2006; Khan et al., 2007). Since different T. gondii isolates and markers were analyzed in these studies, direct comparison of data is difficult. However, it is apparent that all methods have come to a similar conclusion that there is very limited number of ancestral genomes contributed the makeup of modern data population structure of T. gondii. Acknowledgements The authors thank Leandra Ferreira, Juliana Martins for their help in revival of T. gondii strains. References Ajzenberg, D., Bañuls, A.L., Tibayrenc, M., Dardé, M.L., 2002a. Microsatellite analysis of Toxoplasma gondii shows considerable polymorphism structured into two main clonal groups. Int. J. Parasitol. 32, 27–38. Ajzenberg, D., Cogné, N., Paris, L., Bessières, M.H., Thulliez, P., Filisetti, D., Pelloux, H., Marty, P., Dardé, M.L., 2002b. Genotype of 86 Toxoplasma gondii isolates associated with human congenital toxoplasmosis, and correlation with clinical findings. J. Infect. Dis. 186, 684–689. Ajzenberg, D., Yera, H., Marty, P., Paris, L., Dalle, F., Menotti, J., Aubert, D., Franck, J., Bessi, M., Quinio, D., Pelloux, H., Delhaes, L., Desbois, N., Thulliez, P., Robert, G.F., Kauffmann, L.C., Pujol, S., Rabodonirina, M., Bougnoux, M.E., Cuisenier, B., Duhamel, C., Duong, T.H., Filisetti, D., Flori, P., Gay, A.F., Pratlong, F., Nevez, G., Totet, A., Carme, B., Bonnabau, H., Darde, M.L., Villena, I., 2009. Genotype of 88 Toxoplasma gondii isolates associated with toxoplasmosis in immunocompromised patients and correlation with clinical findings. J. Infect. Dis. 199, 1155–1167. Ajzenberg, D., 2010. Type I strains in human toxoplasmosis: myth or reality? Future Microbiol. 5, 841–843. Al-Kappany, Y.M., Rajendran, C., Abu-Elwafa, S.A., Hilali, M., Su, C., Dubey, J.P., 2010. Genetic diversity of Toxoplasma gondii isolates in Egyptian feral cats reveals new genotypes. J. Parasitol. 96, 1112–1114. Campana, M.G., Hunt, H.V., Jones, H., White, J., 2010. CorrSieve: software for summarizing and evaluating Structure output. Mol. Ecol. Res. 11, 349–352. Carme, B., Bissuel, F., Ajzenberg, D., Bouyne, R., Aznar, C., Demar, M., Bichat, S., Louvel, D., Bourbigot, A.M., Peneau, C., Neron, P., Darde, M.L., 2002. Severe acquired toxoplasmosis in immunocompetent adult patients in French Guiana. J. Clin. Microbiol. 40, 4037–4044. Chen, Z.W., Gao, J.M., Huo, X.X., Wang, L., Yu, L., Halm-Lai, F., Xu, Y.H., Song, W.J., Hide, G., Shen, J.L., Lun, Z.R., 2011. Genotyping of Toxoplasma gondii isolates from cats in different geographic regions of China. Vet. Parasitol. 183, 166–170. Dardé, M.L., Bouteille, B., Pestre-Alexandre, M., 1992. Isoenzyme analysis of 35 Toxoplasma gondii isolates and the biological and epidemiological implications. J. Parasitol. 78, 786–794. Dardé, M.L., 1996. Biodiversity in Toxoplasma gondii. Curr. Top. Microbiol. Immunol. 219, 27–41. Delhaes, L., Ajzenberg, D., Sicot, B., Bourgeot, P., Dardé, M.L., Dei-Cas, E., Houfflin- Debarge, V., 2010. Severe congenital toxoplasmosis due to a Toxoplasma gondii strain with an atypical genotype: case report and review. Prenat. Diagn. 30, 902–905. Demar, M., Ajzenberg, D., Maubon, D., Djossou, F., Panchoe, D., Punwasi, W., Valery, N., Peneau, C., Daigre, J.L., Aznar, C., Cottrelle, B., Terzan, L., Dardé, M.L., Carme, B., 2007. Fatal outbreak of human toxoplasmosis along the Maroni River: epidemiological, clinical, and parasitological aspects. Clin. Infect. Dis. 45, e88– e95. Dubey, J.P., Beattie, C.P., 1988. Toxoplasmosis of Animals and Man. CRC Press, Boca Raton, Florida. Dubey, J.P., Venturini, M.C., Venturini, L., Piscopo, M., Graham, D.H., Dahl, E., Sreekumar, C., Vianna, M.C., Lehmann, T., 2003. Isolation and genotyping of Toxoplasma gondii from free-ranging chickens from Argentina. J. Parasitol. 89, 1063–1064. Dubey, J.P., Levy, M., Sreekumar, C., Kwok, O.C.H., Shen, S.K., Dahl, E., Thulliez, P., Lehmann, T., 2004. Tissue distribution and molecular characterization of chicken isolates of Toxoplasma gondii from Peru. J. Parasitol. 90, 1015–1018. C. Rajendran et al. / Infection, Genetics and Evolution 12 (2012) 359–368 367
- 10. Dubey, J.P., Bhaiyat, M.I., de Allie, C., Macpherson, C.N.L., Sharma, R.N., Sreekumar, C., Vianna, M.C.B., Shen, S.K., Kwok, O.C.H., Miska, K.B., Hill, D.E., Lehmann, T., 2005a. Isolation, tissue distribution, and molecular characterization of Toxoplasma gondii from chickens in Grenada, West Indies. J. Parasitol. 91, 557–560. Dubey, J.P., Lopez, B., Alveraz, M., Mendoza, C., Lehmann, T., 2005b. Isolation, tissue distribution, and molecular characterization of Toxoplasma gondii from free- range chickens from Guatemala. J. Parasitol. 91, 955–957. Dubey, J.P., Lenhart, A., Castillo, C.E., Alvarez, L., Marcet, P., Sreekumar, C., Lehmann, T., 2005c. Toxoplasma gondii infections in chickens from Venezuela: isolation, tissue distribution, and molecular characterization. J. Parasitol. 91, 1332–1334. Dubey, J.P., Su, C., Oliveira, J., Morales, J.A., Bolaños, R.V., Sundar, N., Kwok, O.C.H., Shen, S.K., 2006a. Biologic and genetic characteristics of Toxoplasma gondii isolates in free-range chickens from Costa Rica, Central America. Vet. Parasitol. 139, 29–36. Dubey, J.P., Patitucci, A.N., Su, C., Sundar, N., Kwok, O.C.H., Shen, S.K., 2006b. Characterization of Toxoplasma gondii isolates in free-range chickens from Chile, South America. Vet. Parasitol. 140, 76–82. Dubey, J.P., Su, C., Cortés, J.A., Sundar, N., Gomez-Marin, J.E., Polo, L.J., Zambrano, L., Mora, L.E., Lora, F., Jimenez, J., Kwok, O.C.H., Shen, S.K., Zhang, X., Nieto, A., Thulliez, P., 2006c. Prevalence of Toxoplasma gondii in cats from Colombia, South America and genetic characterization of T. Gondii isolates. Vet. Parasitol. 141, 42–47. Dubey, J.P., Sundar, N., Pineda, N., Kyvsgaard, N.C., Luna, L.A., Rimbaud, E., Oliveira, J.B., Kwok, O.C.H., Qi, Y., Su, C., 2006d. Biologic and genetic characteristics of Toxoplasma gondii isolates in free-range chickens from Nicaragua, Central America. Vet. Parasitol. 142, 47–53. Dubey, J.P., Sundar, N., Gennari, S.M., Minervino, A.H.H., Farias, N.A.R., Ruas, J.L., dos Santos, T.R.B., Cavalcante, G.T., Kwok, O.C.H., Su, C., 2007a. Biologic and genetic comparison of Toxoplasma gondii isolates in free-range chickens from the northern Pará state and the southern state Rio Grande do Sul, Brazil revealed highly diverse and distinct parasite populations. Vet. Parasitol. 143, 182–188. Dubey, J.P., Cortés-Vecino, J.A., Vargas-Duarte, J.J., Sundar, N., Velmurugan, G.V., Bandini, L.M., Polo, L.J., Zambrano, L., Mora, L.E., Kwok, O.C.H., Smith, T., Su, C., 2007b. Prevalence of Toxoplasma gondii in dogs from Colombia, South America and genetic characterization of T. Gondii isolates. Vet. Parasitol. 145, 45–50. Dubey, J.P., Zhu, X.Q., Sundar, N., Zhang, H., Kwok, O.C.H., Su, C., 2007c. Genetic and biologic characterization of Toxoplasma gondii isolates of cats from China. Vet. Parasitol. 145, 352–356. Dubey, J.P., Applewhaite, L., Sundar, N., Velmurugan, G.V., Bandini, L.A., Kwok, O.C.H., Hill, R., Su, C., 2007d. Molecular and biological characterization of Toxoplasma gondii isolates from free-range chickens from Guyana, South America, identified several unique and common parasite genotypes. Parasitology 134, 1559–1565. Dubey, J.P., Sundar, N., Hill, D., Velmurugan, G.V., Bandini, L.A., Kwok, O.C.H., Majumdar, D., Su, C., 2008a. High prevalence and abundant atypical genotypes of Toxoplasma gondii isolated from lambs destined for human consumption in the USA. Int. J. Parasitol. 38, 999–1006. Dubey, J.P., Velmurugan, G.V., Ulrich, V., Gill, J., Carstensen, M., Sundar, N., Kwok, O.C.H., Thulliez, P., Majumdar, D., Su, C., 2008b. Transplacental toxoplasmosis in naturally-infected white-tailed deer: isolation and genetic characterisation of Toxoplasma gondii from foetuses of different gestational ages. Int. J. Parasitol. 38, 1057–1063. Dubey, J.P., Velmurugan, G.V., Chockalingam, A., Pena, H.F.J., de Oliveira, L.N., Leifer, C.A., Gennari, S.M., Oliveira, L.M.G.B., Su, C., 2008c. Genetic diversity of Toxoplasma gondii isolates from chickens from Brazil. Vet. Parasitol. 157, 299– 305. Dubey, J.P., Huong, L.T.T., Lawson, B.W.L., Subekti, D.T., Tassi, P., Cabaj, W., Sundar, N., Velmurugan, G.V., Kwok, O.C.H., Su, C., 2008d. Seroprevalence and isolation of Toxoplasma gondii from free-range chickens in Ghana, Indonesia, Italy, Poland, and Vietnam. J. Parasitol. 94, 68–71. Dubey, J.P., Velmurugan, G.V., Morales, J.A., Arguedas, R., Su, C., 2009. Isolation of Toxoplasma gondii from the keel-billed toucan (Ramphastos sulfuratus) from Costa Rica. J. Parasitol. 95, 467–468. Dubey, J.P., 2010a. Toxoplasmosis of animals and humans, 2nd ed. CRC Press, Boca Raton, Florida. Dubey, J.P., 2010b. Toxoplasma gondii infections in chickens (Gallus domesticus): prevalence, clinical disease, diagnosis, and public health significance. Zoonoses and Public Health 57, 60–73. Dubey, J.P., Rajendran, C., Costa, D.G.C., Ferreira, L.R., Kwok, O.C.H., Qu, D., Su, C., Varvulo, M.F.V., Alves, L.C., Mota, R.A., Silva, J.C.R., 2010. New Toxoplasma gondii genotypes isolated from free-range chickens from the Fernando de Noronha, Brazil: unexpected findings. J. Parasitol. 96, 709–712. Dubey, J.P., Rajendran, C., Ferreira, L.R., Martins, J., Kwok, O.C., Hill, D.E., Villena, I., Zhou, H., Su, C., Jones, J.L., 2011. High prevalence and genotypes of Toxoplasma gondii isolated from goats, from a retail meat store, destined for human consumption in the USA. Int. J. Parasitol. 41, 827–833. Excoffier, L., Lischer, H.E.L., 2010. Arlequin suite ver 3.5. A new series of programs to perform population genetics analyses under Linux and Windows. Mol. Ecol. Res. 10, 564–567. Haubold, B., Hudson, R.R., 2000. Lian 3.0: detecting linkage disequilibrium in multilocus data. Bioinformatics 16, 847–848. Howe, D.K., Sibley, L.D., 1995. Toxoplasma gondii comprises three clonal lineages: correlation of parasite genotype with human disease. J. Infect. Dis. 172, 1561– 1566. Howe, D.K., Honoré, S., Derouin, F., Sibley, L.D., 1997. Determination of genotypes of Toxoplasma gondii strains isolated from patients with toxoplasmosis. J. Clin. Microbiol. 35, 1411–1414. Huson, D.H., Bryant, D., 2006. Application of phylogenetic networks in evolutionary studies. Mol. Biol. Evol. 23, 254–267. Mercier, A., Devillard, S., Ngoubangoye, B., Bonnabau, H., Bañuls, A., Durand, P., Salle, B., Ajzenberg, D., Dardé, M.L., 2010. Additional haplogroups of Toxoplasma gondii out of Africa: population structure and mouse-virulence of strains from Gabon. PloS Negl. Trop. Dis. 4, e876. Pritchard, J.K., Stephens, M., Donnelly, P., 2000. Inference of population structure using multilocus genotype data. Genetics 155, 945–959. Khan, A., Fux, B., Su, C., Dubey, J.P., Darde, M.L., Ajioka, J.W., Rosenthal, B.M., Sibley, L.D., 2007. Recent transcontinental sweep of Toxoplasma gondii driven by a single monomorphic chromosome. Proc. Natl. Acad. Sci. USA 104, 14872– 14877. Khan, A., Dubey, J.P., Chunlei, S., Ajioka, J.A., Rosenthal, B.M., Sibley, L.D., 2011. Genetic analyses of atypical Toxoplasma gondii strains reveal a fourth clonal lineage in North America. Int. J. Parasitol. 41, 645–655. Lehmann, T., Blackston, C.R., Parmley, S.F., Remington, J.S., Dubey, J.P., 2000. Strain typing of Toxoplasma gondii: comparison of antigen-coding and housekeeping genes. J. Parasitol. 86, 960–971. Lehmann, T., Graham, D.H., Dahl, E.R., Bahia-Oliveira, L.M.G., Gennari, S.M., Dubey, J.P., 2004. Variation in the structure of Toxoplasma gondii and the roles of selfing, drift, and epistatic selection in maintaining linkage disequilibria. Infect. Genet. Evol. 4, 107–114. Lehmann, T., Marcet, P.L., Graham, D.H., Dahl, E.R., Dubey, J.P., 2006. Globalization and the population structure of Toxoplasma gondii. Proc. Natl. Acad. Sci. USA 103, 11423–11428. Jakobsson, M., Rosenberg, N.A., 2007. CLUMPP: a cluster matching and permutation program for dealing with label switching and multimodality in analysis of population structure. Bioinformatics 23, 1801–1806. Rosenberg, N.A., 2004. DISTRUCT: a program for the graphical display of population structure. Mol. Ecol. Notes 4, 137–138. Pena, H.F.J., Gennari, S.M., Dubey, J.P., Su, C., 2008. Population structure and mouse- virulence of Toxoplasma gondii in Brazil. Int. J. Parasitol. 38, 561–569. da Silva, R.C., Langoni, H., Su, C., da Silva, A.V., 2011. Genotypic characterization of Toxoplasma gondii in sheep from Brazilian slaughterhouses: new atypical genotypes and the clonal Type II strain identified. Vet. Parasitol. 175, 173–177. Sibley, L.D., Boothroyd, J.C., 1992. Virulent strains of Toxoplasma gondii comprise a single clonal lineage. Nature 359, 82–85. Su, C., Evans, D., Cole, R.H., Kissinger, J.C., Ajioka, J.W., Sibley, L.D., 2003. Recent expansion of Toxoplasma through enhanced oral transmission. Science 299, 414–416. Su, C., Shwab, E.K., Zhou, P., Zhu, X.Q., Dubey, J.P., 2010. Moving towards an integrated approach to molecular detection and identification of Toxoplasma gondii. Parasitology 137, 1–11. Sundar, N., Cole, R.A., Thomas, N.J., Majumdar, D., Dubey, J.P., Su, C., 2008. Genetic diversity among sea otter isolates of Toxoplasma gondii. Vet. Parasitol. 151, 125– 132. Velmurugan, G.V., Dubey, J.P., Su, C., 2008. Genotyping studies of Toxoplasma gondii isolates from Africa revealed that the archetypal clonal lineages predominate as in North America and Europe. Vet. Parasitol. 155, 314–318. Velmurugan, G.V., Su, C., Dubey, J.P., 2009. Isolate designation and characterization of Toxoplasma gondii isolates from pigs in the United States. J. Parasitol. 95, 95– 99. Zhou, P., Zhang, H., Lin, R., Zhang, L., Song, H., Su, C., Zhu, X., 2009. Genetic characterization of Toxoplasma gondii from China. Parasitol. Int. 58, 193–195. 368 C. Rajendran et al. / Infection, Genetics and Evolution 12 (2012) 359–368