Paisaje Sonoro - Itziar Aspuru [es]
•
1 gostou•1,510 visualizações


Recomendados
Mais conteúdo relacionado
Mais procurados
Mais procurados (20)
Semelhante a Paisaje Sonoro - Itziar Aspuru [es]
Semelhante a Paisaje Sonoro - Itziar Aspuru [es] (20)
Mais de Medi Ambient. Generalitat de Catalunya
Mais de Medi Ambient. Generalitat de Catalunya (20)
Último
Último (16)
Paisaje Sonoro - Itziar Aspuru [es]
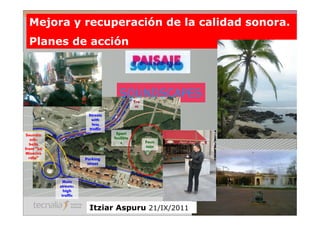
- 1. Mejora y recuperación de la calidad sonora. Planes de acción SOUNDSCAPES Tra m Streets with less traffic Soundm Sport ark: facilitie s Foun bells tain from “La Miserico rdia” Parking street Main streets: high traffic Itziar Aspuru 21/IX/2011
- 2. Introducción Qué es el paisaje sonoro? Por qué nos interesa? Ideas básicas Dos investigaciones de Tecnalia Itziar Aspuru 21/IX/2011
- 3. Qué es el Paisaje Sonoro Paisaje Sonoro –Soundscape-: forma en que los sonidos (denominados en su conjunto ambiente sonoro) de un determinado lugar (contexto) son percibidos y valorados por las personas, los grupos o la sociedad. Primeros estudios sobre Paisaje Sonoro los realizaron Murray Schafer (1977, 1978) y Barry Truax (1984) en Canadá: Dentro de los objetivos que marca la legislación actual en materia de ruido ambiental se destacan dos líneas de trabajo, una de las cuales es: – Preservar las zonas tranquilas para mejorar la calidad de vida de la ciudadanía: cuya herramienta de trabajo la constituye el análisis del ambiente sonoro. LEY 37/2007 y RD 1367/32007: •Zona tranquila como la zona con 5 dBA menos de nivel sonoro (generado por los focos de ruido ambiental) que debe ser preservada. •Reserva de sonido de origen natural (cat G). Itziar Aspuru 21/IX/2011
- 4. Environmental Soundscape Noise Directive concepts Strategic Noise City Noise Action Maps Plans Urban Planners Urban Design Urban Quiet Areas Soundscape concepts Concept Itziar Aspuru 21/IX/2011
- 5. Qué es el Paisaje Sonoro •El sonido, “como cualquier otro elemento del mundo, no tiene una existencia objetiva o verdadera, sino que existe únicamente en el mundo en que es percibido” (Guyot, 1996) •Un sonido o ambiente sonoro no puede ser medido y calificado únicamente a partir de sus rasgos físicos, de la misma forma que no puede ser considerado separadamente de la personas que lo perciben, ni del lugar dónde es escuchado (Guillén, 2007). Contaminación acústica Paisaje sonoro Ruido Sonido Molestia Confort Nivel y Frecuencia Eventos – Captación de la atención Congruencia con el contexto Información (significado) Identidad (memoria) Poner en valor el sonido Temperatura Sabor
- 6. ¿Por qué son interesantes? Porque es una variable que participa en la consideración de la calidad de vida en el diseño de nuestros entornos. Sostenibilidad integral. Existen motivos argumentados para la defensa de determinados paisajes sonoros. Los motivos más destacables son: • la influencia en la restauración del estrés día a día (mejora a la salud), • el interés de la preservación cultural (argumento de la ecologías acústica y motivo por el cual existen “librerías” de sonidos) y • para proteger la vida salvaje (cuya “supervivencia” depende de que sus ambientes sonoros no estén afectados por el hombre y puedan “comunicarse” e identificar predadores). Itziar Aspuru 21/IX/2011
- 7. Ideas básicas de paisaje sonoro Percepción Variables que influyen en SSC: – Personas: Estilos de vida, Experiencia, coping, grupos vulnerables – Actividades, pensamientos, sentimientos. Variables moduladoras (dosis/respuesta) – Contexto: Lugar de residencia, contaminación del aire, satisfacción residencial. Soundscape “acts of meaning”: Significado, Expectativa, Congruencia Sound: one of the essential ways for us to perceive and communicate with the world – Parte de la estética sensorial: preferencias, discriminación, valor emoción y afecto Itziar Aspuru 21/IX/2011
- 8. Ideas básicas de paisaje sonoro Parámetros físicos para su evaluación: • No es suficiente el nivel LAeq medio nivel, tiempo, frecuencia. – Identificación de eventos su congruencia y significado. – Detección de fuentes de ruido. • Parámetros como loudness, roughness, y sharpness no aportan excesivamente porque no varían suficientemente en entornos abiertos, excepto cuando hay focos dominantes. Itziar Aspuru 21/IX/2011
- 9. Ideas básicas de paisaje sonoro Diseño y Gestión Algunas afirmaciones interesantes: Se requiere reducir el nivel de LAeq por debajo de 65 dBA para empezar a diseñar soundscape. La naturaleza aporta experiencias de restauración que afectan directamente al bienestar psicológico y a la salud de la población. Se identifica una relación de dependencia directa entre la percepción visual y sonora. En ambos casos la presencia de lo natural, el “agua” y la identificación de “señas de identidad cultural” implican una mejor percepción del otro sentido. Se remarca, en muchas ocasiones, la influencia local o regional en la forma de percibir el ambiente sonoro. Itziar Aspuru 21/IX/2011
- 10. TECNALIA y Paisaje Sonoro Voluntad de vincularlo al Plan de Acción de Bilbao Resultados de dos investigaciones que nos muestran: – Pautas a considerar en los Planes de Acción: • Las expectativas de la población. • La importancia de los soundmarks en la percepción - Los espacios urbanos pueden jugar un papel restaurador para los ciudadanos que los visiten, de tal forma que contribuyan a la restauración frente al estrés diario • Existen evidencias biológicamente relevantes que ponen de manifiesto que, disponer de un paisaje sonoro agradable en zonas urbanas de esparcimiento contribuye a una restauración frente al estrés diario más intensa y rápida que en zonas más contaminadas acústicamente • Estar en ambientes sonoros valorados como “positivos” o “tranquilos” conlleva beneficios en la salud percibida (psicosocial) no solo reduciendo el estrés sino también aumentando el bienestar positivo (emociones) COST ACTION 22 miembros en el Mangement Comitee. Itziar Aspuru 21/IX/2011
- 11. BILBAO municipality is answering to the Directive: Strategic Noise Map already made, and Noise Action Plan under development: General ideas of the Sound Environmental Plan 2013: – Linked to the global strategy about the desired model of the city and to other plans and urban changes overseen. – Worked in a multidisciplinary Commission with Urban Planners and Public Works Department involved. Strategic objective in the Plan: create and preserve quiet areas in each of the districts of the city to restore the stress of the citizen and improve life quality. At least 8 quiet areas should be identified and their acoustical quality assessed. First criteria for their identification is based ‐ on their use, ‐ on the possibility of preserving them, and ‐ on the noise levels obtained on Strategic Noise Map (Ld and Le below 60 dBA). A procedure to assess the acoustical quality of an open space is needed.
- 12. 1. Presentation of the study POLICY MAKERS RESEARCHERS Bilbao Sound Environmental Plan The quest for quantifiable indicators Create and preserve quiet areas The challenge of finding a set of indicators that could help Procedure to assess on predicting soundscape the acoustical quality of an open space perception Collaboration of Labein and G. Memoli to check the suitability and accuracy of Slope indicator (2009) Presentado en Euronoise, Edimburgo 2009
- 13. 2. Location Tram Streets with less traffic Sport Soundmark: facilities bells from “La Misericordia” Fountain 2. La Fuente: Area close to a Parking street fountain at the center of the park. Main streets: high traffic Two subareas 1. La placita: Small square in the limit of the park. It represents urban recreational areas.
- 14. 2. Measured Parameters Licitra & Memoli (2005), Licitra, Memoli, The “Slope” indicator Botteldooren, De Coensel (2005) It measures how often events appear and how they emerge from background noise. It is calculated by analyzing LAeq (15 min, fast, 1/3 octaves), L% and Lmax data. -2.10 The indicator has been correlated to people’s Slope = -1 perception using a survey in urban sites near Pisa (music/like structure) (IT) A “scale of quietness” has been constructed Quiet locations Greater than ‐1 Music Close to ‐1 White noise and MLS Close to ‐2 Disturbed locations Lower than ‐2
- 15. 2. Measured Parameters A questionnaire survey were conducted among users of the park. Interviewees were asked to indicate – their preferred areas, – how often they go to the park, – what they most like and dislike about it (open questions). – soundscape perception: • annoyance (5‐levels) and • an analysis of semantic differences to identify key adjectives Behavioural observations were noted as part of the study Limited number of responses the number of questionnaires is not enough for statistical analysis. Presentado en Euronoise, Edimburgo 2009
- 16. 3. Results Area 1: la “placita” (1/3) Secondary street and Access to the park C3 S10 S2 S7 S1 S4 S8 C2 S9 S5 S3 S6 C1 Main Street and Bus Stop Measurement points: C at 4 m height, at least 45 min with 1s spacing S at 1.5 m height, at least 15 min with 1s spacing
- 17. 3. Results Area 1: la “placita” (2/3) Quantitative Analysis Secondary street and Access to the park 60-65 dB Slope 65-70 dB LAeq Main Street and Bus Stop Agreement with noise map According to Slope, the people looking for “quietness” should prefer the right side of the square
- 18. 3. Results Area 1: la “placita” (3/3) Qualitative Analysis Most of the users of the square are related to the bus stop nearby Their preferences are conditioned by the fact that they need to stay close to the bus stop The visitors looking for relax, during the More data are needed measurement period, used only the benches both in terms of in the right side of the square measurements and questionnaires Presentado en Euronoise, Edimburgo 2009
- 19. 3. Results Area 2: la “fuente” (1/3) C618 S418 S218/S318 C417 C619 C518 S717 S817 S118 S119 Measurements of 45’ Measurements of 15’ Measurement points: C at 4 m height, at least 45 min with 1s spacing S at 1.5 m height, at least 15 min with 1s spacing
- 20. 3. Results Quantitative Analysis Area 2: la “fuente” (2/3) Average LAeq Lmax Slope C518 ‐1.94 68.7 69.5 C417 ‐1.89 62.9 69.3 S717 ‐1.17 62.9 64.7 S817 ‐1.06 60.9 67.3 C719 ‐1.77 63.1 68.6 S118 ‐0.93 60.1 62.7 S218 ‐0.73 S318 61.0 67.9 S418 ‐‐‐ 60.3 66.9 Agreement was found with C618 ‐1.80 63.1 76.9 noise mapping, once the S119 ‐2.05 61.6 73.6 fountain was excluded
- 21. 3. Results Area 2: la “fuente” (3/3) Qualitative Analysis Most common activities in this area are Sport facilities related to relaxing. for older All interviewees preferred stay closer to the people fountain but not too much. An age distinction arises in perception: There are sport facilities for older people in the proximity. A wheel working causes a squealing noise. It is well accepted by older people, meanwhile young people considered it as very annoying. - Older people preferred the higher part of the square, closer to the sport facilities. - Younger people preferred other areas of the square. Slope could not describe the effect of a soundmark
- 22. 3. Results Analysis of Semantic differential Significant differences were only found in two pairs of attributes: pleasant <-> unpleasant and relaxing <-> stressing. Different concepts of tranquillity La Fuente La Placita Noise Natural Sounds City/Civilization. Sources Traffic. Soundscape matches Use like a Bus Stop expectations Perceived sounds are expected 1.Garden; 2. Tranquility Attribute but not desirable Last: Security Related to cultural heritage and 1. Overall; 2. Tranquility identity of Bilbao Last: Traffic Playing children, birds, Positive bells, squealing wheel, None Sounds fountain (noisy).
- 23. 3. Conclusions (Limited results) It was clear how relevant is the expectation in sound perception. The two different concepts of tranquillity showed it. Expectations should be taken into account when designing action plans. The importance of soundmarks in perception makes them interesting for city planning. Can we artificially insert new ones? Positive Sounds Soundmarks Both qualitative and quantitative approaches should be wisely combined. Presentado en Euronoise, Edimburgo 2009
- 24. OBJECTIVES • Definition of a methodology to assess soundscapes, combining acoustics analysis and questionnaires regarding perception, emotion and health. • Contribute to emphasize the positive effect of soundscape on human health, demonstrating its ability to increase the effect of restoration linked to staying in urban areas Integral Health approach Health and Lifestyle Acoustic questionnaire approach Monitoring heart rate Experiment in Background Psychosocial La Alhondiga, a new level and Events approach Soundscape urban square assessment; (Bilbao) CROSS VALIDATION emotions and stress scales Presentado en ICBEN, Londres 2011 24
- 25. THE EXPERIMENT Group of 10 person from Tecnalia Two situations, distinguished only by its acoustic quality: • The first one is a natural situation in the square; • In the second one, we introduce an artificial audio, recorded previously in the same place, but ensuring the presence of some more events and a slightly higher noise level (only 2 dB). The group split in two to evaluate both situations (the order was changed each time). In addition to acoustic and psycho‐social assessment, the experiment included the performance of some cognitive tests to create stress in the individuals to be able to evaluate their recovery. Experimental Condition: Noiseless Experimental Condition: Noisy Group 1 (24/11/201 Phases Phases 0) Questionnair Stress Stress Resting Recovery Resting Questionnaire Recovery e test test Experimental Condition: Noisy Experimental Condition: Noiseless Group 2 (29/11/201 Phases Phases 0) Questionnair Stress Stress Resting Recovery Resting Questionnaire Recovery e test test Presentado en ICBEN, Londres 2011
- 26. CONCLUSIONS We created two situations with different values for the Sound Atmosphere Indicator Natural SSC+, and SSC with extra - sound. Comparing the assessment made in the two situations. The PLACE, when Natural SSC, is perceived as more pleasant (agradable), quiet (tranquilo) and common (común). Staying in urban recreation areas • Plays a perceived Restorative Effect compared to stress at work. • It Generates Positive emotional feelings: Calm. • It Reduces Negative emotions: Anger (Enojo). In the Natural SSC, those effects are higher. The monitored health indicator shows that in Natural SSC restoration to induced stress is more intense and faster. Presentado en ICBEN, Londres 2011
- 27. PSICOSOCIAL APPROACH PERCEPTION INDICATORS SOUNDSCAPES Personal Data • Revision 2009 Selection Based on our experience + COST + Internoise 2010… •Sociodemographic data • Semantic Differential Scale •Satisfaction in different areas of life •Noisiness and annoyance of noise sources in different common environments •Relaxation: activities and places Emotions Contribution from UPV-EHU, Social Health and Life Styles Psychology and Methodology of • Sources: Health and lifestyles Behavioural Science Dep. HEALTH Surveys • Fredickson ( Emotion Scale 2009) • Ministry of Health EVA (Visual Analog Scale) • Regional Government with 4 emotions • Most relevant items were selected Stress to identify possible contaminant Contribution from DeustoSalud factors • Stress Perception Scale EVA of Stress Presentado en ICBEN, Londres 2011
- 28. PSICOSOCIAL APPROACH RESULTS ABOUT SOUNDSCAPE PERCEPTION Natural SSC+ (without extra sound) • The PLACE: is perceived as more pleasant (agradable), quiet (tranquilo) and common (común) agradable • Some less complex (complejo), stressful (estresante), rough (áspero) and uncomfortable (incómodo). • It difficulties little less conversation 5 Percepción ambiente sonoro 4 3 , 2 SSC+ Alhóndiga SSC+ calles SSC- Alhóndiga SSC- calles 1 o ón te e o or o co o r uo lo ro e ro te e o o o l o un ia iv ilia bl ic on rid us nt od ej an nt en ui ad er ci gu pe at es ic in m ón da pl te sa m ót nq ur sa nf m fu rc tif ru rm nt tiv se co ás -fr m m is fa ra co on tr e có ce ab ar er tra ng co co ac ns fo in ar ag ol nv m in es co is in co co uy D co in o m N ta ul Presentado en ICBEN, Londres 2011 fic di
- 29. PSICOSOCIAL APPROACH SELECTED INDICATORS TO ASSESS Restorative Effect (Emotions and Stress) Joy, Calm, Anger, Sadness EVA (Visual Analog Scale) RESULTS Emotions It Generates Positive emotional feelings: Calm It Reduces Negative emotions: Anger (Enojo) Stress (Base Line: high levels linked to work) In addition to recovering from stress, it improves the Base Line Ambientes sonoros (SSC+/SSC-) 100 90 Línea Base (T6) 80 SSC+ pre 70 SSC + post 60 SSC- pre 50 SSC- post 40 30 20 10 0 Alegría Calma Stress Enojo Tristeza
- 30. HEALTH APPROACH SELECTED INDICATORS (collaboration with DEUSTOSALUD) Heart Rate Variability. Respiratory rate and EMG responses. SCL (Skin conductance level). Cortisol levels in saliva. 5 equipment Presentado en ICBEN, Londres 2011
- 31. HEALTH APPROACH RESULTS (collaboration with DEUSTOSALUD) Presentado en ICBEN, Londres 2011
- 32. PAISAJE SONORO 2010: HEALTH APPROACH RESULTS (collaboration with DEUSTOSALUD)
- 33. CONCLUSIONS “We have found biologically relevant evidences that show that having a nice soundscape in urban recreation areas contributes to have a restoration to daily stress more intense and faster than in more acoustically polluted areas ” “We can emphasize that being in acoustic environments rated as "positive " or "calm" has benefits in perceived health (psychosocial). It not only reduces stress but also increases the positive well-being (emotions)” TECNALIA provides a methodology for the evaluation of soundscapes that, combining acoustic analysis and psychosocial surveys, facilitates the identification of urban quiet areas to be preserved Presentado en ICBEN, Londres 2011