The Capabilities of Foley and Foley Wealth Strategies
Alexander_Special Situations Tear Sheet_May 2016
1. 1
Alexander buys and sells listed US equities and equity options using a macro top down view to identify growth drivers and risk factors that
cause significant price fluctuations over a 3 month to multi-year cycle. The strategy focuses on isolating risk factors and growth drivers to
specific sectors, industries and/or macroeconomic trends. Our investment team then uses bottom up fundamental analysis to drive
security selection. After security selection, a concentrated book is created of best ideas both long, short, or both. We manage risk by
aligning the portfolio, macroeconomic themes, growth drivers, risk factors, security selection and positive expectancy to deliver
asymmetrical outsized returns per unit of risk. The baseline for each investment is an asymmetrical return profile of $3 dollars of profit for
each $1 dollar of potential loss.
Performance Statistics (January 2014 – April 2016)
Alexander Alternative Capital LLC
40 SW 13th Street
Miami, FL 33130
MC@alexanderalternativecapital.com
Portfolio Manager Michael Corcelli Performance Hurdle No Program AUM $3 Million
Program Name
Special Situations
Strategy
Trading Style Dynamic Investment Type Managed Accounts
Inception Date January 1, 2014 High Water Mark Yes Auditor KPMG LLP
Minimum Account $250,000 Entry / Exit Dates Monthly Administrator SS&C GlobeOp
Management/Incentive Fees 2% & 20% or 0% & 35% Lockup No Attorneys Winston & Strawn, LLP
Historical Monthly Performance (Gross of Fees)
Jan Feb Mar Apr May June Jul Aug Sep Oct Nov Dec Year
AAC 2014 0.13% 0.76% -0.19% 1.75% 1.59% 15.11% 1.32% 6.95% 11.70% 1.18% 4.55% 0.52% 54.21%
S&P 500 2014 -3.56% 4.31% 0.69% 0.62% 2.10% 1.91% -1.51% 3.77% -1.55% 2.32% 2.45% -0.42% 11.38%
AAC 2015 -0.02% 1.01% 0.03% 0.56% 0.16% 0.13% 0.19% 0.03% 0.15% 1.84% 1.39% -0.75% 4.80%
S&P 500 2015 -3.10% 5.49% -1.74% 0.85% 1.05% -2.10% 1.97% -6.26% -2.64% 8.30% 0.05% -1.75% -0.72%
AAC 2016 -1.86% 2.04% 1.45% 0.21% 1.81%
S&P 500 2016 -5.07% -0.41% 6.60% 0.27% 1.05%
Trading Strategy Abstract
Investment Strategy and Approach
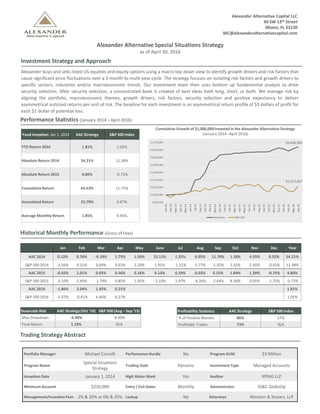
Alexander Alternative Special Situations Strategy
as of April 30, 2016
Fund Inception: Jan 1, 2014 AAC Strategy S&P 500 Index
YTD Return 2016 1.81% 1.05%
Absolute Return 2014 54.21% 11.38%
Absolute Return 2015 4.80% -0.72%
Cumulative Return 64.53% 11.75%
Annualized Return 23.79% 4.87%
Average Monthly Return 1.85% 0.45%
Downside Risk AAC Strategy (Oct ‘14) S&P 500 (Aug – Sep ‘15)
Max Drawdown -6.49% -8.90%
Final Return 1.18% N/A
Profitability Statistics AAC Strategy S&P 500 Index
% of Positive Months 86% 57%
Profitable Trades 73% N/A
Cumulative Growth of $1,000,000 Invested in the Alexander Alternative Strategy
(January 2014 –April 2016)
$1,645,303
$1,117,457
2. 2
Portfolio Characteristics (As of 04/30/2016)
Position Level Breakdown
Total Number of Positions 20 Total Long Exposure as % of Equity Exposure 32%
Number of Long Positions 15 Total Gross Exposure as % of Equity 40%
Number of Short Positions 5 Total Net Exposure as % of Equity 24%
Portfolio Overview (As of 04/30/2016)
Top 5 Positions in Portfolio
Company Name Ticker Market Cap ($ in millions) Industry
Microsoft MSFT $392,709 Technology
Hubspot HUBS $1,530 Technology
Salesforce CRM $50,072 Technology
Independent Bank Corp INDB $1,220 Financials
Synovus Financial Corp SNV $3,773 Financials
Alexander Alternative Capital in the News
Bloomberg, January 17, 2015: “There are a lot of people who thought oil can’t go down much further and tried to call a bottom,” said Michael
Corcelli, chief investment officer of Miami-based hedge fund Alexander Alternative Capital LLC, told Bloomberg in an interview. “When we
have monster pullbacks, things don’t end politely. I think we’ll drop to $24 or $25 and then have a sharp V-shaped rally.”
Bloomberg, October 26, 2015: “We’re back to trading the fundamentals,” said Michael Corcelli, chief investment officer of hedge fund
Alexander Alternative Capital LLC in Miami. “OPEC is pumping a tremendous amount of oil and the market is heading for the six-year lows
around $36. We could wake up any day this week and find that prices have moved below those levels.”
Bloomberg, August 17, 2015: “When the Fed raises rates, it’s inevitable that the dollar will rise and oil will fall, “Michael Corcelli, chief
investment officer of hedge fund Alexander Alternative Capital LLC in Miami, said by phone. “It’s not only the dollar that’s weighing oil, it’s
also excess supply.”
Reuters, November 17, 2014: “Corcelli made a name for himself by shorting bank stocks during the financial crisis and investing in them
during the recovery, but said he is not currently shorting any securities. He compared investing in exploration-and-production stocks on the
idea that they are undervalued to investing in bank stocks in early 2008 after they had fallen from their highs.”
Disclaimer
This information is confidential and is intended exclusively for the person to whom this was delivered who is deemed to be a professional familiar with financial instruments and hedge fund products in particular. Any further use by and/or delivery to a person
not directlypresented with this report by a representative of Alexander Alternative Capital LLC (“AAC") is strictly prohibited and allowed only after the prior express written consent of AAC.
Neither AAC nor any of its affiliates or representatives makes any representation or warranty, express or implied, as to the accuracy or completeness of the information contained herein or any other written or oral communication transmitted or made available
to the recipient.
Past performance is not indicative of future results and the investments described herein are highly speculative and involve a high degree of risk. Investors should be advised that alternative investment products such as the ones described herein involve the risk
of loss. Performance can be volatile and an investor could lose all or a substantial amount of his or her investment. All performance figures noted in this document are gross numbers, the numbers do not include any management fees or expenses. The Fund’s
fees and expenses may offset the Fund’s trading profits. There is no secondary market for an investor’s interest in the Fund, none is expected to develop and there are restrictions on transferring interests in the Fund. The Fund’s investment adviser has total
trading authority over the Fund. Investors should be aware that the use of a single investment advisor applying generallysimilar trading programs could mean lack of diversificationand, consequentially, higher risk.
This document is not intended as, and does not constitute an offer to sell or solicit any person to purchase securities. Any mention of securities named in this document is neither a recommendation nor a solicitation. No person should rely on any information in
this document, but should rely exclusively on the offering material when considering whether to invest.
Any opinions, assumptions, assessments, statements or the like (collectively, “Statements”) regarding future events or which are forward-looking constitute only subjective views, beliefs, outlooks, estimations or intentions of AAC, should not be relied on, are
subject to change due to a variety of factors, including fluctuating market conditions and economic factors, and involve inherent risks and uncertainties, both general and specific, many of which cannot be predicted or quantified and are beyond AAC’s or the
Fund’s control. Future evidence and actual results could differ materially from those set forth in, contemplated by, or underlying these Statements, which are subject to change without notice. In light of these risks and uncertainties, there can be no assurance
and no representation is given that these Statements are now, or will prove to be accurate, or complete in any way. AAC undertakes no responsibility or obligation to revise or update such Statements. Statements expressed herein may not necessarily be shared
by all personnel of AAC and its affiliates.
Benchmarks and financial indices are shown for illustrative purposes only and are provided for the purpose of making general market data available as a point of reference only. Such benchmarks and financial indices may not be available for direct investment,
may be unmanaged, assume reinvestment of income, do not reflect the impact of any trading commissions and costs, management or performance fees, and have limitations when used for comparison or other purposes because they, among other reasons,
may have different trading strategy, volatility, credit, or other material characteristics (such as limitations on the number and types of securities or instruments). The Fund’s investment objective is not restricted to the securities and instruments comprising any
one index. No representation is made that any benchmark or index is an appropriate measure for comparison. Performance results of the S&P 500 Index (the “Index”) are provided for informational purposes only and investors generally cannot invest directly in
the Index. There may be significant differences between the Fund and the securities that comprise the Index. The Index does not reflect the expenses or fees that an investor in the Fund would bear (including organizational, auditing, accounting and
administrativeexpenses or other investment-relatedexpenses or taxes). No representation is made that the Index is an appropriate measure for comparison.
This material is as of the date indicated, is subject to change and does not contain material information regarding the Fund, including specific information relating to an investment in the Fund and related risks factors. Certain information, including information
related to indices and benchmarks, has been provided by and/or is based on third party sources and, although believed to be reliable, has not been independently verified. AAC is not responsible for errors or omissions from these sources. AAC does not provide
accounting, tax or legal advice to its clients and all potential investors are strongly urged to consult with their own advisors. Neither AAC nor any of its affiliates or representatives makes any representation or warranty, express or implied, as to the accuracy or
completeness of the information contained herein or any other written or oral communication transmitted or made available to the recipient. AAC and its affiliates and representatives expressly disclaim any and all liability based, in whole or in part, on such
information, errors therein or omissions there from.
Alexander Alternative Capital LLC
40 SW 13th Street
Miami, FL 33130
MC@alexanderalternativecapital.com