
Recommended
More Related Content
What's hot
Viewers also liked
Similar to Cob 20090604 1
More from macavity_d_katt
More from macavity_d_katt (20)
Recently uploaded
Recently uploaded (20)
Cob 20090604 1
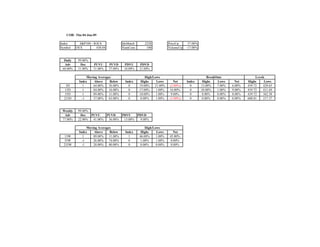
- 1. COB: Thu 04-Jun-09 Index S&P100 - $OEX IdxMatch 2228 PriceUp 37.00% Symbol OEX 438.04 NumCons 100 VolumeUp -17.00% Daily 99.00% Adv Dec PUVU PUVD PDVU PDVD 68.00% 31.00% 31.00% 37.00% 10.00% 21.00% Moving Averages High/Lows BreakOuts Levels Index Above Below Index Highs Lows Net Index Highs Lows Net Highs Lows 3D 1 64.00% 36.00% 0 19.00% 21.00% (2.00%) 0 13.00% 7.00% 6.00% 439.72 429.65 13D 1 84.00% 16.00% 0 17.00% 1.00% 16.00% 0 10.00% 1.00% 9.00% 439.72 411.69 55D 1 89.00% 11.00% 0 10.00% 1.00% 9.00% 0 8.00% 0.00% 8.00% 439.72 362.38 233D -1 37.00% 63.00% 0 0.00% 1.00% (1.00%) 0 0.00% 0.00% 0.00% 608.81 317.37 Weekly 99.00% Adv Dec PUVU PUVD PDVU PDVD 77.00% 22.00% 41.00% 36.00% 13.00% 9.00% Moving Averages High/Lows Index Above Below Index Highs Lows Net 13W 1 89.00% 11.00% 1 46.00% 1.00% 45.00% 55W -1 26.00% 74.00% 0 1.00% 1.00% 0.00% 233W -1 20.00% 80.00% 0 0.00% 0.00% 0.00%
- 2. COB: Thu 04-Jun-09 Index Nasdaq100 - $NDX IdxMatch 2116 PriceUp 29.00% Symbol NDX--X 1492.74 NumCons 100 VolumeUp -43.00% Daily 99.00% Adv Dec PUVU PUVD PDVU PDVD 64.00% 35.00% 14.00% 50.00% 14.00% 21.00% Moving Averages High/Lows BreakOuts Levels Index Above Below Index Highs Lows Net Index Highs Lows Net Highs Lows 3D 1 62.00% 38.00% 0 24.00% 15.00% 9.00% 0 14.00% 5.00% 9.00% 1493.80 1459.59 13D 1 86.00% 14.00% 0 22.00% 1.00% 21.00% 0 12.00% 0.00% 12.00% 1493.80 1350.95 55D 1 90.00% 10.00% 0 14.00% 0.00% 14.00% 0 10.00% 0.00% 10.00% 1493.80 1178.52 233D 1 58.00% 42.00% 0 1.00% 0.00% 1.00% 0 0.00% 0.00% 0.00% 1973.56 1018.86 Weekly 99.00% Adv Dec PUVU PUVD PDVU PDVD 80.00% 19.00% 40.00% 40.00% 9.00% 10.00% Moving Averages High/Lows Index Above Below Index Highs Lows Net 13W 1 92.00% 8.00% 1 45.00% 0.00% 45.00% 55W 1 49.00% 51.00% 0 0.00% 0.00% 0.00% 233W -1 32.00% 68.00% 0 0.00% 0.00% 0.00%
- 3. COB: Thu 04-Jun-09 Index S&P500 - $SPX IdxMatch 2739 PriceUp 41.60% Symbol SP-500 942.46 NumCons 500 VolumeUp -12.80% Daily 98.80% Adv Dec PUVU PUVD PDVU PDVD 70.20% 28.60% 29.80% 40.40% 13.20% 15.40% Moving Averages High/Lows BreakOuts Levels Index Above Below Index Highs Lows Net Index Highs Lows Net Highs Lows 3D 1 66.80% 33.20% 0 18.60% 18.20% 0.40% 0 11.20% 4.60% 6.60% 949.38 923.85 13D 1 82.60% 17.40% 0 15.60% 1.00% 14.60% 0 9.20% 0.20% 9.00% 949.38 879.61 55D 1 88.60% 11.40% 0 9.20% 0.60% 8.60% 0 6.00% 0.00% 6.00% 949.38 765.64 233D -1 43.20% 56.80% 0 0.60% 0.20% 0.40% 0 0.40% 0.00% 0.40% 1313.15 666.79 Weekly 99.00% Adv Dec PUVU PUVD PDVU PDVD 79.40% 19.60% 39.00% 40.40% 11.40% 8.20% Moving Averages High/Lows Index Above Below Index Highs Lows Net 13W 1 89.00% 11.00% 1 41.00% 0.60% 40.40% 55W -1 33.00% 67.00% 0 0.60% 0.60% 0.00% 233W -1 17.20% 82.80% 0 0.00% 0.40% (0.40%)
- 4. COB: Thu 04-Jun-09 Index Russell1000 - $RUI IdxMatch 2580 PriceUp 49.54% Symbol RUI-X 514.96 NumCons 969 VolumeUp -6.19% Daily 99.07% Adv Dec PUVU PUVD PDVU PDVD 74.30% 24.77% 34.16% 40.14% 12.28% 12.49% Moving Averages High/Lows BreakOuts Levels Index Above Below Index Highs Lows Net Index Highs Lows Net Highs Lows 3D 1 68.83% 31.17% 0 20.23% 17.96% 2.27% 0 13.52% 4.33% 9.18% 518.95 504.72 13D 1 82.46% 17.54% 0 17.23% 1.75% 15.48% 0 11.25% 0.62% 10.63% 518.95 480.15 55D 1 88.44% 11.56% 0 9.08% 0.41% 8.67% 0 6.30% 0.10% 6.19% 518.95 415.55 233D -1 44.69% 55.31% 0 0.62% 0.10% 0.52% 0 0.41% 0.00% 0.41% 716.82 362.27 Weekly 98.97% Adv Dec PUVU PUVD PDVU PDVD 78.95% 20.02% 36.74% 42.21% 10.42% 9.60% Moving Averages High/Lows Index Above Below Index Highs Lows Net 13W 1 88.34% 11.66% 1 41.28% 0.41% 40.87% 55W -1 36.22% 63.78% 0 0.83% 0.41% 0.41% 233W -1 19.50% 80.50% 0 0.10% 0.21% (0.10%)
- 5. COB: Thu 04-Jun-09 Index Russell2000 - $RUT IdxMatch 2583 PriceUp 54.58% Symbol RUT-X 531.68 NumCons 1900 VolumeUp -2.58% Daily 96.79% Adv Dec PUVU PUVD PDVU PDVD 75.74% 21.05% 36.32% 39.32% 10.74% 10.32% Moving Averages High/Lows BreakOuts Levels Index Above Below Index Highs Lows Net Index Highs Lows Net Highs Lows 3D 1 79.63% 20.37% 1 38.05% 9.32% 28.74% 1 28.63% 2.16% 26.47% 531.68 516.69 13D 1 85.79% 14.21% 1 31.21% 1.47% 29.74% 1 22.89% 0.63% 22.26% 531.68 474.50 55D 1 84.63% 15.37% 1 16.05% 0.32% 15.74% 1 12.16% 0.21% 11.95% 531.68 398.96 233D 1 46.21% 53.79% 0 1.47% 0.11% 1.37% 0 1.16% 0.11% 1.05% 764.38 342.59 Weekly 98.74% Adv Dec PUVU PUVD PDVU PDVD 85.74% 13.00% 43.32% 42.42% 6.63% 6.37% Moving Averages High/Lows Index Above Below Index Highs Lows Net 13W 1 84.00% 16.00% 1 35.89% 0.42% 35.47% 55W -1 39.53% 60.47% 0 3.37% 0.32% 3.05% 233W -1 20.42% 79.58% 0 0.74% 0.26% 0.47%
- 6. COB: Thu 04-Jun-09 Index Russell3000 - $RUA IdxMatch 2579 PriceUp 52.81% Symbol RUA-X 550.01 NumCons 2869 VolumeUp -3.87% Daily 97.56% Adv Dec PUVU PUVD PDVU PDVD 75.22% 22.34% 35.55% 39.60% 11.26% 11.08% Moving Averages High/Lows BreakOuts Levels Index Above Below Index Highs Lows Net Index Highs Lows Net Highs Lows 3D 1 76.02% 23.98% 0 32.03% 12.20% 19.83% 0 23.53% 2.89% 20.63% 553.36 538.72 13D 1 84.70% 15.30% 0 26.49% 1.57% 24.92% 0 18.96% 0.63% 18.33% 553.36 511.13 55D 1 85.95% 14.05% 0 13.70% 0.35% 13.35% 0 10.18% 0.17% 10.00% 553.36 441.40 233D -1 45.73% 54.27% 0 1.19% 0.10% 1.08% 0 0.91% 0.07% 0.84% 766.82 384.41 Weekly 98.81% Adv Dec PUVU PUVD PDVU PDVD 83.44% 15.37% 41.13% 42.31% 7.91% 7.46% Moving Averages High/Lows Index Above Below Index Highs Lows Net 13W 1 85.50% 14.50% 1 37.75% 0.42% 37.33% 55W -1 38.45% 61.55% 0 2.54% 0.35% 2.20% 233W -1 20.11% 79.89% 0 0.52% 0.24% 0.28%
- 7. COB: Thu 04-Jun-09 Index S&P400 - $MID IdxMatch 1991 PriceUp 51.00% Symbol MID--X 596.94 NumCons 400 VolumeUp 6.50% Daily 99.00% Adv Dec PUVU PUVD PDVU PDVD 75.00% 24.00% 40.25% 34.75% 12.50% 11.50% Moving Averages High/Lows BreakOuts Levels Index Above Below Index Highs Lows Net Index Highs Lows Net Highs Lows 3D 1 72.00% 28.00% 0 25.50% 15.25% 10.25% 0 17.75% 3.00% 14.75% 601.48 583.62 13D 1 84.25% 15.75% 0 22.25% 1.75% 20.50% 0 14.50% 0.50% 14.00% 601.48 545.68 55D 1 85.00% 15.00% 0 11.50% 0.00% 11.50% 0 9.00% 0.00% 9.00% 601.48 458.68 233D 1 49.50% 50.50% 0 1.25% 0.00% 1.25% 0 0.75% 0.00% 0.75% 828.09 397.97 Weekly 99.50% Adv Dec PUVU PUVD PDVU PDVD 84.75% 14.75% 36.00% 48.75% 7.25% 7.50% Moving Averages High/Lows Index Above Below Index Highs Lows Net 13W 1 85.00% 15.00% 1 41.25% 0.25% 41.00% 55W -1 42.00% 58.00% 0 2.25% 0.25% 2.00% 233W -1 25.50% 74.50% 0 0.75% 0.00% 0.75%
- 8. COB: Thu 04-Jun-09 Index S&P600 - $SML IdxMatch 2703 PriceUp 60.60% Symbol SML--X 280.80 NumCons 599 VolumeUp 0.50% Daily 98.83% Adv Dec PUVU PUVD PDVU PDVD 79.80% 19.03% 39.07% 40.57% 10.52% 8.51% Moving Averages High/Lows BreakOuts Levels Index Above Below Index Highs Lows Net Index Highs Lows Net Highs Lows 3D 1 82.64% 17.36% 1 41.24% 11.02% 30.22% 1 31.89% 2.50% 29.38% 280.80 273.02 13D 1 87.15% 12.85% 1 33.72% 2.00% 31.72% 1 25.54% 0.83% 24.71% 280.80 251.81 55D 1 85.98% 14.02% 1 15.86% 0.50% 15.36% 1 12.35% 0.33% 12.02% 280.80 209.58 233D 1 48.41% 51.59% 0 2.17% 0.17% 2.00% 0 1.84% 0.17% 1.67% 401.27 181.32 Weekly 98.83% Adv Dec PUVU PUVD PDVU PDVD 88.15% 10.68% 43.41% 44.74% 6.01% 4.67% Moving Averages High/Lows Index Above Below Index Highs Lows Net 13W 1 85.64% 14.36% 1 36.23% 0.17% 36.06% 55W -1 43.41% 56.59% 0 4.01% 0.17% 3.84% 233W -1 23.54% 76.46% 0 0.83% 0.17% 0.67%