The Science of What's In the Bottle: Factors Which Influence pH of White Wine
•Transferir como DOC, PDF•
1 gostou•647 visualizações

In this study, type, temperature, and time elapsed from initial opening were examined to determine their influence on pH of white wine. A 23 experimental design was used and four bottles each of Chardonnay and Pinot Grigio were used as replicates. Of the three individual factors and four possible interactions, there were three significant results (p<.05) for which the null hypothesis was rejected. Practical applications of these results suggests that individuals can benefit by making an effort to hold wine glasses by the stem, preventing heat transfer and subsequent increases in acidity.

Recomendados
Recomendados
Mais conteúdo relacionado
Mais procurados
Mais procurados (10)
Destaque
Semelhante a The Science of What's In the Bottle: Factors Which Influence pH of White Wine
Semelhante a The Science of What's In the Bottle: Factors Which Influence pH of White Wine (20)
Mais de Lindsay Meyer
Mais de Lindsay Meyer (17)
Último
Último (20)
The Science of What's In the Bottle: Factors Which Influence pH of White Wine
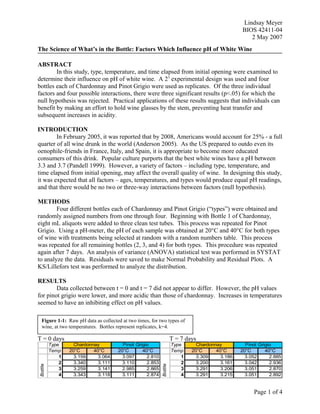
- 1. Type Temp 20°C 40°C 20°C 40°C 1 3.159 3.064 3.097 2.810 2 3.340 3.111 3.110 2.853 3 3.259 3.141 2.985 2.865 4 3.343 3.118 3.111 2.874 Chardonnay Pinot Grigio Bottle Type Temp 20°C 40°C 20°C 40°C 1 3.309 3.186 3.052 2.885 2 3.200 3.161 3.042 2.936 3 3.291 3.206 3.051 2.870 4 3.291 3.215 3.051 2.892 Chardonnay Pinot Grigio Bottle Lindsay Meyer BIOS 42411-04 2 May 2007 The Science of What’s in the Bottle: Factors Which Influence pH of White Wine ABSTRACT In this study, type, temperature, and time elapsed from initial opening were examined to determine their influence on pH of white wine. A 23 experimental design was used and four bottles each of Chardonnay and Pinot Grigio were used as replicates. Of the three individual factors and four possible interactions, there were three significant results (p<.05) for which the null hypothesis was rejected. Practical applications of these results suggests that individuals can benefit by making an effort to hold wine glasses by the stem, preventing heat transfer and subsequent increases in acidity. INTRODUCTION In February 2005, it was reported that by 2008, Americans would account for 25% - a full quarter of all wine drunk in the world (Anderson 2005). As the US prepared to outdo even its oenophile-friends in France, Italy, and Spain, it is appropriate to become more educated consumers of this drink. Popular culture purports that the best white wines have a pH between 3.3 and 3.7 (Pandell 1999). However, a variety of factors – including type, temperature, and time elapsed from initial opening, may affect the overall quality of wine. In designing this study, it was expected that all factors – ages, temperatures, and types would produce equal pH readings, and that there would be no two or three-way interactions between factors (null hypothesis). METHODS Four different bottles each of Chardonnay and Pinot Grigio (“types”) were obtained and randomly assigned numbers from one through four. Beginning with Bottle 1 of Chardonnay, eight mL aliquots were added to three clean test tubes. This process was repeated for Pinot Grigio. Using a pH-meter, the pH of each sample was obtained at 20°C and 40°C for both types of wine with treatments being selected at random with a random numbers table. This process was repeated for all remaining bottles (2, 3, and 4) for both types. This procedure was repeated again after 7 days. An analysis of variance (ANOVA) statistical test was performed in SYSTAT to analyze the data. Residuals were saved to make Normal Probability and Residual Plots. A KS/Lillefors test was performed to analyze the distribution. RESULTS Data collected between t = 0 and t = 7 did not appear to differ. However, the pH values for pinot grigio were lower, and more acidic than those of chardonnay. Increases in temperatures seemed to have an inhibiting effect on pH values. T = 0 days T = 7 days Page 1 of 4 Figure 1-1: Raw pH data as collected at two times, for two types of wine, at two temperatures. Bottles represent replicates, k=4.
- 2. 2.8 2.9 3.0 3.1 3.2 3.3 ESTIMATE -0.2 -0.1 0.0 0.1 RESIDUAL -0.2 -0.1 0.0 0.1 RESIDUAL 0.01 0.99 ExpectedFractionofDataforNormalDistribution Lindsay Meyer BIOS 42411-04 2 May 2007 Statistical testing with SYSTAT produced an ANOVA table (Figure 1-2) with three p- values which were greater than α = 0.05: type, temperature, and time*temperature. Their respective null hypotheses of equal pH (for single factors) or independence (for interaction terms) were rejected. The remaining four p-values were less than α = 0.05 and their respective null hypotheses of equal pH (for single factors) or independence (for interaction terms) were accepted. Source SS df MS F P Conclusion TYPE$ 0.478 1 0.478 226.249 0 Reject ELAPSEDTIME$ 0.005 1 0.005 2.344 0.139 Accept TEMPERATURE 0.196 1 0.196 92.79 0 Reject TYPE$*ELAPSEDTIME$ 0.002 1 0.002 0.925 0.346 Accept TYPE$*TEMPERATURE 0.009 1 0.009 4.063 0.055 Accept ELAPSEDTIME$*TEMPERATURE 0.012 1 0.012 5.911 0.023 Reject TYPE$*ELAPSEDTIME$*TEMPERATURE 0 1 0 0.046 0.831 Accept Error 0.051 24 0.002 Further analysis was performed in SYSTAT. The residual plot demonstrated equal variance among treatments as most of the points occurred along the line representing the expected normal distribution. The normal probability plot was indicative of normality, with the residuals occurring along a horizontal band. Page 2 of 4 Figure 1-3: Residual Plot shows the residuals versus expected values and displays equal variance among treatments. Figure 1-4: Normal Probability Plot shows the residuals occurring within a reasonably horizontal band, demonstrating normality. Figure 1-2: Analysis of Variance Table displays the test-statistics for all three factors plus the three 2-way interactions and one 3-way interaction.
- 3. Lindsay Meyer BIOS 42411-04 2 May 2007 Finally, the data were tested with the KS-Lillefors test for normality. The p-value of 0.065 exceeded alpha = 0.05 and indicated that the data were normal. VARIABLE N-of-Cases MaxDif Lillefors Probability (2-tail) RESIDUAL 32 0.15 0.065 DISCUSSION According to the p-values produced in the ANOVA table, we reject the null hypothesis that both types of wine produce equal pH. This indicates that chardonnay and pinot grigio do not have equal pH’s. The same was true for the two temperatures, 20°C and 40°C – that they do not give rise to equal pH values. The null hypothesis for equal pH values at two different times – 0 and 7 days was accepted, with p = 0.139. Empirical differences in formulation are the likely cause of pH differences between types. From differences in fermentation technique to differences in grape harvests, it is not surprising that the two brands had significantly different pH levels. The significant difference in pH at 20°C and 40°C is more difficult to source. It is possible that pH-altering chemical reactions occur as heat is added. For the three 2-factor interactions, only time crossed with temperature was rejected, signaling an interaction between factors. The null hypothesis of the one 3-way interaction was accepted; differences in pH are independent of type, temperature, and elapsed time. The practical application of this study is that pH of wine changes significantly as temperature is manipulated. Increases in temperature lead to decreases in pH, thus increasing the overall acidity. There are also differences in pH between chardonnay and pinot grigio, which suggests that there are differences in the pH between all types of white wine. Additional differences may exist for different brands of the same type of wine. Disparities may be the result of differences in production, harvest techniques, and general composition. Further experimentation could be performed with additional types (white zinfandel, sauvignon blanc, and so on). Oenophiles can rest easier, equipped with the knowledge that it’s acceptable to drink from an opened bottle of wine, even after leaving it out for a week – pH doesn’t significantly change during this time horizon. While the prevailing notion is that one should keep white wines stored in a refrigerator (5°C), consumers should be aware that this will decrease the acidity. Sophisticated wine drinkers can also be commended for insisting that wine glasses ought to be held by the stem. Human heat transfer from hand to glass to wine could expedite the warming process, thereby increasing acidity. This study did not attempt to make any conclusions about taste. Individual preferences are ultimately responsible for such determinations and were not evaluated in tangent with this study. Additional experiments could be performed to allow multiple human subjects to sample each replicate and provide numerical feedback regarding their level of satisfaction with respect to taste. This would be a proxy for taste and pH. Other interesting follow up experiments could contrast the pH of reds versus whites or a wider range of temperatures. Page 3 of 4 Figure 1-5: Kolmogorov-Smirnov one sample test is a criterion for accepting or rejecting the null hypothesis of normality. Because p>α, the data are normally distributed.
- 4. Lindsay Meyer BIOS 42411-04 2 May 2007 In addition, this study had flawed experimental design because of pseudo replication. Rather than using 32 different bottles of wine – or 16 of both types, aliquots were from the same bottle. Additional statistical analysis using a block effect for the four bottles of each type would help to remove these effects and represent a viable opportunity for additional study. LITERATURE CITED Anderson, Gordon. “World’s Biggest Wine Country: USA.” CNN Money 2005. Accessed 1 May 2007 <http://money.cnn.com/2005/02/18/pf/goodlife/america_wine/> Pandell, Alexander J. “The Acidity of Wine.” The Wine Perspective 1999. Accessed 1 May 2007 <http://www.wineperspective.com/the_acidity_of_wine.htm> Page 4 of 4