
Recommended
More Related Content
What's hot
What's hot (20)
Viewers also liked
Viewers also liked (20)
Similar to Lib
Similar to Lib (20)
Lib
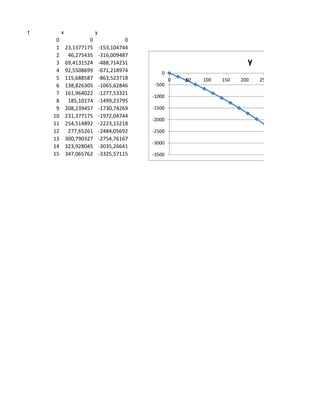
- 1. t x y 0 0 0 1 23,1377175 -153,104744 2 46,275435 -316,009487 3 69,4131524 -488,714231 y 4 92,5508699 -671,218974 0 5 115,688587 -863,523718 0 50 100 150 200 250 6 138,826305 -1065,62846 -500 7 161,964022 -1277,53321 -1000 8 185,10174 -1499,23795 9 208,239457 -1730,74269 -1500 10 231,377175 -1972,04744 -2000 11 254,514892 -2223,15218 12 277,65261 -2484,05692 -2500 13 300,790327 -2754,76167 -3000 14 323,928045 -3035,26641 15 347,065762 -3325,57115 -3500
- 2. 250 300 350 400 y