SlideShare a Scribd company logo
1 of 48
Download to read offline
Please refer to important disclosures on pages 46 and 47. Analyst certification is on page 46.
William Blair does and seeks to do business with companies covered in its research reports. As a result, inves-
tors should be aware that the firm may have a conflict of interest that could affect the objectivity of this report.
Investors should consider this report as a single factor in making an investment decision.
Equity Research
Healthcare | Healthcare Services and Healthcare Technology
Consumer-Centric Healthcare: 2015 Update
The Tipping Point Has Arrived
In January 2005, we published the irst of our continuing series of reports on the
evolving role of the consumer in the U.S. healthcare market. The report, titled The
Power of Choice: On the Brink of a Consumer Revolution in Health Care, provided our
expectations for the most signi icant developments in the healthcare marketplace
over the coming years.
Adecadelater,ourthesisremainsintactandcontinuestounfoldrapidly.Wecontinue
to believe that consumers—in tandem with disruptive healthcare technology and
healthcare services providers—are the key to solving many of healthcare’s woes,
particularly the unsustainably high cost of care in the United States.
Our 2015 report also comes at an interesting time, as myriad trends have solidi ied
the consumer—through public exchanges, private exchanges, and high-deductible
health plans—as the fastest-growing payer of healthcare in the United States. This
development is beginning to unleash our long-standing theory that the disruptive
forces of competition will create a lower-cost system that promotes the growth of
highly ef icient, low-cost, and high-quality providers and technologies.
Equally important, the continued movement of inancial and quality risk back to
providers (and increasingly to consumers themselves) is creating one of the more
important changes witnessed in the U.S. healthcare delivery system in decades;
put simply, we believe that providers and consumers alike will seek preventive
medicine, cost ef iciency, clinical ef icacy, and overall value in healthcare more
than ever before. In turn, this could drive signi icant change regarding the primary
point of care delivery in the United States (rapidly moving outside the hospital), the
overall cost of healthcare in our country (no longer trending well above the rate of
GDP growth), and the investment decisions made by healthcare providers (more
investments in data analytics, telehealth solutions, patient engagement strategies,
well-being solutions, and ambulatory operations). However, given the complex and
politically charged nature of healthcare, we also acknowledge that changes to long-
standing delivery and reimbursement models likely will be drawn out, complex,
and nonlinear.
Still, we continue to believe that consumer-centric healthcare providers (or those
companies that provide the technology and services to enable more consumer
empowerment, quality, and ef iciency) will experience strong top- and bottom-line
growth over the coming years. Moreover, we believe that investors in both the public
and private-equity markets will achieve superior long-term returns by identifying
and investing in these companies. The purpose of this report—now the 11th in our
annual series on the topic—is to assist in that process.
Ryan S. Daniels, CFA Jeffrey Garro Nick Hiller
+1 312 364 8418 +1 312 364 8022 +1 312 364 8326
rdaniels@williamblair.com jgarro@williamblair.com nhiller@williamblair.com
January 6, 2015
Industry Report (15-002)
2 Ryan S. Daniels, CFA +1 312 364 8418
William Blair & Company, L.L.C.
Contents
Introduction.................................................................................................................................................................3
Factor One: The High Cost of Healthcare in the United States...................................................8
Factor Two: Increased Availability of Healthcare Price and Quality Information ..... 13
Factor Three: Greater Use of HCIT Will Enable the CDHC Revolution................................. 22
Factor Four: More Financial and Quality Responsibility Borne by Healthcare
Consumers ................................................................................................................................................ 31
Factor Five: Health Insurers, Employers, and Consumers Are Embracing
Consumerism .......................................................................................................................................... 37
Summary and Investment Conclusions..................................................................................................... 41
Emerging Investment Themes................................................................................................................. 42
Emerging Investment Risks...................................................................................................................... 43
List of Public and Private Consumer-Centric Healthcare Companies................................. 44
3Ryan S. Daniels, CFA +1 312 364 8418
William Blair & Company, L.L.C.
Introduction
During the past decade, we have consistently written about the emerging trend of consumerism
in the healthcare marketplace, and how this trend held the potential to radically reshape the U.S.
healthcare delivery system for the better.
While our conviction in this topic never waned, the rate of change was slower than we anticipated—
as myriad inancial, political, and structural headwinds upheld the status quo, despite a number
of emerging market forces. More recently, however, a convergence of events has rapidly pushed
our thesis forward, and we believe a tipping point has arrived that is markedly changing the U.S.
healthcare landscape.
However, before addressing this changing environment, we believe it is instructive to review the
past, especially the various in lection points that have occurred over the last several decades, which
are now converging to make our consumer-centric thesis a reality. We brie ly recap these key in lec-
tion points below.
The Medicare Prescription Drug, Improvement, and Modernization Act. Near the end of 2003,
President George W. Bush signed the Medicare Prescription Drug, Improvement, and Moderniza-
tion Act (MMA) into law. While the marquee element of MMA was the introduction of a prescription
drug bene it into Medicare, the legislation also created a new health savings account (HSA) statute,
which allowed individuals to put pretax dollars into healthcare savings accounts that were paired
with high-deductible health plans (HDHPs).
While such plans had only limited traction at irst, they have since become the fastest-growing
health plan offering in the United States, now accounting for roughly 20% of all privately insured
individuals in the country (up from only 4% in 2006). Along with other bene it changes, the momen-
tum in HDHPs has driven the average annual deductible for covered workers in the United States
up by more than 100% since 2006; a 2014 Kaiser Family Foundation study reports that average
deductibles have risen from only $584 in 2006 to $1,217 in 2014. In our view, this has been a clear
boost for consumer-centric healthcare, as the incentive to become a more price-conscious consumer
rises in tandem with deductible levels.
Inaddition,averageHDHPsnowcarrydeductiblesofmorethan$2,000—roughlythreetimesgreater
than the average PPO deductible of slightly more than $700. In turn, patients with HDHPs are likely
to encounter signi icantly more medical procedures that fall within their deductible (i.e., become
out-of-pocket expenditures). As a result, while it was unheard of to have insured workers covering
the full costs of MRIs, endoscopies, cataract surgeries, and other non-acute procedures in the recent
past, it is now commonplace for one in ive patients to face this reality. Accordingly, providers are
now being pushed to offer price transparency for their services and have, for the irst time, also begun
to compete on price to maintain market share.
Overall, we believe the MMA legislation of 2003 is an underappreciated element of consumer-centric
healthcare, yet its enactment created the foundation for the high-deductible plans, which are now
sweeping the nation and putting more inancial responsibility directly into the hands of consumers.
The Patient Protection and Affordable Care Act. In early 2010, President Barack Obama signed
the Patient Protection and Affordable Care Act (ACA) into law. While the marquee piece of this leg-
islation was expanded healthcare coverage for the uninsured, the law also contained a number of
important elements that are now serving as key drivers of consumer-centric healthcare.
4 Ryan S. Daniels, CFA +1 312 364 8418
William Blair & Company, L.L.C.
First, the law contained a wide variety of reforms to the Medicare payment system, which encourage
a movement from a fee-for-service reimbursement structure to a fee-for-value environment. While
the most well-known of these changes was the introduction of Medicare Accountable Care Organiza-
tions (or ACOs), there also were a variety of bundled payment structures and novel reimbursement
penalties—all of which combine to push providers toward bearing more inancial and quality risk
for the care they provide. In our view, this has begun a massive shift in the healthcare marketplace,
as providers are now incented to reduce the costs of care, focus on preventive medicine, and better
engage consumers to understand their wants and needs and to help empower them to make lifestyle
changes that lower long-term healthcare costs.
In tandem with these changes—and to help fund the ACA’s coverage expansion—the law also put in
place a number of rate reductions and additional penalties, which will begin to pressure acute-care
hospitals’ Medicare margins over the coming years and (as we discuss later) require fundamental
changes in the way hospitals manage their operations.
In addition, the legislation established health insurance exchanges, where individuals can seek
out a wide variety of insurance plans to meet their coverage needs. Importantly, roughly 20% of
participants on the exchanges have purchased Bronze plans, while nearly 65% have purchased
Silver plans. This is important because Silver plans are expected to have an average individual an-
nual deductible of nearly $2,400 in 2015, while Bronze plans will hold a nearly $5,200 individual
deductible. Thus, we estimate that more than 85% of the exchange population will fall in the HDHP
category, which will stimulate further price shopping and consumer-centric behavior for these par-
ticipants, as discussed above.
Lastly, the ACA presented a novel excise tax on high-cost employer medical plans (often referred
to as the “Cadillac tax”). This nondeductible tax, which takes effect in 2018, will require insurers
(including employers for self-insured plans) to pay a 40% excise tax on the aggregate value of
employer-sponsored insurance in excess of speci ied thresholds (in 2018, $10,200 for individual
coverage and $27,500 for family coverage, with some exceptions). While few plans are expected to
trigger this tax in 2018, it is estimated that as many as 50% to 75% of employers will face this tax
over the next decade, as health insurance costs continue to rise. Thus, to offset this tax, we anticipate
even more employers will move populations onto HDHPs (which are much less likely to face the tax,
given their signi icantly higher deductibles and lower premium costs), which we believe will help
further accelerate the consumer-centric trends discussed above.
Demographic trends are actually working against many providers…Many investors view the
aging U.S. population as a bullish sign for healthcare providers—as seniors tend to use healthcare
services at a disproportionate rate compared with other age cohorts. As a result, it follows that
the increase in Medicare bene iciaries from about 54 million today to a projection of more than 64
million by 2020 is bullish for the healthcare industry.
However, given the recent baby bust and lower healthcare utilization in the commercial population,
it is estimated that the average hospital’s case mix will move from approximately 42% Medicare in
2012 to roughly 58% Medicare in 2022. In our view, this is quite troubling for providers, as the aver-
age hospital gross margin on Medicare patients is modestly negative at present (with the American
Hospital Association estimating a Medicare payment-to-cost ratio of 0.86 in 2012); moreover, this
is set to worsen signi icantly going forward (exhibit 1), as nearly $260 billion in Medicare hospital
payment cuts are scheduled to occur through 2022.
5Ryan S. Daniels, CFA +1 312 364 8418
William Blair & Company, L.L.C.
Source: Tennessee Hospital Association
Exhibit 1
Consumer-Driven Healthcare
Declining Medicare Reimbursement Expected to Pressure Margins
(25.0)%
(20.0)%
(15.0)%
(10.0)%
(5.0)%
0.0%
5.0%
AverageChangeinMedicare
Reimbursement
…and cross-subsidizing with higher commercial rates is no longer possible. Given the abovemen-
tioned scenario, the standard operating procedure for hospitals would be to simply cross-subsidize
underpaymentsfrompublicpayerswithhighercommercialrates(theAmericanHospitalAssociation
estimates a 2012 payment-to-cost ratio of 1.49 with private payers). Unfortunately for providers,
we believe their ability to do so has greatly diminished over the last ive years—as employers have
pushed back hard against rising healthcare costs and as individuals now bear markedly greater
healthcare inancial responsibility than ever before, thus making it dif icult for hospitals to push
up price with impunity.
Combined with the abovementioned mix shift toward Medicare cases, it is this trend that has driven
many leading providers to accept the fact that their traditional business model is slowly dying. In turn,
this is pushing leading providers in nearly every market across the United States into more popula-
tion health management arrangements with commercial and government payers (and even driving
a number of leading providers to buy insurers or apply for insurance licenses).
As mentioned earlier, we believe that better understanding individuals’ needs and preferences, as
well as treating them more like consumers, will be a key to making this conversion work. Moreover,
it will be critical to view patient volume as a key cost driver (versus pro it driver) in the near future,
which we believe will soon put consumer-centricity and well-being at the heart of each provider’s
operating model.
Theriseoftheindividualhealthinsurancemarketalsoisakeydriver.Anothermegatrendsweep-
ing the healthcare industry is the rise of the retail insurance market. For example, it is estimated
that roughly 2 million individuals bought insurance via a private health insurance exchange in 2014,
but this number is expected to skyrocket to nearly 40 million individuals by 2018. As we discussed
in our 2014 report, we view this as a key driver of consumer-centric healthcare, as individuals will
have signi icantly greater choice in (and likely more inancial responsibility for) their health plan
options, thus becoming more active healthcare consumers from the outset.
Combing this metric with other retail insurance markets (e.g., Medicare Advantage, the public
exchanges, and private Medicaid options), The Advisory Board Company estimates that the retail
health insurance market will grow to nearly 87 million members by 2018 (exhibit 2), which equates
to nearly a quarter of the total projected U.S. population before the end of the decade.
6 Ryan S. Daniels, CFA +1 312 364 8418
William Blair & Company, L.L.C.
Exhibit 2
Consumer-Driven Healthcare
Retail Market Expected to Grow to 87 Million Enrollees by 2018
Sources: Congressional Budget Office, Accenture, Kaiser Family Foundation, and The Advisory Board
Company
25 million
5 million
40 million
17 million 87 million
Public
exchange
"Private Option"
Medicaid
expansion
Private
exchanges
Medicare
exchanges
Total retail
market
Also of note, as risk dollars shift into these retail insurance markets, there is a signi icant movement
from actuarial underwriting to individual underwriting. More speci ic, payments for members in
these plans are generally driven by the actual disease states and comorbidity level of individual
patients, and quality bonuses are paid based on the individual outcomes of patients. This ensures
that providers with higher-risk (sicker) patients are paid more to manage their care. Or, stated dif-
ferently, it ensures that cherry-picking of only the healthiest patients in each market (same payment
but lower overall costs) does not occur.
Therefore, there is also a clear need for data analytics to help payers better understand each patient’s
speci ic risk characteristics and health status, as both revenue integrity and compliance are now
dependent on it. Moreover, as quality measures are now monitored on an individual patient basis,
there is an increased need for these payers to engage consumers more actively in care management
and well-being initiatives than ever before.
Technologyisbecominganenablerofconsumer-centrichealthcare.Lastly,webelievethemassive
investments in electronic health records should yield marked improvements in the U.S. healthcare
system over time. To be fair, EHRs arguably yield little value to consumers on their own; however,
as data is now stored electronically, the next generation of healthcare technologies will focus on
better communicating that data to the patient and other providers, risk stratifying patients more
accurately, reducing waste, and providing more preventive care—at the lowest cost—to those at
risk (both at the right time and in the best venue).
Webelievethishasthepotentialtoyieldmarkedimprovementsinpatientcareandcosttrendsacross
the United States, further enabling providers to bear inancial and quality risk that was impractical
to manage under the paper-based systems of yesteryear. Again, as this arises, much greater engage-
ment of the consumer will be key and, in our view, is eminently achievable.
Outside of electronic health records and the coming wave of big data in healthcare technology, there
are myriad other factors that should enable a more consumer-centric marketplace. More speci ic,
trends like telehealth, biometric monitors, and pricing and quality data applications should yield a
healthcare marketplace that eventually resembles the rest of the economy (versus being isolated
against innovations that have bene ited other areas of society).
7Ryan S. Daniels, CFA +1 312 364 8418
William Blair & Company, L.L.C.
Perhaps the next question then becomes: Why did it take so long to get to this point, and
why are we so convinced the in lection point is here? This is a much more dif icult question to
answer, as the factors driving this change are myriad and interrelated, and are discussed in more
detail throughout our reports over the last decade.
In summary, however, we believe that all the abovementioned trends—some of which have been
in place for decades—are only now converging to force this change. For example, the movement
of HDHPs to 20% market share (12 years in the making) and the pending wave of retail insur-
ance growth (more novel, but with roots stemming back to the 1980s) are all but eliminating the
ability for hospitals to consistently raise commercial prices to cross-subsidize weak government
reimbursements.
Combined with unfavorable demographic trends (emerging) and reduced Medicare payments (via
the 2010 ACA legislation and sequestration cuts in 2013), this is driving most providers down a
path toward increased inancial and clinical risk bearing (a 2012 starting point), which is turning
the healthcare business model on its head (today); more speci ic, patient volume moves from a
key pro it driver in the old world to the key direct cost in the new healthcare paradigm. And
this has led to a dramatic change in how providers view the healthcare consumer today.
As a result, the many consumer-centric and low-cost solutions that were once rejected by provid-
ers as against their best interests (reducing volumes negatively affected sales under fee-for-service
models) should emerge and be embraced as key solutions for their cost-reduction and quality-
improvement initiatives going forward. In turn, we believe this will continue to drive a signi icant
amount of disruption to traditional healthcare business models over the coming years.
So what does all of this mean for healthcare providers and the public- and private-market
investors who help fund their growth? We believe that as the healthcare marketplace becomes
more consumer-centric, the disruptive forces of competition will create a system that promotes
growth of highly ef icient, low-cost, and high-quality providers and technologies. In turn, we expect
that more consumer-centric healthcare services and information technology providers (such as
those pro iled in this report) will experience strong top- and bottom-line growth over the coming
years. Moreover, we believe that investors will achieve superior long-term returns by identifying
and investing in these companies.
To assist investors in this process, we present an updated overview of the emerging consumer-
centric healthcare marketplace. In particular, we focus on recent developments surrounding the
ive key elements that we believe will drive greater growth of consumer-centric healthcare over
the coming years:
1. a dire need for healthcare cost control in the United States, which remains pressing despite the
recent slowdown in healthcare expenditure growth;
2. increased quality and pricing transparency for healthcare products and services;
3. greater use of healthcare information technology solutions among providers and consumers;
4. growing responsibility for healthcare utilization and quality at both the consumer and provider
levels; and
5. increasing employer, insurer, and consumer support for more consumer-centric healthcare
solutions.
8 Ryan S. Daniels, CFA +1 312 364 8418
William Blair & Company, L.L.C.
After this analysis, we provide investors with an overview of key investment merits and risks to
monitor over the coming years; we then conclude our report with our updated list of some of the
leading consumer-centric healthcare operators in both the public and private markets, which we
believe are well positioned for growth over the coming years.
Factor One: The High Cost of Healthcare in the United States
Before discussing consumer-centric healthcare drivers in more detail, we begin with a brief update
on perhaps the most pervasive trend in healthcare today—its sizable cost. We believe this discus-
sion is crucial as exorbitant healthcare costs and the structural inef iciencies that support them
continue to serve as two of the most important impetuses for broader change in the marketplace.
To be fair, U.S. healthcare expenditures have experienced a dramatic slowdown over the last sev-
eral years. In fact, a recent government report showed that total U.S. health expenditures in 2013
increased at the slowest rate in decades: per capita spending grew only 2.9% in 2013, compared
with 3.4% in 2012 and 5.3%, on average, between 2004 and 2008.
Still, whether or not this cost trend has staying power remains to be seen, and the impact of cyclical-
ity versus structural considerations (including consumer-centric healthcare) remains the subject
of intense debate among experts. Historically, healthcare spending growth has trended in line with
overall gross domestic product (GDP) growth during economic expansions; it follows that accelera-
tion in spending in 2014 and beyond is likely, in our view, especially given incremental spending
driven by the expanded health insurance coverage afforded via the ACA.
Equally important, despite the recent slowdown in growth rates, healthcare expenditures continue
to increase at rates greater than or equal to GDP (and off a very large base), thus consuming a greater
portion of our country’s resources. Therefore, we believe there is still a signi icant amount of heavy
lifting ahead—both to maintain lower per-capita health expenditures and to deliver a sustainable
gap between long-term per-capita GDP growth and per-capita healthcare spending.
Other novel data points also continue to demonstrate the need for long-term cost reductions in
U.S. healthcare spending, especially relative to other countries. For example, a recent report by the
International Federation of Health Plans showed that a day spent as an inpatient in an American
hospital costs on average nearly $4,300, well above the cost in other developed countries like Aus-
tralia ($1,308) or Spain ($481). Moreover, the most expensive facilities in the United States charge
more than $12,700 per day for care, without any noticeable difference in the quality of care delivered
(rather, these providers likely have stronger market share and thus can charge much-higher-than-
average rates to payers).
In a more consumer-centric environment, however, we believe these rates would face material pressure,
as consumers would seek to take their business to less expensive, but equally high-quality, locations.
We also believe physician-led population health providers will begin to search out this pricing (with
help from their EHR vendors or other niche providers) and will start to change referral patterns to
help manage cost trends. In turn, these high-cost providers will be pressured to reduce charges or
they will likely begin to see market share erode over time.
Similarly, data from more than 100 million U.S. claims from multiple payers in the 2013 Compara-
tive Price Report (published during 2014 by the International Federation of Health Plans) indicate
that a wide variety of procedures and prescription drugs in the United States cost signi icantly
more than in other developed nations. For example, the average cost of prescription Celebrex in the
United States was roughly $225 (and as high as $461), versus an average of roughly $115 in other
countries, despite being the same product.
9Ryan S. Daniels, CFA +1 312 364 8418
William Blair & Company, L.L.C.
Source: International Federation of Health Plans, 2013 Comparative Price Report
Cost of Celebrex in the United States
Consumer-Driven Healthcare
Exhibit 3
$139
$225
$164
$138
$112 $112
$51
$461
$0
$50
$100
$150
$200
$250
$300
$350
$400
$450
$500
United States Spain Switzerland England Netherlands Canada
USA 25th percentile Average Price USA 95th percentile
Even routine surgical procedures, such as an appendectomy, cost roughly two to three times more
in the United States than in other countries studied (exhibit 4).
Source: International Federation of Health Plans, 2013 Comparative Price Report
Exhibit 4
Consumer-Driven Healthcare
Total Hospital and Physician Costs of an Appendectomy
$8,244
$13,910
$5,467 $5,392 $4,782 $4,463 $4,496 $4,221
$29,499
$0
$5,000
$10,000
$15,000
$20,000
$25,000
$30,000
$35,000
United
States
Switzerland New
Zealand
Australia Netherlands Spain Argentina
USA 25th percentile Average Price USA 95th percentile
Given these exorbitant pricing trends, the overall cost of healthcare coverage also has increased
markedlyoverthelastdecade,despitetherecentslowdowninexpenditures.Forexample,ananalysis
conducted by the Kaiser Family Foundation and Health Research and Educational Trust showed
that, between 2004 and 2014, the average annual premium for employee-only coverage rose 63%,
to $6,025, while family premiums increased 69%, to $16,834, over the same period (exhibit 5, on
page 10).
10 Ryan S. Daniels, CFA +1 312 364 8418
William Blair & Company, L.L.C.
Exhibit 5
Consumer-Driven Healthcare
Average Annual Premiums Have Risen Markedly
Source: Kaiser Family Foundation / Health Research & Educational Trust, Employer Health Benefits
Survey (2014)
$2.2 $2.5 $2.7
$3.1 $3.4 $3.7 $4.0 $4.2 $4.5 $4.7 $4.8 $5.0 $5.4 $5.6 $5.9 $6.0$5.8
$6.4
$7.1
$8.0
$9.1
$10.0
$10.9
$11.5
$12.1
$12.7
$13.4
$13.8
$15.1
$15.7
$16.4
$16.8
$0.0
$2.0
$4.0
$6.0
$8.0
$10.0
$12.0
$14.0
$16.0
$18.0
Averageannualpremium
(thousands)
Single coverage Family coverage
A similar study released in December 2014 by the Commonwealth Fund showed that while family
premiums have increased, by their estimate, roughly 73% since 2003, the median family income
has risen by only 16% over the same period. As a result, the average annual family premiums
accounted for 23% of median family income, up from only 15% in 2003 and 21% in 2010.
Similarly, the study showed that single coverage rose roughly 60% since 2003 versus a rise in me-
dian income for a single-person household of only 11%. Thus, despite the slowdown in recent cost
trends, the pressure to reduce healthcare expenses remains as acute as ever.
Moreover, there has been some fanfare of late regarding the stabilization in the percentage of total
premiums that employers contribute to purchase coverage. In 2013, it is estimated that employees
contributed 21% of the total premiums, unchanged since 2010 andonly a modest increase from 17%
in 2013. However, total premiums have grown markedly over this time frame, from $606 in 2003
(employee-only coverage) to $1,170 in 2013, marking a 93% increase in the actual employee
dollar contribution to coverage premiums over the last decade.
Similar results can be seen in a recent Kaiser/HRET study, which shows the cumulative increases in
health insurance premiums and employee contributions to premiums versus cumulative in lation
and growth in earnings. As shown in exhibit 6, the gap between earnings growth and premium con-
tributed has continued to expand in the last several years, despite the recent spending slowdown,
highlighting the still-urgent need to stem these cost increases.
11Ryan S. Daniels, CFA +1 312 364 8418
William Blair & Company, L.L.C.
Exhibit 6
Consumer-Driven Healthcare
Sources: Kaiser Family Foundation / Health Research & Educational Trust, Employer Health Benefits
Survey (2014); and Bureau of Labor Statistics
Employee Premium Contributions Have Grown Faster than Overall Premiums,
Earnings, and Inflation Since 1999
72%
131%
191%
72%
127%
212%
17%
38%
54%
13%
28%
43%
0%
50%
100%
150%
200%
250%
2004 2009 2014
Cumulativechangesince1999
Health insurance premiums Workers' contriubtion to premiums
Workers' earnings Overall inflation
Also a result of these trends, the percentage of nonelderly Americans with health insurance through
an employer also fell from 69.2% in 2000 to only 58.0% by 2013, according to our analysis of the
U.S. Census Bureau’s Current Population Survey (exhibit 7), although the rate of decline has slowed
somewhat in recent years.
Exhibit 7
Consumer-Driven Healthcare
Source: William Blair & Company, L.L.C. analysis of the Bureau of Labor Statistics’ 2013 Annual Social and
Economic (ASEC) Supplement to the Current Population Survey (CPS)
Proportion of Nonelderly Americans with Employer-Sponsored Insurance Is
Declining
69.2%
63.4%
58.0%
75.0%
69.6%
65.8%
50.0%
55.0%
60.0%
65.0%
70.0%
75.0%
80.0%
Employer-sponsored All private insurance
Correcting this long-term decline in employer-sponsored health insurance (and private insurance
more broadly) was one of the chief aims of the ACA, by requiring large employers to offer health
insurance and offering subsidized health insurance to those unable to afford offerings in the exist-
ing individual market.
12 Ryan S. Daniels, CFA +1 312 364 8418
William Blair & Company, L.L.C.
While this may address some of the coverage issue, it does little to remedy the exorbitant costs that
are, in our view, the primary driver of declining coverage to begin with. We believe it could even
accelerate cost trends in future years, as the provision of health insurance has never proved to be a
panacea for cost growth in the past; rather, it has driven higher utilization and costs and will likely
do so again in the future.
Lastly, recent data from across the United States shows that, despite an improving economic envi-
ronment and lower healthcare costs trends of late, a greater percentage of adults in each state are
going without care as a result of increasing costs (see below).
Source: The Commonwealth Fund
Exhibit 8
Consumer-Driven Healthcare
More Forgoing Care Due to Cost
Similarly, a December 2014 survey of more than 15,000 seniors (over age 65) from The Com-
monwealth Fund showed that healthcare is still unaffordable for many individuals. More speci ic,
19% of older Americans struggled to pay for healthcare, indicating that cost was the main reason
preventing them from seeing a physician or illing a prescription. Only one other nation around
the globe recorded a similar double-digit response rate to this question (New Zealand, at 10%).
Among U.S. seniors, the report also highlighted that 21% had out-of-pocket expenses of more than
$2,000 and 11% had dif iculty paying medical bills; in other developed countries (e.g., Germany),
the percentage indicating trouble paying for medical bills was only 3%.
The ability for American seniors to get next-day or same-day appointments when ill fell near the
bottom of all countries, yet their use of emergency rooms was near the top of the list (39% use in
the last two years) and access to specialists was quite high. In a more consumer-centric market, we
would hope to see all of these trends begin to reverse.
So what is driving these still-exorbitant healthcare cost trends? While there are myriad an-
swers to this question, if we had one word to describe our key concern it would be “incentives.”
More speci ic, we believe one actual ef iciency in the healthcare marketplace is that all participants
respond to the incentives given to them.
13Ryan S. Daniels, CFA +1 312 364 8418
William Blair & Company, L.L.C.
In the past, this meant providers’ general underinvestment in understanding consumer prefer-
ences and managing patient well-being, as these investment areas were somewhat counter to the
fee-for-service reimbursement environment that paid the bills. And for consumers, what incentive
was there to shop around (or even so much as ask questions about price) with a low-deductible
health plans that sheltered individuals against the true cost of care?
To this end, we found a 2014 Commonwealth Fund report card on quality improvements across the
United States somewhat instructive. More speci ic, the report card indicated that outcomes have
improved in a number of key areas over the last several years, including: readmission rates, patient-
center care delivery, care coordination, and hospital-acquired infections. However, there was little to
negative progress made on overall health conditions, such as 30-day mortality rates, access to care,
and obesity. Coincidentally, the areas that showed improvement also were tied to novel incentives
in the healthcare market, e.g., not paying for excess readmissions, and no payment for hospital-
acquired infections. Still, in some regards, this may actually be a positive, as it shows that care and
outcomes can and will be improved as provider and patient incentives change in the near future.
FactorTwo:IncreasedAvailabilityofHealthcarePriceandQuality
Information
To control escalating costs with more consumer-centric healthcare, we believe that increased access
to healthcare pricing and quality information also is needed. Without this, patients are generally
unable to take a more proactive role in assessing treatment options, determining the quality of
physicians, and choosing appropriate healthcare service providers and points of care—key factors
in a more consumer-centric market, in our opinion.
While we believe that progress continues on multiple fronts, a 2014 survey funded by the Robert
Wood Johnson Foundation and conducted by the Associated Press-NORC Center for Public Affairs
Research shows that gaps remain between the needs of an empowered healthcare consumer and
the information currently available.
More speci ic, about 48% of respondents thought it was “very easy” or “moderately easy” to ind
information that compared the quality of healthcare providers, which outnumbers the roughly 25%
who thought it was moderately or very dif icult to ind information. However, when asked about the
ease of inding cost information, only 32% felt it easy to ind, while 38% said it was dif icult to ind.
Even more troubling, only 26% reported that it is easy to ind a reliable source that compares both
cost and quality data on healthcare providers side-by-side. Studies have shown that many consum-
ers naturally associate higher-cost healthcare with higher-quality healthcare. Thus, being presented
cost data without the accompanying quality ratings may actually lead some consumers to gravitate
toward providers who charge higher prices without delivering a better outcome, in our view.
14 Ryan S. Daniels, CFA +1 312 364 8418
William Blair & Company, L.L.C.
Sources: Associated Press-NORC Center for Public Affairs Research and Robert Wood Johnson Foundation
Exhibit 9
Consumer-Driven Healthcare
Only 48% Say it Is Easy to Find and Compare Quality Information on Healthcare
Providers
Very/moderately
easy, 48%
Neither easy nor
difficult, 22%
Very/moderately
difficult, 25%
Don't know, 5%
Sources: Associated Press-NORC Center for Public Affairs Research and Robert Wood Johnson Foundation
Exhibit 10
Consumer-Driven Healthcare
Few Find it Easy to Compare Both Cost and Quality Information Together
Very/moderately
easy, 26%
Neither easy nor
difficult, 22%
Very/moderately
difficult, 44%
Don't
know,
8%
In the section that follows, we provide an overview of some of the recent developments on the cost
and quality transparency front, while also highlighting a number of remaining hurdles.
More Providers Are Disclosing Charges
Hospitals and other providers are increasingly moving toward more disclosure of cost and quality
data. In part, this is due to legislation enacted by state and federal governments.
For example, the Affordable Care Act called on hospitals to publicly report a list of standard charges
for services rendered, and in August 2014, the Centers for Medicare and Medicaid Services (CMS)
issued a regulation regarding data disclosure within the iscal 2015 Inpatient Prospective Pay-
ment Systems (IPPS) inal rule. Although hospitals are now required to release a charge list to the
15Ryan S. Daniels, CFA +1 312 364 8418
William Blair & Company, L.L.C.
public, the CMS granted considerable leeway in determining how these prices are communicated.
For example, both an Internet posting of the master charge list and furnishing a list of prices upon
request will satisfy the transparency requirement.
In addition, in 2013 the CMS began publishing average charges by hospital and the average Medicare
reimbursement rate for the 100 most common inpatient and 30 most common outpatient proce-
dures. This was augmented by the release of data on Medicare payments to physicians in April 2014.
Other federal initiatives, however, such as the Health Care Price Transparency Promotion Act and
the Medicare Data Access and Transparency Act, have stalled in Congress.
States have also enacted myriad legislation to promote price and quality transparency, but the level
and quality of the data varies signi icantly by state. As it stands, there are 35 states that require
hospitals to disclose some charges to the public, and a number of states are debating expanded
access to this information or (for those with no disclosure) publishing such data for the irst time.
Unfortunately, incremental price transparency by providers can only go so far, in our view. First,
disclosing a charge itself is of limited utility to those with private insurance, as payers typically have
a contractually negotiated rate at a discount to the published charge; importantly, for competitive
reasons, providers are contractually forbidden from disclosing these rates.
Second, any episode of care will usually involve multiple charges from different provider groups. For
instance, if a patient wished to calculate the out-of-pocket costs for an upcoming hip replacement
using only data from providers, this would require aggregatingcharge information from radiologists,
anesthesiologists, the facility, and the surgeon (who may all work for different organizations), and
then factoring in considerations like the amount remaining on his or her deductible and the size of
copayments or coinsurance. Moreover, considering that a 2013 survey by Carnegie Mellon showed
that only 11% of respondents were able to correctly calculate the cost of a four-day hospital stay
when presented all relevant information (including cost per day, deductible, copay, co-insurance,
out-of-pocket maximum), provider disclosure by itself, although de initely important, may not be
enough to enable a consumer-driven revolution in healthcare.
To increase price and quality transparency for entire episodes of care, we believe it is necessary to
increase collaboration among all industry stakeholders. To this end, health plans increasingly are
offering in-house or third-party tools to help members calculate projected out-of-pocket expenses,
sometimes using real-time information. According to a survey by HealthSparq, slightly less than
half (48%) of the largest health plans offer members some form of out-of-pocket cost estimator. We
expect this penetration to increase in the future, in response to demand for such tools from both
enrolled members and large group customers. Unfortunately, few of the tools available today allow
consumers to quickly compare out-of-pocket costs across a wide set of providers.
16 Ryan S. Daniels, CFA +1 312 364 8418
William Blair & Company, L.L.C.
Source: HealthSparq
Exhibit 11
Consumer-Driven Healthcare
Percentage of Insurers Offering an Out-of-Pocket Cost Estimator to Members
30%
55%
48%
0% 10% 20% 30% 40% 50% 60%
Less than 250,000 members
Between 250,000 and 1 million
members
More than 1 million members
All Payers Claims Databases
Another encouraging trend has been the development of all-payer claims databases (APCDs) in
several states. APCDs are a statewide repository of information, to which all payers within a state
contribute claims information. In our view, APCDs have a few speci ic advantages over other
transparency-related initiatives. First, they allow consumers of healthcare to compare the amounts
actually paid (i.e., the negotiated rate) across a broad set of payers, locations, and procedures. In
addition, because data is collected directly from payers, consumers could gain insight into the cost
of care for a complete episode (facility costs, diagnostics, professional fees, etc.).
At present, there are 11 states that have mandated the contribution of data to APCDs, while three
other states have voluntary programs. As shown in exhibit 12, however, ive additional states are
now implementing APCDs and 21 have expressed a strong interest. At present, only 10 states do
not have any form of ACPD in operation or under consideration.
Source: APCD Council
Exhibit 12
Consumer-Driven Healthcare
Status of APCD Initiatives by State
17Ryan S. Daniels, CFA +1 312 364 8418
William Blair & Company, L.L.C.
In our view, one large challenge to the development of these databases will be the incremental
administrative costs for large health plans that operate in multiple states. Another challenge will
be developing a user-friendly portal to access the information. For example, of the 11 states that
currently aggregate data into APCDs, only a few states (Massachusetts, Maine, and Colorado) have
developed a consumer-friendly website allowing consumers to easily access and interpret the col-
lected cost and quality data.
Of note, in the Catalyst for Payment Reform’s Report Card on State Price Transparency Laws, Massa-
chusetts was one of only two states not to receive a failing mark for the state-mandated website. The
Massachusetts APCD has collected data (medical claims, eligibility, dental, pharmacy, product and
provider iles) since 2008 from 100 commercial sources of claims. The consumer-facing component,
MyHealthCareOptions (hcqcc.hcf.state.ma.us), aggregates this data into a relatively user-friendly
format. As shown in exhibit 13, a prospective patient is able to search by location, provider name,
and condition or procedure.
Source: Commonwealth of Massachusetts Health Care Quality and Cost Council, MyHealthCareOptions
Exhibit 13
Consumer-Driven Healthcare
User-Friendly Way to Utilize APCDs
18 Ryan S. Daniels, CFA +1 312 364 8418
William Blair & Company, L.L.C.
Below, for example, we compare the cost and quality ratings of four Boston-area hospitals for a hip
replacement procedure.
Source: Commonwealth of Massachusetts Health Care Quality and Cost Council, MyHealthCareOptions
Exhibit 14
Consumer-Driven Healthcare
Side-by-Side Quality and Cost Comparison
19Ryan S. Daniels, CFA +1 312 364 8418
William Blair & Company, L.L.C.
Source: Commonwealth of Massachusetts Health Care Quality and Cost Council, MyHealthCareOptions
Exhibit 15
Consumer-Driven Healthcare
Detailed Cost and Quality Metrics
Wisconsin Hospital Association
An example of a provider-led initiative to promote greater transparency and allow consumers
to compare cost and quality metrics between hospitals for different procedures is the Wisconsin
Hospital Association’s PricePoint website (www.wipricepoint.org). In the example below, we com-
pared the cost of a delivery at three Green Bay area hospitals. There also are links to a companion
website, CheckPoint (www.wicheckpoint.org), which allow future patients to compare measures
of outcomes, patient satisfaction, and treatment quality. Again, we view developments such as the
Wisconsin website as favorable, and believe the growth in HDHPs will soon force more hospitals to
contribute such data going forward.
20 Ryan S. Daniels, CFA +1 312 364 8418
William Blair & Company, L.L.C.
Source: Wisconsin PricePoint
Exhibit 16
Consumer-Driven Healthcare
Wisconsin PricePoint Allows Comparison of Median Charge for Care with Links
to Quality Metrics
Health Care Cost Institute Tool
A potentially interesting development during 2015 will be the launch of a free online tool by the
Health Care Cost Institute (HCCI), in collaboration with some of the largest insurers in the United
States: Aetna, Humana, and UnitedHealthcare. Although little is known at this point, the partners
aim to provide consumers with additional information on the price and quality of various healthcare
services. Furthermore, cost data will be based on paid claims across the multiple plans. Eventually,
the HCCI believes that other commercial health plans, as well as Medicare Advantage and Medicaid
plans, will join the initiative.
This collaboration could have several advantages over existing price and quality comparisons. First,
basing a cost estimate on paid claims versus a provider charge list is, by nature, more accurate. In
addition, almost all tools currently offered by health plans are available only to members and not
to the broader public. If the tool is also able to incorporate information regarding a plan member’s
deductible and other out-of-pocket responsibilities, we believe it could represent a powerful step
forward for price and quality transparency. Therefore, we will closely monitor the rollout from the
HCCI over the coming quarters.
Transparency Scorecard
The Catalyst for Payment Reform (CPR) recently released a scorecard, rating existing state laws and
regulations regarding price and quality transparency. Although we believe that progress has been
made on increasing transparency, as evidenced by the examples above, the CPR report highlights
that signi icant room for improvement remains.
Higher grades were awarded for states with legislation requiring the release of charge and payment
data for common outpatient and inpatient services to the general public in an easy to access and
understand format. In 2014, no states received an “A” rating, two received a “B,” three a “C,” and the
remainder an “F.” Again, we are hopeful that legislative pressures can accelerate this transparency
trend; however, we believe market dynamics are more likely to push this transparency forward at
21Ryan S. Daniels, CFA +1 312 364 8418
William Blair & Company, L.L.C.
an even more rapid pace, as employers and consumers with more inancial responsibility begin to
demand such offerings (and as creative technology vendors begin to aggregate more of this data to
offer a consumer-centric healthcare comparison solution in the future).
Source: Catalyst for Payment Reform
Exhibit 17
Consumer-Driven Healthcare
All but Five States Receive “F” for Price and Transparency Lawsy
GAO Report on Healthcare Cost, Quality Data
TheU.S.GovernmentAccountabilityOf ice(GAO)recentlyissuedareport(HealthCareTransparency:
Actions Needed to Improve Cost and Quality Information for Consumers) that recommended further
improvements to the CMS’s healthcare compare databases for nursing homes, dialysis facilities,
home healthcare organizations, hospitals, and physicians. More speci ic, the GAO recommended that
the CMS improve the information in its transparency tools to include items such as out-of-pocket
cost estimates for treatments that can be planned in advance. We continue to believe the push from
government regulatory agencies to improve cost and quality transparency in Medicare will continue
to drive greater access to useful information for all consumers across the United States.
The Bottom Line
We believe that transparency initiatives remain at the forefront in healthcare, driven by many trends
discussed in this report: an increasingly unbearable cost of healthcare, higher out-of-pocket con-
sumer exposure, and the support of HCIT vendors. Moreover, key industry stakeholders continue
to leverage their unique sets of data to develop innovative ways to empower patients with more
information, which we believe is needed to drive the consumer revolution in healthcare. In particu-
lar, as the broader industry moves away from fee-for-service pricing toward novel reimbursement
methods, we believe that industry agents will increasingly collaborate in new ways that support
healthcare purchasing decisions by consumers.
In addition, demand is increasing for improved price transparency among large employers. A survey
conducted by Deloitte, for example, found that among employers of all sizes, price transparency
was rated among the top three ways to improve U.S. healthcare system performance. Again, we be-
lieve these market demands will soon push greater transparency to the forefront of the healthcare
experience in the United States.
22 Ryan S. Daniels, CFA +1 312 364 8418
William Blair & Company, L.L.C.
FactorThree:GreaterUseofHCITWillEnabletheCDHCRevolution
As discussed above, a prerequisite to more consumer-centric healthcare is providing individuals
with more information on the quality and cost of healthcare. Moreover, it is critical to support these
consumers with better care coordination and population health management—initiatives that
should drive not only better outcomes but also lower costs.
In years past, this was a challenging endeavor because of the lack of ef icient, accurate, and com-
prehensive clinical data collection in an electronic format. In turn, sharing this information among
caregivers, providers, and patients was nearly impossible. However, as a result of signi icantly in-
creased government funding, as well as certain aspects of recent healthcare reform, this is rapidly
changing. For example, the cumulative percentage of U.S. physicians attesting to the irst stage of
meaningful use of a certi ied electronic health record (EHR) has risen from 6% at the end of 2011
to 52% as of October 2014. The story is even more promising in the inpatient setting, where the
cumulative percentage of U.S. hospitals attesting to the irst stage of meaningful use has risen from
17% at the end of 2011 to 89% as of the end of October 2014.
In our view, this is critically important, as we believe that EHRs are the basic infrastructure that
will eventually allow sizable returns from increased data analytics, clinician behavior change, and
stronger patient engagement. However, the transition from installing an EHR to realizing the above-
mentioned returns will not be a linear path without challenges.
In 2014, the regulatory page turned to require providers that had attested to stage 1 in 2011 or
2012 to graduate to stage 2 of the meaningful use program, which requires stricter compliance with
clinician behavior change and patient engagement goals—two keys to a more consumer-centric
marketplace. So far in 2014, only 8% of the physicians and 64% of the hospitals required to attest to
stage 2 have met the heightened burden (exhibit 18), and more than 75% of those stage 2 attesta-
tions occurred in the last two months after the CMS extended the attestation deadlines past federal
iscal year-end, indicating a struggle to meet the heightened requirements.
Source: Centers for Medicare and Medicaid Services
Exhibit 18
Consumer-Driven Healthcare
Percentage of Eligible Providers and Hospitals Attesting to Meaningful Use of EHRs
6%
26%
42%
52%
8%
17%
54%
84%
89%
64%
0%
10%
20%
30%
40%
50%
60%
70%
80%
90%
100%
2011 2012 2013 YTD 2014
Eligible Providers (Stage 1) Eligible Providers (Stage 2)
Hospitals (Stage 1) Hospitals (Stage 2)
While EHR adoption is at various stages depending on provider size and specialty, numerous health-
care stakeholders have started to enable consumer-oriented bene its by digitizing the healthcare
process. For example, on an individual basis, both payers (including the CMS) and providers are
23Ryan S. Daniels, CFA +1 312 364 8418
William Blair & Company, L.L.C.
increasing patient access to their own health records. Moving forward, we believe there also will
be a greater push not only for patient access to digital health information, but also to make the data
portable for patients (i.e., not simply siloed with an individual provider) and exchangeable across
the care continuum.
On a larger scale, providers also are beginning to analyze terabytes of de-identi ied patient data (big
data)toidentifybetterwaystomanagethehealthofpatients orbene iciaries(orentirepopulations).
Over the longer term, collecting and sharing data and outcomes should help engage consumers in
their own health and, in turn, reduce overall health costs.
While skeptics view “population health management” as a buzzword used to sell more software
products and services in a post-meaningful-use environment, we believe fee-for-value reimburse-
ment arrangements have gained signi icant momentum and will fuel the need for stronger analytical
solutions, such as the proliferation of readmission preventions tools discussed below, to provide
higher-quality care at lower costs.
Moreover, even beyond the four walls of the hospital or ambulatory clinic, providers are showing
a greater proclivity to adopt technology. For example, the Epocrates 2014 Mobile Trends Report
indicated that 100% of healthcare providers use computers and 80% use smartphones profession-
ally. Further, the report indicated that 74% of surveyed healthcare providers expect to be “digital
omnivores”—those who use a tablet, smartphone, and laptop/desktop computer routinely in a pro-
fessional capacity—in 2015. Of note, that expectation is a stark reversal from the trend observed in
2014, where digital omnivores decreased from 47% of respondents in 2013 to 41% in 2014, while
the number of hours spent accessing patient information at a computer increased (exhibit 19).
Source: Epocrates 2014 Mobile Trends Report
Exhibit 19
Consumer-Driven Healthcare
More Providers Expect to Be “Digital Omnivores” in 2015
28%
47%
41%
74%
20%
30%
40%
50%
60%
70%
80%
2012 2013 2014 2015E
In 2014, we believe that either a lack of full functionality on mobile devices or new regulatory
requirements altering work lows caused providers to refocus on non-mobile devices. Yet, provid-
ers remain optimistic that mobile device usage—and its inherent non-stop connection to relevant
healthcare data—will reverse course and become the status quo in the near future. Moreover, just
like with providers’ meaningful use stage 2 attestation struggles, we view the slowdown in mobile
device usage as merely a speed bump, as providers bridge the gap between simple adoption of
HCIT and effective use of technology. In combination with greater consumer access to their own
24 Ryan S. Daniels, CFA +1 312 364 8418
William Blair & Company, L.L.C.
digital health information, mandated in part by the meaningful-use program and in part by market
demands, healthcare is progressing toward a technological revolution that is nearly complete in
every other sector.
The section that follows begins with a brief recap of why we believe greater adoption of HCIT and
effective use of HCIT will occur over the next several years. We then discuss why this adoption is
critical to a more consumer-centric healthcare marketplace.
Why HCIT Adoption Will Achieve Higher Levels of Sophistication
The HITECH Act has driven greater EHR adoption. Before the enactment of the HITECH Act in
February 2009, EHR adoption, while occurring at a decent pace, was hindered by two factors: 1) the
perception that the cost of adoption was high, especially considering an initial negative productivity
impact on physicians, and 2) the reality that there are asymmetries between the stakeholders who
bear the cost of adoption (providers) and those who reap many of the bene its (payers and patients).
Fortunately,theHITECHActhelpedjump-startclinicalHCITadoptionthroughtwodistinctinitiatives:
1) more than $30 billion in adoption incentives for providers that purchase and use, in a meaningful
way, certi ied EHRs, and 2) eventual penalties for those providers that do not adopt and use robust
systems. Below, we brie ly discuss each of these aspects.
Funding incentives: In terms of incentive funds, physicians are eligible for up to $44,000 in aggregate
Medicare payments, or $63,500 in aggregate incentives from Medicaid. Hospitals are also eligible for
Medicare and Medicaid funding, with the level of combined payment dependent on the number of
discharges a hospital has, its Medicare/Medicaid patient mix, and its level of charity care. According
to PricewaterhouseCoopers, a 500-bed hospital may receive as much as $6.1 million in Medicare in-
centives; we believe a similar amount could be earned from Medicaid simultaneously (assuming an
equivalentMedicaidpatientvolume).Ofnote,theCMSrecentlyreportedthatroughly$25.8billion
in Medicare and Medicaid incentive funds have already been paid out by the end of October
2014 (up 54% from the $16.7 billion reported at the end of October 2013).
Source: Centers for Medicare and Medicaid Services
Exhibit 20
Consumer-Driven Healthcare
CMS Meaningful-Use Incentive Payments (Cumulative, in Billions of Dollars)
$7.4
$16.7
$25.8
$0.0
$5.0
$10.0
$15.0
$20.0
$25.0
$30.0
Sep-12 Oct-13 Oct-14
25Ryan S. Daniels, CFA +1 312 364 8418
William Blair & Company, L.L.C.
Penalties: Physicians who did not adopt EHRs by the end of 2014 are subject to a 1% reduction in
Medicare reimbursement in 2015, which increases to as much as 5% by 2019. Similarly, hospitals
that did not adopt EHRs by iscal 2014 are subject to a payment reduction based on their Medicare
basket update in 2015. While these penalties initially seemed distant and ancillary to the in-
centive payments driving purchasing decisions, we believe they are now altering provider
behavior as the penalty dates are upon providers.
The incentive payments will be made over a number of years as physicians and hospitals achieve
each of three levels of adoption set forth by the CMS under its “meaningful use” regulations. The
stages build on each other, with stage 1 focused on data capturing and sharing, stage 2 concentrating
on more-advanced clinical process and patient communications, and stage 3 centered on improving
outcomes. Physicians and hospitals that started the meaningful-use program in 2011 or 2012 were
required to meet the stage 2 requirements in 2014, so some patients should have already begun
to see the bene its of improved patient communications (e.g., patient portals and electronic com-
munication) and data exchange, although fairly broad hardship exceptions were made available by
the CMS that allowed many providers and hospitals to put off stage 2 for another year.
Stage 2 demands stricter compliance with stage 1 requirements, including increased patient com-
munication (e.g., more than 5% of patients must send secure messages to their physician and more
than 5% of patients must access health information online) and electronic information exchange
(e.g., care summaries must be transmitted electronically for more than 10% of transitions of care
or referrals).
Looking ahead to stage 3, recommendations focus on supporting new models of care that are team-
based and support population health management through better clinical decision support (CDS)
systems, care coordination, and transitions of care. For example, an EHR will not just place lab orders
but also track when results come back. Further, for 10% of patients referred, referral results must
be returned to the requestor within three business days. Lastly, patients must receive a summary
of care when transferred to another care setting, including home, and, in some cases, noti ications
must be sent to key members of the patient’s care team. Overall, we view the stage 2 and pending
stage 3 regulations as key enablers of a more consumer-centric healthcare marketplace.
Changes in the healthcare delivery system also will promote greater HCIT adoption and in-
novation. In addition to the HITECH Act, the healthcare reform legislation also should promote
greater HCIT adoption. As part of the reform legislation, there have been myriad reimbursement
changes that move to more value-based payments, all of which reimburse providers more for the
care delivered and outcomes achieved rather than the mere volume of services rendered.
More speci ic, the ACA drove three new payment/reimbursement strategies for Medicare, each of
which is designed to reduce costs and improve health outcomes. Two of the strategies, pay-for-per-
formance (providers are paid bonuses if they achieve certain inancial and/or clinical benchmarks)
and bundled or episodic payments (provider networks are paid a lump sum for all care provided
across multiple care settings for a single episode of care—e.g., a hip replacement), felt like precur-
sors to the third strategy, accountable care organizations (ACOs). In turn, we believe many payers
and providers have been regularly skipping ahead directly to this strategy.
In our view, ACOs drive a more comprehensive approach to value-based reimbursement. They
enable a shared-savings model between Medicare and integrated provider networks in a tiered
fashion, ranging from modest pay-for-performance bene its (no inancial risk for providers) to
capitation-like per-member per-month (PMPM) payments (more inancial risk for providers but
potentially higher rewards).
26 Ryan S. Daniels, CFA +1 312 364 8418
William Blair & Company, L.L.C.
The ACO program, with its potential to enable a sustainable business model (as opposed to a discrete
pilotprogram),hasdrawnthestrongestinterestfromproviders.ACOparticipationlevelsarerelatively
steady, although the CMS has commented that it has seen strong interest from new organizations
looking to join in 2015, while inancial and quality performance of participants has improved. More
speci ic,theCMShassigneduproughly400organizationstoparticipateinitsthreeACOprograms:35
in the advance payment model ( lat year-over-year), 337 in the shared-savings program (roughly
latyear-over-yearbutupfrom106attheendof2012),and19inthepioneerACOprogram(down
from 23 last year, as some transitioned into the more risk-averse shared-savings program). In iscal
2014, the shared-savings program and the pioneer ACO program generated $417 million in savings
for Medicare, while organizations quali ied for $460 million in bonus payments.
In addition, the CMS shifts toward a more value-based reimbursement model have been adopted (in
one form or another) by private insurers and health systems at a dizzying pace. The prime example
of this shift comes from insurance giant UnitedHealth Group, which in 2012 stated a goal of reaching
$50 billion in value-based arrangements with physicians by 2017, and a year later, it increased the
goal to reach $65 billion in value-based partnerships with care providers by 2018. The company is
on track toward the goal, with $36 billion in value-based arrangements in 2014 (up 38% year-over-
year), or 31% of estimated premium revenue in 2014, and a projection of $43 billion in value-based
arrangements in 2015 (exhibit 21).
Sources: United HealthGroup and FactSet
Exhibit 21
Consumer-Driven Healthcare
Large Insurers Like United Healthcare Are Adopting Value-Base Reimbursement
$ 26
$ 36
$ 43
24%
31%
35%
$ -
$ 5
$ 10
$ 15
$ 20
$ 25
$ 30
$ 35
$ 40
$ 45
$ 50
0%
10%
20%
30%
40%
50%
60%
2013 2014E 2015E
UNH revenue from value-based arrangements ($ in billions)
UNH value-based arrangements, as a percentage of total premium revenue
Not only is momentum building for ACOs or other shared-savings models, some early returns
showthatthesemodelsarereducinghealthcarecostswhileimprovingormaintainingquality
of care. Perhaps the most high-pro ile example of such an agreement between a private insurer and
healthcare providers is the Massachusetts Blue Cross Blue Shield Alternative Quality Contract. This
model is noteworthy for two reasons: irst, all the players are in Massachusetts, where a smaller-
scale version of the ACA is already in place; second, seven healthcare provider organizations have
participated since 2009, meaning there is historical data to analyze. Of note, a study published in
the New England Journal of Medicine by Harvard Medical School researchers demonstrated 6.8%
cost savings against a benchmark in the fourth year of participation, with most savings generated
by reduced prices and lower utilization in outpatient procedures, imaging, and tests, while quality
of patient care exceeded the benchmark.
27Ryan S. Daniels, CFA +1 312 364 8418
William Blair & Company, L.L.C.
We also believe changes to reimbursement models are beginning to affect provider behavior
as it relates to HCIT investments. For example, the CMS published data on readmission rates indi-
cating that 30-day hospital readmission rates among Medicare fee-for-service bene iciaries fell by
more than 100 basis points from 2011 to 2013. This change has resulted in an estimated 150,000
fewer hospital readmissions between January 2012 and December 2013—a clear example of how
outcomes and cost trends can improve when provider incentives change.
Source: The Centers for Medicare and Medicaid Services
Exhibit 22
Consumer-Driven Healthcare
Readmission Rates Are Falling
30-Day,All-ConditionMedicareReadmission
19.0% 19.0%
19.2% 19.1%
19.0%
18.5%
17.5%
17.0%
17.5%
18.0%
18.5%
19.0%
19.5%
20.0%
2007 2008 2009 2010 2011 2012 2013
In another high-pro ile example, Advocate Physician Partners and Advocate Health in Illinois have
seen costs reduced in one of the largest shared-savings model in the United States. Advocate cur-
rently has 553,000 lives (both Medicare and commercial bene iciaries), or 55% of projected 2014
revenue, in value-based agreements. The organization has already seen some bene its from its
technological advancements and care-coordination efforts, with total costs for commercial shared-
savings contracts down 1.7% in second quarter 2013 (most recently available data), while costs
stayed lat over the irst 12 months of its participation in the Medicare shared-savings program.
Advocate is achieving these positive results despite being in only the early stages of a major tech-
nology project to increase the sophistication of its population health management endeavors. More
speci ic, Advocate is working to enhance Cerner’s Healthe Intent electronic data warehousing plat-
form, predictive modeling, and clinician-facing tools that use comprehensive data and more discrete,
disease-focusedalgorithms.AdvocateandCernerhavecliniciansworkingside-by-sidewithprogram-
mers on predictive models, the irst two of which are completed and focus on potential readmissions
and incidents of patients falling. Cerner’s readmission algorithm has performed 20% better than
industry average and is now deployed at over 120 non-Advocate sites, giving those facilities a clear
edge in reducing readmissions, lowering costs, and, in turn, producing shared-savings bonuses.
Data warehousing, analytics, and predictive modeling such as those taken on by the Cerner/Advocate
partnershiparetopprioritiesforprovidersoperatinganACOorotherpopulation-health-management–
focused strategy. In addition, we believe any comprehensive value-based approach will require HCIT
systems that at least to some degree: 1) combine inancial and clinical data, which requires more ro-
bust systems than most in the marketplace can currently handle, and 2) improve exchange of clinical
informationandcoordinationofcarebetweenproviders,bothofwhicharealsodif iculttoaccomplish
with paper-based medical records.
28 Ryan S. Daniels, CFA +1 312 364 8418
William Blair & Company, L.L.C.
We have also observed some meaningful steps taken toward both of these endeavors in the past year.
Regarding tighter linkage between inancial and clinical information, we have observed continued
progress from Utah-based Intermountain Healthcare integrating activity-based costing into clinical
documentation with Cerner. As a not-for-pro it, integrated system with its own insurance offerings
and very solid inancial footing (e.g., increasing organic revenue and operating income, and top bond
ratings), Intermountain serves as a goal state for many healthcare organizations, but still strives for
an improved inancial outlook to support research and development and provide a greater bene it
to the communities it serves (e.g., it hopes to minimize rate increases to CPI plus 1% for insurance
offerings by 2016). However, even though the system achieves top quality scores in most key areas,
it still sees large local variation for many common outpatient procedures—and the organization
views variation as “the enemy of cost and care.” Toward this end, Intermountain is working with
Cerner to develop a “cost master” rather than a charge master. Management engineers are work-
ing to identify best practices and translate the organization’s 5,000 clinical terms and 25,000 total
items in the cost master into an identi iable cost per procedure. Further, much of the Cerner and
Intermountain development is using open and interoperable APIs, which should allow a quicker
translation of the intellectual property into non-Cerner and non-Intermountain environments. This
effort acknowledges that applications deliver more value when they can be inserted into a large
number of work lows, which is more easily achieved on an open, rather than proprietary, platform.
Put simply, to bear more risk for outcomes and costs, we believe a robust set of HCIT applications is a
prerequisite and value is more easily unlocked when these applications can interact on open platforms.
In turn, we see greater adoption of these reimbursement approaches as another key catalyst for
HCIT adoption (and thus more consumer-centric care delivery) over the next few years.
Why Increased HCIT Adoption Will Help Spur Consumer-Driven Healthcare
Once these systems are in place, we anticipate a number of positive bene its that will help drive
consumer-driven healthcare (CDHC) initiatives, including the following.
Improvement in collecting and reporting clinical outcomes. A key tenet of CDHC is better tracking
and reporting of provider quality and cost levels, patient outcomes, and other associated informa-
tion, so that consumers can make more-informed healthcare decisions.
Given the limited penetration of robust EHRs in the past, this was challenging to provide and there
is still a greater need for transparency in the marketplace, as discussed in the prior section. As HCIT
adoption ramps up, however, collecting, reporting, and analyzing quality and cost data will be sig-
ni icantly easier (and more robust than relying on claims data alone), which in turn can be shared
with consumers comparing treatment options and the quality of healthcare providers.
For example, the latest data published by the CMS on the Physician Quality Reporting System (PQRS)
from 2012 indicates that only 36% of eligible physicians reported the quality measures necessary
to earn payment incentives, although the 2012 results represented a 36% increase from 2011 par-
ticipation. We believe these positive trends have continued the last two years, particularly ahead
of payment penalties that will be applied to non-participants in 2015.
Again, stage 2 of the meaningful-use program is pushing providers in the right direction of increased
collection and reporting of clinical outcomes. For example, stage 2 requires that providers use
structured data in lab results 55% of the time. Lab reports feeding data into the provider’s EHR,
rather than received by fax or PDF, will reduce labor costs and allow for better data sharing and
analysis, in our view.
29Ryan S. Daniels, CFA +1 312 364 8418
William Blair & Company, L.L.C.
Sharing of data between providers also should enhance the consumer experience. Another key
issue contributing to the country’s healthcare cost escalation and poor care coordination is the lack
of data sharing among providers. Today, it is more common to see records relayed between provid-
ers via fax or by the patient carrying documents to an appointment than it is to see full electronic
transmission of records.
Similarly, there is rampant waste in the system, as providers that are unable to access prior tests
(like MRIs or lab work) have incentives—at least today—to simply order a new one (often getting
paid for the additional tests). This not only drives unnecessary costs, but also adds inconvenience to
patients (e.g., obtaining another MRI) and reduces the quality of care delivered (e.g., more radiation
exposure and potential delays in obtaining necessary care).
Given the previously discussed reimbursement and delivery system changes, we believe that health-
care providers will soon have greater incentives to improve care coordination, foster more exchange
of health information, and lower the use of unnecessary, duplicate testing. By nature, this should
foster a more consumer-centric care delivery process.
In recent years, the biggest shift in the HIE landscape has come from HCIT vendors. While
this push is aligned with many vendors’ mission to improve healthcare, from a practical perspec-
tive, we believe the technology vendor community recognizes that unlocking the long-term value
(i.e., more than earning meaningful-use payments) of their systems is only possible in a more open,
interoperable HCIT environment.
Morespeci ic,theannouncementoftheCommonWellAllianceattheHIMSS2013conferencemarked
a key step toward a more widely adopted method of exchanging key clinical information between
disparate (and often competing) providers. While the organization’s goals remain modest, it rep-
resents a commitment to (at least) a minimal amount of interoperability between rival vendors,
and it should help establish an improved framework for secure liberation of clinical data bene iting
patients. The alliance has already made some progress, moving from regional pilots to nationwide
availability of limited cross-vendor interoperability (identity management, record locator, consent
management, and trusted data access) between athenahealth, Cerner, CPSI, Greenway Health, and
McKesson clients.
More recently, several vendors including athenahealth, Cerner, Epic Systems, Meditech, McKesson,
and The Advisory Board Company, along with several providers including Intermountain Health-
care and the Mayo Clinic, joined forces on the “Argonaut Project,” which aims to accelerate adoption
of the Fast Healthcare Interoperability Resources (FHIR), a standards framework and API, based
on modern Internet-based conventions. One of the group’s goals is to play a role in the stage 3
meaningful-use regulations.
In sum, while technological, operational, and inancial pitfalls remain, we see strong momen-
tum for data liquidity, as more volume and more breadth of health information are exchanged
among a more diverse group of stakeholders, including providers, patients, payers, and
employers. Further, we believe the aforementioned stakeholders view robust health information
exchange (and the ef iciencies, care coordination, and analytics that come with it) as one of the key
bene its of the infrastructure created by widespread adoption of EHRs.
HCIT can engage patients more actively in their own care management. As we have highlighted
in past reports, there is perhaps no more ef icient labor force than consumers themselves. Today,
for example, ATMs, automated check-ins for airlines, and online ticket ordering systems all afford
consumers quicker and more-convenient solutions at lower costs.
30 Ryan S. Daniels, CFA +1 312 364 8418
William Blair & Company, L.L.C.
In our view, there are many aspects of healthcare where this can also be put into place, such as
check-in kiosks at hospitals and physician of ices (which are helpful for both revenue cycle manage-
ment activities and labor ef iciencies), online prescription re ill requests and of ice visit scheduling
(via patient portal technologies included in many practice management systems), and more active
patient monitoring of their daily health through mobile devices (which can be integrated back into
EHRs and personal health records).
Webelievepatients’onlineaccesstohealthinformationalsoisincreasingandthisaccessispositively
affecting patient health. More speci ic, the National Partnership for Women & Families recently
conducted a survey that found that 50% of patients now have online access to their health infor-
mation, versus only 26% in 2011. Further, the study found that those with online access are taking
advantage: 86% of those with online access to their health information are using it at least once
per year and 55% are using online access three or more times per year. Lastly, those frequently ac-
cessing their health information online are seeing bene its: 71% of those using online access three
or more times per year report that accessing the information motivates them to positively affect
their health, compared with only 39% of those who access online health information less often.
In the past year, strides also have been made regarding patients contributing to their own health
records. For example, Allscripts FollowMyHealth Achieve allows patients to post information from
consumer wireless technologies like activity trackers, weight scales, or blood pressure monitors to
their electronic health record available through a patient portal. In turn, providers can then moni-
tor patients’ compliance with care plans and initiate interventions to in luence behavior and affect
outcomes. Moreover, athenahealth recently reported that patient portal adoption has increased
markedly from the prior-year period, with more than 3.6 million patients registered as of third
quarter 2014—up more than 71% year-over-year. We believe that enabling this type of frequent,
consumer-friendly clinical contact will increase patient engagement and increase the likelihood of
in luencing patients’ lifestyle changes.
A recent study from EBRI also highlighted how technology is becoming a more important aspect of
healthcare consumers’ daily lives. For example, the study indicated that more than three-fourths
of the adult population with private health insurance used a smartphone, while 58% used a tablet.
Among these plan members, 20% to 29% used an app for nutrition management, 20% to 27%
used an app for general health information, and 15% to 26% used an app for weight management.
Moreover, among those who have never used an app for health-related reasons, up to 50% indi-
cated an interest in using one for health-related purposes (weight management, exercise, nutrition,
etc.) or to obtain information on drug prices, medical history, or other general health information.
Moreover, for individuals with HSAs and HRAs, more than 50% desired an app to check the balance
of their accounts.
Overall, we believe that we are on the cusp of an in lection point of HCIT increasing consumer
engagement because of providers’ heightened focus on patient portal activity (thanks in part to
heightened requirements in stage 2 of meaningful use), proven returns for payers (and, in turn,
providers involved in shared-savings models) for increasing patient access to their records and care
management tools, and the in lux of mobile technologies now at consumers’ ingertips.
HCIT adoption will assist in reducing overall healthcare costs. The inal area where we see a tie
between HCIT and CDHC is in the common goal of reducing healthcare costs for consumers.
Consumer-driven healthcare is centered on inding higher-quality care at lower price points, and we
believe that increased HCIT adoption will foster both of these objectives. HCIT will unquestionably
facilitate a consumer’s ability to judge providers against each other from an outcomes and cost per-
spective; moreover, it should help lower the overall cost curve, bene iting all consumers. Technolo-
gies like clinical decision support and patient registries also should promote higher quality-of-care
31Ryan S. Daniels, CFA +1 312 364 8418
William Blair & Company, L.L.C.
standards, population health management, and more rapid deployment of clinical best practices. As
big data continues to proliferate the healthcare market, we believe hundreds of billions of dollars
can be saved by more effectively identifying and illing gaps in care.
Lastly, we view telehealth as a prime example of using technology to promote high-quality care at
lower costs. A recent study by Red Quill Consulting found that the average cost of a telehealth visit
for a commercially insured patient is $40 to $50, compared with the average estimated cost of $136
to $176 for in-person care (probability weighted between emergency room, urgent care, physician
of ice visits, and doing nothing). The study also pushed back on the notion that increased telehealth
prevalence will drive costs up through more frequent utilization, as more than 80% of patients
used telehealth services only one time per year. Lastly, we believe the study shows that telehealth
was the appropriate venue for care with the most common diagnoses being for sinusitis, cold, and
lu and the patient’s issue was reported as resolved 83% of the time. In our view, this presents an
outstanding example of the intersection of consumer-centric technology and a stronger consumer
value proposition positioning a subsector for explosive growth over the coming years.
The Bottom Line
Webelievenumerousgovernmentalandprivate-marketinitiativeshaveincreasedthebasicadoption
of HCIT and that a further in lection point in the usefulness of these now-digitized work lows is on
the horizon. This transformation will be instrumental for CDHC initiatives to broadly take hold, as
full electronic record use will facilitate greater sharing of clinical and cost data, allowing patients
to make more-informed choices, as well as enabling the implementation of the population health
management initiatives needed to reduce waste and lower costs.
Factor Four: More Financial and Quality Responsibility Borne by
Healthcare Consumers
Our fourth tenet of consumer-centric healthcare is that most consumers will make better healthcare
decisions and healthier lifestyle choices when their money is on the line. As discussed earlier, a key
driver of this change is the large increase in high-deductible health plans across the United States.
According to the Centers for Disease Control and Prevention (CDC), the number of nonelderly (under
the age of 65) Americans with a high-deductible health plan (HDHP) or a consumer-driven health
plan (a high-deductible plan with a health savings account) has risen steadily over recent years.
In 2009 about 22.5 million persons were covered under some form of HDHP; this number rose by
60% through the beginning of 2014, to 36.0 million.
32 Ryan S. Daniels, CFA +1 312 364 8418
William Blair & Company, L.L.C.
Source: CDC/NCHS National Health Interview Survey
Exhibit 23
Consumer-Driven Healthcare
Percentage of Nonelderly Population Enrolled in HDHPs
16%
18%
20% 20%
22%
24%
7%
8%
9%
11%
12%
12%
0%
5%
10%
15%
20%
25%
30%
35%
40%
2009 2010 2011 2012 2013 2014
Consumer-driven health plan (high-deductible plan with a health savings
account)
High-deductible health plan
As discussed earlier, we believe this places signi icantly more inancial responsibility for healthcare
consumption on consumers themselves, which is a key element pushing consumer-centric health-
care into the mainstream.
Consumers Are Bearing a Larger Share of Medical Cost
Although the slowdown in total healthcare spending growth since the recession has been widely
reported, this trend has gone unnoticed by the majority of consumers, whose healthcare costs have
continued to increase at a higher rate than overall healthcare spending.
According to the Health Cost Institute, total healthcare spending on those with employer-sponsored
insurance rose 3.9% in 2013, a slight acceleration from 3.5% in 2012 and equal with 3.9% in 2011.
Out-of-pocket expenditures by those with employer-sponsored insurance rose at a slightly faster
rate, however, increasing by 4.0% in 2013, although this was a deceleration from an increase of
4.8% in 2012 and 4.6% in 2011.
The slowdown in out-of-pocket spending in 2013 was largely driven by lower generic (down 0.6%)
and brand name (down 10.2%) prescription spending, as well as lat per capita spending for young
adult women (ages 19 to 25). The slowdown in out-of-pocket spending among young adult women,
in particular, may re lect the impact of ACA mandates, like contraceptive coverage for adults.
Over the three years examined, we believe that faster growth in out-of-pocket spending was almost
entirely due to the already mentioned cost-shifting from employers and insurance companies to
consumers, and the movement of employees into HDHPs. Below, we discuss the movement of em-
ployees into HDHPs in greater detail.
Each year, the Kaiser Family Foundation and the Health Research and Educational Trust (HRET) pub-
lish an extensive survey of the employer-sponsored insurance market. The 2014 edition con irmed
that the trend of increasing employee responsibility for healthcare costs, which we have highlighted
since publishing the irst edition of Consumer-Centric Healthcare in 2005, continues apace.
33Ryan S. Daniels, CFA +1 312 364 8418
William Blair & Company, L.L.C.
Of note, the percentage of covered workers who enroll in HDHPs has increased markedly over recent
years, while plan structures like HMOs and PPOs have had their market share shrink. In 2014, for
example, roughly 20% of employer-sponsored bene iciaries were enrolled in HDHPs, signi icantly
above the 4% mix in 2006 (exhibit 24).
Exhibit 24
Consumer-Driven Healthcare
Distribution of Health Plan Enrollment for Covered Workers, by Plan Type
Source: Kaiser Family Foundation / Health Research & Educational Trust, Employer Health Benefits
Survey (2014)
<1%
<1%
<1%
1%
1%
1%
2%
3%
3%
3%
5%
5%
4%
7%
8%
10%
27%
46%
73%
13%
14%
16%
17%
19%
20%
20%
21%
20%
21%
25%
24%
27%
24%
29%
28%
31%
21%
16%
58%
57%
56%
55%
58%
60%
58%
57%
60%
61%
55%
54%
52%
46%
42%
39%
28%
26%
11%
8%
9%
9%
10%
8%
10%
12%
13%
13%
15%
15%
17%
18%
23%
21%
24%
14%
7%
20%
20%
19%
17%
13%
8%
8%
5%
4%
0% 20% 40% 60% 80% 100%
2014
2013
2012
2011
2010
2009
2008
2007
2006
2005
2004
2003
2002
2001
2000
1999
1996
1993
1988
Conventional HMO PPO POS HDHP/SO
In our view, one of the drivers of the shift toward HDHPs (which typically have lower premiums) has
been an increase in the portion of the monthly premium borne by employees. The mix of workers
who make no contribution to their premium for single coverage has decreased from 24% in 2002
to 14% in 2014, while the proportion of workers who pay between 25% and 50% of their premium
has increased from 13% in 2002 to 27% in 2013. A similar trend can be observed in exhibit 26, on
page 35, for family coverage: in 2002, 9% of workers made no contribution to the premium, which
fell to only 5% in 2014.
34 Ryan S. Daniels, CFA +1 312 364 8418
William Blair & Company, L.L.C.
Source: Kaiser Family Foundation / Health Research & Educational Trust, Employer Health Benefits
Survey (2014)
Exhibit 25
Consumer-Driven Healthcare
Distribution of Portion of Premium Paid by Workers for Single Coverage
14%
14%
16%
16%
16%
18%
20%
20%
23%
21%
21%
24%
24%
57%
62%
61%
59%
56%
58%
59%
56%
56%
57%
56%
57%
58%
27%
22%
22%
22%
24%
22%
19%
21%
18%
19%
21%
17%
13%
2%
2%
2%
3%
4%
1%
2%
2%
2%
3%
2%
3%
5%
0% 20% 40% 60% 80% 100%
2014
2013
2012
2011
2010
2009
2008
2007
2006
2005
2004
2003
2002
0%
Greater than 0%, less than or equal to 25%
Greater than 25%, less than or equal to 50%
Greater than 50%
35Ryan S. Daniels, CFA +1 312 364 8418
William Blair & Company, L.L.C.
Source: Kaiser Family Foundation / Health Research & Educational Trust, Employer Health Benefits
Survey (2014)
Exhibit 26
Consumer-Driven Healthcare
Distribution of Portion of Premium Paid by Workers for Family Coverage
5%
5%
6%
6%
5%
6%
7%
6%
9%
9%
7%
8%
9%
42%
42%
43%
47%
43%
48%
46%
47%
42%
46%
44%
47%
46%
38%
38%
37%
32%
35%
33%
33%
31%
37%
32%
36%
31%
29%
15%
14%
14%
15%
16%
12%
14%
15%
12%
13%
13%
14%
16%
0% 20% 40% 60% 80% 100%
2014
2013
2012
2011
2010
2009
2008
2007
2006
2005
2004
2003
2002
0%
Greater than 0%, less than or equal to 25%
Greater than 25%, less than or equal to 50%
Greater than 50%
In addition, as shown in exhibit 27, the average worker contribution to premiums for single cover-
age rose 8.2% in 2014—well above any of the underlying trends in overall spending growth, and
the second highest increase in the last seven years.
Exhibit 27
Consumer-Driven Healthcare
Average Annual Contribution to Premiums for Single Coverage
Source: Kaiser Family Foundation / Health Research & Educational Trust, Employer Health Benefits
Survey (2014)
$610 $627 $694 $721 $779 $899 $921 $951 $999 $1,081
$3,413
$3,615 $3,785
$3,983 $4,045 $4,150
$4,508 $4,664
$4,885 $4,994$4,023
$4,242
$4,479
$4,704 $4,824
$5,049
$5,429
$5,615
$5,884
$6,075
$0
$1,000
$2,000
$3,000
$4,000
$5,000
$6,000
$7,000
2005 2006 2007 2008 2009 2010 2011 2012 2013 2014
Worker contribution Employer contribution Total premium
36 Ryan S. Daniels, CFA +1 312 364 8418
William Blair & Company, L.L.C.
Also of note, the average PPO premium for single coverage in 2014 was $6,217, of which the worker
contributed $1,134; however, by switching to an HDHP, an employee can lower his or her monthly
premium contribution by about 20%, on average. In part, we believe this explains the nearly 47%
rise in the average employee PPO deductible since 2009, to $1,217. Moreover, as private exchanges
and de ined-contribution plans for healthcare continue to gain momentum, we believe the shift
toward high-deductible plans will only accelerate further in the coming years.
We also believe the trend toward HDHPs is set to accelerate further in 2015, as increasingly more
employers have selected such an offering as their only plan choice. For example, according to a recent
study by the National Business Group on Health, which included 136 large companies that, com-
bined, employ more than 7.5 million workers, 81% of employers (up from just over 50% in 2010)
now offer an HDHP as a plan choice and roughly one-third of them will offer only an HDHP in 2015
(up from only 22% in 2014 and 10% in 2010).
Inconjunctionwiththeearlier-discusseddevelopmentsonthepriceandqualitytransparencyfronts,
this increasing exposure to healthcare costs will provide consumers with a much greater incentive
to manage their healthcare expenditures.
For example, even under a traditional plan structure, annual deductibles have risen to a point that
encourages consumerism for basic medical services. As mentioned in the introduction of this report,
the average annual deductible for a single-coverage PPO plan was $843 in 2014, which is well above
the amount for most basic medical services like a primary care visit or a specialist visit. Even more
important, the average annual deductible for a single-coverage HDHP was $2,215 in 2014—meaning
that the consumer will be responsible for (and thus incentivized to compare costs) a wide variety
of non-emergent care in a given year (exhibit 28).
Source: Kaiser Family Foundation; Healthcare Blue Book; Health Care Advisory Board
Exhibit 28
Consumer-Driven Healthcare
Many Routine Services Fall Within Average Annual Deductibles
$150 $275 $400
$900 $1,000
$2,000
$6,000
$0
$1,000
$2,000
$3,000
$4,000
$5,000
$6,000
$7,000
Primary care
visit
Specialist
visit
Ultrasound MRI Endoscopy Cataract
Surgery
Renal failure
admission
Fall within HDHP deductible ($2,215)
Fall within PPO deductible ($843)
In our view, the rise of plan structures that require bene iciaries to shoulder a larger proportion of
healthcare costs, although sometimes not greeted enthusiastically by consumers, ultimately makes
patients a larger stakeholder in healthcare purchasing decisions, thereby creating incentives to seek
quality care at a lower cost.
37Ryan S. Daniels, CFA +1 312 364 8418
William Blair & Company, L.L.C.
Factor Five: Health Insurers, Employers, and Consumers Are
Embracing Consumerism
Throughout 2014, we continued to see evidence that insurers, employers, and payers are embracing
consumerism, largely through the abovementioned use of account-based health plans such as health
savings accounts (HSAs) and health reimbursement accounts (HRAs). Equally important, data that
validates the overall cost ef icacy and improved outcomes associated with such initiatives continue
to be published. In turn, we expect this trend will continue to gain momentum over the coming years.
In addition to these account-based plans, there also continues to be traction in de ined-contribution
plans, where employers provide their workforce with a ixed dollar amount for healthcare cover-
age and ask the employees to choose from a wide variety of coverage options (including HDHPs)
made available through private insurance exchanges. As discussed earlier in our report, this has
the potential to dramatically affect the healthcare landscape, as consumers will begin to shop for
coverage (and thus see a wide variety of cost differences between various health plans) based on
their individual (or family’s) healthcare needs.
In the past, the overwhelming majority of employees had almost no lexibility in purchasing health
insurance coverage—as they were limited to the two to three health plan options their employer
offered. Moreover, given the lack of plan changes year to year, inertia became a driving force behind
many employees’ decisions simply to re-enroll in the same coverage year after year (which helped
further distance consumers from healthcare cost realities). In the future environment, however,
switching costs will be extremely low, and individuals will be afforded the opportunity to change
health plans from year to year without the need for an employer to overhaul its entire bene it design.
We expect this trend will also drive providers into a more consumer-centric mindset, as they will need
to work to lower costs and compete on price to remain in increasingly narrow health plan networks.
In this vein, there is a strong argument to be made to invest in population health management and
consumer-centeredcaremodels,evenoutsideanaccountablecare(orshared-savings)environment.
More speci ic, with more of a retail insurance environment, payers will face signi icant pressure to
provide the lowest-cost health plans for buyers (again, who will now have a variety of options avail-
able to them to choose from). To maintain their margins, these payers will look for the lowest-cost,
highest-quality providers to partner with. In turn, the “retailization” of the insurance market will
yield another reason for healthcare providers to try to reduce their cost structure to gain market
share. Thus, the incentive to invest in population health and consumer-centric solutions remains
robust even without entering an ACO model—a realization that we believe is starting to permeate
the provider market for the irst time as we exit 2014.
Below, we provide several data points regarding the traction that consumer-centric health plans
(including momentum behind reference-based pricing—another key trend we highlighted in our
CDHC reports several years ago) have gained in the marketplace in 2014.
Kaiser/HRET Annual Employee Bene it Survey Points to Several Consumer-Centric Trends.
A 2014 Kaiser/HRET study on employee bene its highlighted several important trends that dem-
onstrate employers’ increased willingness to push additional healthcare inancial responsibility
onto consumers.
For example, roughly 13% of large employers (more than 200 employees) now consider offering
health bene its through a private exchange, with the largest employers (those with more than 5,000
employers) even more likely to do so, at 20%. Similarly, when asked which health bene it strate-
gies are most effective to contain healthcare costs, roughly half of all employers referenced higher
38 Ryan S. Daniels, CFA +1 312 364 8418
William Blair & Company, L.L.C.
employee cost sharing, while nearly 70% highlighted consumer-driven health plans. Of note, these
initiatives—along with wellness plans (which engage consumers in managing their health more
actively)—were the strategies recognized as most effective by irms in the survey (exhibit 29).
Exhibit 29
Consumer-Driven Healthcare
Employers Believe CDHPs Are Effective
Source: Kaiser Family Foundation / Health Research & Educational Trust, Employer Health Benefits
Survey (2014)
71%
53%
69%
47%
69%
54%
33%
27%
41%
26%
46%
25%
35%
62%
Wellness
programs
Managed
care
restrictions
CDHPs Cost sharing Disease
management
Tiered
networks
Narrow
networks
Very/somewhat effective Not too/at all effective
Annual Cigna Study Demonstrates Bene its of Consumer-Centric Plans. Cigna recently released
its Eighth Annual Cigna Choice Fund Experience Study, which compares the actual claims experience
of more than 3.6 million Cigna members who are enrolled in consumer-driven health plans, PPOs,
and traditional HMOs. Some of the key conclusions include:
• Members in consumer-centric plans were 50% more likely to complete a health risk assess-
ment (HRA), and those with chronic illness were up to 41% more likely to participate in disease
management programs.
• Members in consumer-centric plans were much more likely to use consumer-centric technology
applications. For example, 75% of these plan members registered for the myCigna.com personal
health portal and/or mobile app and they were 82% more likely to use tools to manage their
health and look up quality of care and cost information on providers.
• Consumer-centric plan members were more likely to adhere to recommended levels of care,
with equal or higher compliance rates on roughly 500 evidence-based medical best practices.
• Total cost trends were 12% lower for consumer-centric plan participants, with cumulative
ive-year savings per member of $7,900.
• Lastly, members of consumer-centric plans were much more likely to choose generic drug op-
tions and showed a 5% lower utilization rate at emergency rooms.
EmployeeBene itResearchInstituteStudyShowsMyriadImpactsofMoreConsumer-Centricity
inHealthcare.Similar to the abovementioned Cigna study, the Employee Bene it Research Institute
(EBRI) released a study in mid-2014 (based on 2013 data) that demonstrated marked differences
between the behaviors of individuals in consumer-centric healthcare plans and other insurance
types. More speci ic, plan members with health savings accounts and high-deductible plans were
mHealth Israel_Consumer centric healthcare 2015_william blair

More Related Content

What's hot

Health Care Reform 2009 W Medicare Info
Health Care Reform 2009 W Medicare InfoHealth Care Reform 2009 W Medicare Info
Health Care Reform 2009 W Medicare InfoCKiskaden
 
Rethinking Revenue Cycle Management_April 2015
Rethinking Revenue Cycle Management_April 2015Rethinking Revenue Cycle Management_April 2015
Rethinking Revenue Cycle Management_April 2015Spencer Brownell
 
Pwc top health industry issues for 2014
Pwc top health industry issues for 2014Pwc top health industry issues for 2014
Pwc top health industry issues for 2014eynonglyn
 
Mercer Capital's Value Focus: Medical Technology | Mid-Year 2021
Mercer Capital's Value Focus: Medical Technology | Mid-Year 2021Mercer Capital's Value Focus: Medical Technology | Mid-Year 2021
Mercer Capital's Value Focus: Medical Technology | Mid-Year 2021Mercer Capital
 
Medical Costs 2021- Analyst Insights from PwC Health Research Insittute
Medical Costs 2021- Analyst Insights from PwC Health Research InsittuteMedical Costs 2021- Analyst Insights from PwC Health Research Insittute
Medical Costs 2021- Analyst Insights from PwC Health Research InsittuteLevi Shapiro
 
Health Care Reform Goes Live: The Affordable Care Act in 2014
Health Care Reform Goes Live:  The Affordable Care Act in 2014Health Care Reform Goes Live:  The Affordable Care Act in 2014
Health Care Reform Goes Live: The Affordable Care Act in 2014Craig B. Garner
 
Impact on Health Reform on Device Development and Funding
Impact on Health Reform on Device Development and FundingImpact on Health Reform on Device Development and Funding
Impact on Health Reform on Device Development and FundingUBMCanon
 
WCS-1223519-WFI-EB-Market-Outlook-FNLprint
WCS-1223519-WFI-EB-Market-Outlook-FNLprintWCS-1223519-WFI-EB-Market-Outlook-FNLprint
WCS-1223519-WFI-EB-Market-Outlook-FNLprintTam Nguyen
 
hCentive Health Insurance Exchange Platform
hCentive Health Insurance Exchange PlatformhCentive Health Insurance Exchange Platform
hCentive Health Insurance Exchange PlatformAlisha North
 
Reasons Why You Need An Experienced Account Manager
Reasons Why You Need An Experienced Account ManagerReasons Why You Need An Experienced Account Manager
Reasons Why You Need An Experienced Account Managergingin4
 
Dsnp model of care training 2021
Dsnp model of care training 2021Dsnp model of care training 2021
Dsnp model of care training 2021JadeHartsell
 
Healthcare payers exceeded federally mandated medical loss ratio with esignat...
Healthcare payers exceeded federally mandated medical loss ratio with esignat...Healthcare payers exceeded federally mandated medical loss ratio with esignat...
Healthcare payers exceeded federally mandated medical loss ratio with esignat...DocuSign
 
Healthcare Consumerism POV
Healthcare Consumerism POVHealthcare Consumerism POV
Healthcare Consumerism POVElizabeth Peters
 
Governance healthcare financial lever
Governance healthcare financial lever Governance healthcare financial lever
Governance healthcare financial lever ACCESS Health Digital
 
mHealth Israel_Impact of Digital Innovations on Healthcare in Asia: 2020_Finn...
mHealth Israel_Impact of Digital Innovations on Healthcare in Asia: 2020_Finn...mHealth Israel_Impact of Digital Innovations on Healthcare in Asia: 2020_Finn...
mHealth Israel_Impact of Digital Innovations on Healthcare in Asia: 2020_Finn...Levi Shapiro
 

What's hot (20)

Health Care Reform 2009 W Medicare Info
Health Care Reform 2009 W Medicare InfoHealth Care Reform 2009 W Medicare Info
Health Care Reform 2009 W Medicare Info
 
Rethinking Revenue Cycle Management_April 2015
Rethinking Revenue Cycle Management_April 2015Rethinking Revenue Cycle Management_April 2015
Rethinking Revenue Cycle Management_April 2015
 
Pwc top health industry issues for 2014
Pwc top health industry issues for 2014Pwc top health industry issues for 2014
Pwc top health industry issues for 2014
 
Pandemic covid 19
Pandemic covid 19Pandemic covid 19
Pandemic covid 19
 
Mercer Capital's Value Focus: Medical Technology | Mid-Year 2021
Mercer Capital's Value Focus: Medical Technology | Mid-Year 2021Mercer Capital's Value Focus: Medical Technology | Mid-Year 2021
Mercer Capital's Value Focus: Medical Technology | Mid-Year 2021
 
Medical Costs 2021- Analyst Insights from PwC Health Research Insittute
Medical Costs 2021- Analyst Insights from PwC Health Research InsittuteMedical Costs 2021- Analyst Insights from PwC Health Research Insittute
Medical Costs 2021- Analyst Insights from PwC Health Research Insittute
 
Health Care Reform Goes Live: The Affordable Care Act in 2014
Health Care Reform Goes Live:  The Affordable Care Act in 2014Health Care Reform Goes Live:  The Affordable Care Act in 2014
Health Care Reform Goes Live: The Affordable Care Act in 2014
 
Impact on Health Reform on Device Development and Funding
Impact on Health Reform on Device Development and FundingImpact on Health Reform on Device Development and Funding
Impact on Health Reform on Device Development and Funding
 
WCS-1223519-WFI-EB-Market-Outlook-FNLprint
WCS-1223519-WFI-EB-Market-Outlook-FNLprintWCS-1223519-WFI-EB-Market-Outlook-FNLprint
WCS-1223519-WFI-EB-Market-Outlook-FNLprint
 
hCentive Health Insurance Exchange Platform
hCentive Health Insurance Exchange PlatformhCentive Health Insurance Exchange Platform
hCentive Health Insurance Exchange Platform
 
Reasons Why You Need An Experienced Account Manager
Reasons Why You Need An Experienced Account ManagerReasons Why You Need An Experienced Account Manager
Reasons Why You Need An Experienced Account Manager
 
Dsnp model of care training 2021
Dsnp model of care training 2021Dsnp model of care training 2021
Dsnp model of care training 2021
 
Health Reform 2.0: Insurance
Health Reform 2.0: InsuranceHealth Reform 2.0: Insurance
Health Reform 2.0: Insurance
 
Healthcare payers exceeded federally mandated medical loss ratio with esignat...
Healthcare payers exceeded federally mandated medical loss ratio with esignat...Healthcare payers exceeded federally mandated medical loss ratio with esignat...
Healthcare payers exceeded federally mandated medical loss ratio with esignat...
 
PAYMENT MODELS
PAYMENT MODELSPAYMENT MODELS
PAYMENT MODELS
 
Health Care Reform: What Employers Need to Know
Health Care Reform: What Employers Need to KnowHealth Care Reform: What Employers Need to Know
Health Care Reform: What Employers Need to Know
 
Healthcare Consumerism POV
Healthcare Consumerism POVHealthcare Consumerism POV
Healthcare Consumerism POV
 
Governance healthcare financial lever
Governance healthcare financial lever Governance healthcare financial lever
Governance healthcare financial lever
 
January2012
January2012January2012
January2012
 
mHealth Israel_Impact of Digital Innovations on Healthcare in Asia: 2020_Finn...
mHealth Israel_Impact of Digital Innovations on Healthcare in Asia: 2020_Finn...mHealth Israel_Impact of Digital Innovations on Healthcare in Asia: 2020_Finn...
mHealth Israel_Impact of Digital Innovations on Healthcare in Asia: 2020_Finn...
 

Similar to mHealth Israel_Consumer centric healthcare 2015_william blair

August Newsletter
August NewsletterAugust Newsletter
August Newslettermikewojcik
 
Newsletter Discussing Debt
Newsletter Discussing DebtNewsletter Discussing Debt
Newsletter Discussing DebtThe Horton Group
 
Newsletter Discussing Debt
Newsletter Discussing DebtNewsletter Discussing Debt
Newsletter Discussing DebtThe Horton Group
 
Mercer Capital's Value Focus: Healthcare Facilities | Year-End 2014
Mercer Capital's Value Focus: Healthcare Facilities | Year-End 2014Mercer Capital's Value Focus: Healthcare Facilities | Year-End 2014
Mercer Capital's Value Focus: Healthcare Facilities | Year-End 2014Mercer Capital
 
Health e-world (healthy world)
Health e-world (healthy world)Health e-world (healthy world)
Health e-world (healthy world)Bukmarker
 
The Anatomy of Modern Healthcare
The Anatomy of Modern HealthcareThe Anatomy of Modern Healthcare
The Anatomy of Modern HealthcareMentorMate
 
Health insurance exchanges critical success factors for payers
Health insurance exchanges critical success factors for payersHealth insurance exchanges critical success factors for payers
Health insurance exchanges critical success factors for payersApoorv S
 
Implementing Exchanges that Enhance Choice, Affordability, and Coverage
Implementing Exchanges that Enhance Choice, Affordability, and Coverage Implementing Exchanges that Enhance Choice, Affordability, and Coverage
Implementing Exchanges that Enhance Choice, Affordability, and Coverage hmartin920
 
Oliver Wyman Consulting on growing influence of ACOs: The ACO Surprise
Oliver Wyman Consulting on growing influence of ACOs: The ACO SurpriseOliver Wyman Consulting on growing influence of ACOs: The ACO Surprise
Oliver Wyman Consulting on growing influence of ACOs: The ACO SurpriseWalz Group, LLC.
 
Mercer Capital's Value Focus: Healthcare Facilities | Mid-Year 2015
Mercer Capital's Value Focus: Healthcare Facilities | Mid-Year 2015Mercer Capital's Value Focus: Healthcare Facilities | Mid-Year 2015
Mercer Capital's Value Focus: Healthcare Facilities | Mid-Year 2015Mercer Capital
 
Healthcare reform: Five trends to watch as the Affordable Care Act turns five
Healthcare reform:  Five trends to watch as the Affordable Care Act turns fiveHealthcare reform:  Five trends to watch as the Affordable Care Act turns five
Healthcare reform: Five trends to watch as the Affordable Care Act turns fivePwC
 
Preliminary Risk Assessment on WellPoint
Preliminary Risk Assessment on WellPointPreliminary Risk Assessment on WellPoint
Preliminary Risk Assessment on WellPointBrittany Shephard
 
Health Care Costs
Health Care Costs Health Care Costs
Health Care Costs BCBSNC
 
The Proposed Health Care Reform’S Impact On Marketing
The Proposed Health Care Reform’S Impact On MarketingThe Proposed Health Care Reform’S Impact On Marketing
The Proposed Health Care Reform’S Impact On MarketingStone Ward
 
Study Guide Health Care ReformHealth Care Reform OverviewWhe.docx
Study Guide Health Care ReformHealth Care Reform OverviewWhe.docxStudy Guide Health Care ReformHealth Care Reform OverviewWhe.docx
Study Guide Health Care ReformHealth Care Reform OverviewWhe.docxpicklesvalery
 

Similar to mHealth Israel_Consumer centric healthcare 2015_william blair (20)

August Newsletter
August NewsletterAugust Newsletter
August Newsletter
 
Newsletter Discussing Debt
Newsletter Discussing DebtNewsletter Discussing Debt
Newsletter Discussing Debt
 
Newsletter Discussing Debt
Newsletter Discussing DebtNewsletter Discussing Debt
Newsletter Discussing Debt
 
From Fee-for-Service to Fee-for-Value
From Fee-for-Service to Fee-for-ValueFrom Fee-for-Service to Fee-for-Value
From Fee-for-Service to Fee-for-Value
 
Mercer Capital's Value Focus: Healthcare Facilities | Year-End 2014
Mercer Capital's Value Focus: Healthcare Facilities | Year-End 2014Mercer Capital's Value Focus: Healthcare Facilities | Year-End 2014
Mercer Capital's Value Focus: Healthcare Facilities | Year-End 2014
 
Health e-world (healthy world)
Health e-world (healthy world)Health e-world (healthy world)
Health e-world (healthy world)
 
The Anatomy of Modern Healthcare
The Anatomy of Modern HealthcareThe Anatomy of Modern Healthcare
The Anatomy of Modern Healthcare
 
Health insurance exchanges critical success factors for payers
Health insurance exchanges critical success factors for payersHealth insurance exchanges critical success factors for payers
Health insurance exchanges critical success factors for payers
 
Implementing Exchanges that Enhance Choice, Affordability, and Coverage
Implementing Exchanges that Enhance Choice, Affordability, and Coverage Implementing Exchanges that Enhance Choice, Affordability, and Coverage
Implementing Exchanges that Enhance Choice, Affordability, and Coverage
 
Putting an I in Healthcare
Putting an I in HealthcarePutting an I in Healthcare
Putting an I in Healthcare
 
Oliver Wyman Consulting on growing influence of ACOs: The ACO Surprise
Oliver Wyman Consulting on growing influence of ACOs: The ACO SurpriseOliver Wyman Consulting on growing influence of ACOs: The ACO Surprise
Oliver Wyman Consulting on growing influence of ACOs: The ACO Surprise
 
Mercer Capital's Value Focus: Healthcare Facilities | Mid-Year 2015
Mercer Capital's Value Focus: Healthcare Facilities | Mid-Year 2015Mercer Capital's Value Focus: Healthcare Facilities | Mid-Year 2015
Mercer Capital's Value Focus: Healthcare Facilities | Mid-Year 2015
 
Healthcare reform: Five trends to watch as the Affordable Care Act turns five
Healthcare reform:  Five trends to watch as the Affordable Care Act turns fiveHealthcare reform:  Five trends to watch as the Affordable Care Act turns five
Healthcare reform: Five trends to watch as the Affordable Care Act turns five
 
Preliminary Risk Assessment on WellPoint
Preliminary Risk Assessment on WellPointPreliminary Risk Assessment on WellPoint
Preliminary Risk Assessment on WellPoint
 
Health Care Costs
Health Care Costs Health Care Costs
Health Care Costs
 
How CBO Evaluates Health Care Proposals
How CBO Evaluates Health Care ProposalsHow CBO Evaluates Health Care Proposals
How CBO Evaluates Health Care Proposals
 
The Proposed Health Care Reform’S Impact On Marketing
The Proposed Health Care Reform’S Impact On MarketingThe Proposed Health Care Reform’S Impact On Marketing
The Proposed Health Care Reform’S Impact On Marketing
 
Study Guide Health Care ReformHealth Care Reform OverviewWhe.docx
Study Guide Health Care ReformHealth Care Reform OverviewWhe.docxStudy Guide Health Care ReformHealth Care Reform OverviewWhe.docx
Study Guide Health Care ReformHealth Care Reform OverviewWhe.docx
 
Mechanisms used by managed care
Mechanisms used by managed careMechanisms used by managed care
Mechanisms used by managed care
 
Sb blog 102213-are-health-insurers-ready
Sb blog 102213-are-health-insurers-readySb blog 102213-are-health-insurers-ready
Sb blog 102213-are-health-insurers-ready
 

More from Levi Shapiro

Version Bravo- The Springboard for Navy SEAL entrepreneurship, cohort 003
Version Bravo- The Springboard for Navy SEAL entrepreneurship, cohort 003Version Bravo- The Springboard for Navy SEAL entrepreneurship, cohort 003
Version Bravo- The Springboard for Navy SEAL entrepreneurship, cohort 003Levi Shapiro
 
Radical Life Extension_Dr. Leon Peshkin_Dec 2023
Radical Life Extension_Dr. Leon Peshkin_Dec 2023Radical Life Extension_Dr. Leon Peshkin_Dec 2023
Radical Life Extension_Dr. Leon Peshkin_Dec 2023Levi Shapiro
 
Israel’s Life Science Hub 2023 English Abstract.pdf
Israel’s Life Science Hub 2023 English Abstract.pdfIsrael’s Life Science Hub 2023 English Abstract.pdf
Israel’s Life Science Hub 2023 English Abstract.pdfLevi Shapiro
 
Gil Bashe FINN Partners: The Future of Digital Health – Nose Dive or Transfor...
Gil Bashe FINN Partners: The Future of Digital Health – Nose Dive or Transfor...Gil Bashe FINN Partners: The Future of Digital Health – Nose Dive or Transfor...
Gil Bashe FINN Partners: The Future of Digital Health – Nose Dive or Transfor...Levi Shapiro
 
Urgent Request and Call for Action for Ensuring Safety and Inclusivity at MIT
Urgent Request and Call for Action for Ensuring Safety and Inclusivity at MITUrgent Request and Call for Action for Ensuring Safety and Inclusivity at MIT
Urgent Request and Call for Action for Ensuring Safety and Inclusivity at MITLevi Shapiro
 
HLTH-2023-Digital-Catalouge.pdf
HLTH-2023-Digital-Catalouge.pdfHLTH-2023-Digital-Catalouge.pdf
HLTH-2023-Digital-Catalouge.pdfLevi Shapiro
 
Baptist Health- Engineering the Future of Healthcare
Baptist Health- Engineering the Future of HealthcareBaptist Health- Engineering the Future of Healthcare
Baptist Health- Engineering the Future of HealthcareLevi Shapiro
 
YEDA Techn Transfer at Weizmann Institute- Discord and Challenges in Academic...
YEDA Techn Transfer at Weizmann Institute- Discord and Challenges in Academic...YEDA Techn Transfer at Weizmann Institute- Discord and Challenges in Academic...
YEDA Techn Transfer at Weizmann Institute- Discord and Challenges in Academic...Levi Shapiro
 
HADASIT: Tech Transfer and More in Life Science
HADASIT: Tech Transfer and More in Life ScienceHADASIT: Tech Transfer and More in Life Science
HADASIT: Tech Transfer and More in Life ScienceLevi Shapiro
 
Presenting to Investors & the Media.pdf
Presenting to Investors & the Media.pdfPresenting to Investors & the Media.pdf
Presenting to Investors & the Media.pdfLevi Shapiro
 
Nissan Elimelech, Founder, Augmedics: How I Built the World's First XR Surgic...
Nissan Elimelech, Founder, Augmedics: How I Built the World's First XR Surgic...Nissan Elimelech, Founder, Augmedics: How I Built the World's First XR Surgic...
Nissan Elimelech, Founder, Augmedics: How I Built the World's First XR Surgic...Levi Shapiro
 
Beyeonics CEO, Ron Schneider, Advances in Medical XR
Beyeonics CEO, Ron Schneider, Advances in Medical XRBeyeonics CEO, Ron Schneider, Advances in Medical XR
Beyeonics CEO, Ron Schneider, Advances in Medical XRLevi Shapiro
 
XRHealth Founder, Miki Levy
XRHealth Founder, Miki LevyXRHealth Founder, Miki Levy
XRHealth Founder, Miki LevyLevi Shapiro
 
Digital Health in US Health Systems.pptx
Digital Health in US Health Systems.pptxDigital Health in US Health Systems.pptx
Digital Health in US Health Systems.pptxLevi Shapiro
 
Course Syllabus (Digital Rosh): The Future of Digital Medicine- Biology, Gene...
Course Syllabus (Digital Rosh): The Future of Digital Medicine- Biology, Gene...Course Syllabus (Digital Rosh): The Future of Digital Medicine- Biology, Gene...
Course Syllabus (Digital Rosh): The Future of Digital Medicine- Biology, Gene...Levi Shapiro
 
Alagene BioFoundry: Releasing the Genie Out of the Bottle
Alagene BioFoundry: Releasing the Genie Out of the Bottle Alagene BioFoundry: Releasing the Genie Out of the Bottle
Alagene BioFoundry: Releasing the Genie Out of the Bottle Levi Shapiro
 
Digital Health Ecosystem- 2022 3rd Quarter Report
Digital Health Ecosystem- 2022 3rd Quarter ReportDigital Health Ecosystem- 2022 3rd Quarter Report
Digital Health Ecosystem- 2022 3rd Quarter ReportLevi Shapiro
 
EU Medical Device Regulatory Framework_Dec, 2022
EU Medical Device Regulatory Framework_Dec, 2022EU Medical Device Regulatory Framework_Dec, 2022
EU Medical Device Regulatory Framework_Dec, 2022Levi Shapiro
 
FINN Partners Global State of Digital Health Q3 2022
FINN Partners Global State of Digital Health Q3 2022FINN Partners Global State of Digital Health Q3 2022
FINN Partners Global State of Digital Health Q3 2022Levi Shapiro
 
Digitally powered participant-directed studies- Strategy for Decentralized Ca...
Digitally powered participant-directed studies- Strategy for Decentralized Ca...Digitally powered participant-directed studies- Strategy for Decentralized Ca...
Digitally powered participant-directed studies- Strategy for Decentralized Ca...Levi Shapiro
 

More from Levi Shapiro (20)

Version Bravo- The Springboard for Navy SEAL entrepreneurship, cohort 003
Version Bravo- The Springboard for Navy SEAL entrepreneurship, cohort 003Version Bravo- The Springboard for Navy SEAL entrepreneurship, cohort 003
Version Bravo- The Springboard for Navy SEAL entrepreneurship, cohort 003
 
Radical Life Extension_Dr. Leon Peshkin_Dec 2023
Radical Life Extension_Dr. Leon Peshkin_Dec 2023Radical Life Extension_Dr. Leon Peshkin_Dec 2023
Radical Life Extension_Dr. Leon Peshkin_Dec 2023
 
Israel’s Life Science Hub 2023 English Abstract.pdf
Israel’s Life Science Hub 2023 English Abstract.pdfIsrael’s Life Science Hub 2023 English Abstract.pdf
Israel’s Life Science Hub 2023 English Abstract.pdf
 
Gil Bashe FINN Partners: The Future of Digital Health – Nose Dive or Transfor...
Gil Bashe FINN Partners: The Future of Digital Health – Nose Dive or Transfor...Gil Bashe FINN Partners: The Future of Digital Health – Nose Dive or Transfor...
Gil Bashe FINN Partners: The Future of Digital Health – Nose Dive or Transfor...
 
Urgent Request and Call for Action for Ensuring Safety and Inclusivity at MIT
Urgent Request and Call for Action for Ensuring Safety and Inclusivity at MITUrgent Request and Call for Action for Ensuring Safety and Inclusivity at MIT
Urgent Request and Call for Action for Ensuring Safety and Inclusivity at MIT
 
HLTH-2023-Digital-Catalouge.pdf
HLTH-2023-Digital-Catalouge.pdfHLTH-2023-Digital-Catalouge.pdf
HLTH-2023-Digital-Catalouge.pdf
 
Baptist Health- Engineering the Future of Healthcare
Baptist Health- Engineering the Future of HealthcareBaptist Health- Engineering the Future of Healthcare
Baptist Health- Engineering the Future of Healthcare
 
YEDA Techn Transfer at Weizmann Institute- Discord and Challenges in Academic...
YEDA Techn Transfer at Weizmann Institute- Discord and Challenges in Academic...YEDA Techn Transfer at Weizmann Institute- Discord and Challenges in Academic...
YEDA Techn Transfer at Weizmann Institute- Discord and Challenges in Academic...
 
HADASIT: Tech Transfer and More in Life Science
HADASIT: Tech Transfer and More in Life ScienceHADASIT: Tech Transfer and More in Life Science
HADASIT: Tech Transfer and More in Life Science
 
Presenting to Investors & the Media.pdf
Presenting to Investors & the Media.pdfPresenting to Investors & the Media.pdf
Presenting to Investors & the Media.pdf
 
Nissan Elimelech, Founder, Augmedics: How I Built the World's First XR Surgic...
Nissan Elimelech, Founder, Augmedics: How I Built the World's First XR Surgic...Nissan Elimelech, Founder, Augmedics: How I Built the World's First XR Surgic...
Nissan Elimelech, Founder, Augmedics: How I Built the World's First XR Surgic...
 
Beyeonics CEO, Ron Schneider, Advances in Medical XR
Beyeonics CEO, Ron Schneider, Advances in Medical XRBeyeonics CEO, Ron Schneider, Advances in Medical XR
Beyeonics CEO, Ron Schneider, Advances in Medical XR
 
XRHealth Founder, Miki Levy
XRHealth Founder, Miki LevyXRHealth Founder, Miki Levy
XRHealth Founder, Miki Levy
 
Digital Health in US Health Systems.pptx
Digital Health in US Health Systems.pptxDigital Health in US Health Systems.pptx
Digital Health in US Health Systems.pptx
 
Course Syllabus (Digital Rosh): The Future of Digital Medicine- Biology, Gene...
Course Syllabus (Digital Rosh): The Future of Digital Medicine- Biology, Gene...Course Syllabus (Digital Rosh): The Future of Digital Medicine- Biology, Gene...
Course Syllabus (Digital Rosh): The Future of Digital Medicine- Biology, Gene...
 
Alagene BioFoundry: Releasing the Genie Out of the Bottle
Alagene BioFoundry: Releasing the Genie Out of the Bottle Alagene BioFoundry: Releasing the Genie Out of the Bottle
Alagene BioFoundry: Releasing the Genie Out of the Bottle
 
Digital Health Ecosystem- 2022 3rd Quarter Report
Digital Health Ecosystem- 2022 3rd Quarter ReportDigital Health Ecosystem- 2022 3rd Quarter Report
Digital Health Ecosystem- 2022 3rd Quarter Report
 
EU Medical Device Regulatory Framework_Dec, 2022
EU Medical Device Regulatory Framework_Dec, 2022EU Medical Device Regulatory Framework_Dec, 2022
EU Medical Device Regulatory Framework_Dec, 2022
 
FINN Partners Global State of Digital Health Q3 2022
FINN Partners Global State of Digital Health Q3 2022FINN Partners Global State of Digital Health Q3 2022
FINN Partners Global State of Digital Health Q3 2022
 
Digitally powered participant-directed studies- Strategy for Decentralized Ca...
Digitally powered participant-directed studies- Strategy for Decentralized Ca...Digitally powered participant-directed studies- Strategy for Decentralized Ca...
Digitally powered participant-directed studies- Strategy for Decentralized Ca...
 

Recently uploaded

Call Girls LB Nagar 7001305949 all area service COD available Any Time
Call Girls LB Nagar 7001305949 all area service COD available Any TimeCall Girls LB Nagar 7001305949 all area service COD available Any Time
Call Girls LB Nagar 7001305949 all area service COD available Any Timedelhimodelshub1
 
Call Girl Gurgaon Saloni 9711199012 Independent Escort Service Gurgaon
Call Girl Gurgaon Saloni 9711199012 Independent Escort Service GurgaonCall Girl Gurgaon Saloni 9711199012 Independent Escort Service Gurgaon
Call Girl Gurgaon Saloni 9711199012 Independent Escort Service GurgaonCall Girls Service Gurgaon
 
Call Girls Service Chandigarh Grishma ❤️🍑 9907093804 👄🫦 Independent Escort Se...
Call Girls Service Chandigarh Grishma ❤️🍑 9907093804 👄🫦 Independent Escort Se...Call Girls Service Chandigarh Grishma ❤️🍑 9907093804 👄🫦 Independent Escort Se...
Call Girls Service Chandigarh Grishma ❤️🍑 9907093804 👄🫦 Independent Escort Se...High Profile Call Girls Chandigarh Aarushi
 
Housewife Call Girls Nandini Layout - Phone No 7001305949 For Ultimate Sexual...
Housewife Call Girls Nandini Layout - Phone No 7001305949 For Ultimate Sexual...Housewife Call Girls Nandini Layout - Phone No 7001305949 For Ultimate Sexual...
Housewife Call Girls Nandini Layout - Phone No 7001305949 For Ultimate Sexual...narwatsonia7
 
College Call Girls Hyderabad Sakshi 9907093804 Independent Escort Service Hyd...
College Call Girls Hyderabad Sakshi 9907093804 Independent Escort Service Hyd...College Call Girls Hyderabad Sakshi 9907093804 Independent Escort Service Hyd...
College Call Girls Hyderabad Sakshi 9907093804 Independent Escort Service Hyd...delhimodelshub1
 
Call Girls Hyderabad Krisha 9907093804 Independent Escort Service Hyderabad
Call Girls Hyderabad Krisha 9907093804 Independent Escort Service HyderabadCall Girls Hyderabad Krisha 9907093804 Independent Escort Service Hyderabad
Call Girls Hyderabad Krisha 9907093804 Independent Escort Service Hyderabaddelhimodelshub1
 
Russian Escorts Delhi | 9711199171 | all area service available
Russian Escorts Delhi | 9711199171 | all area service availableRussian Escorts Delhi | 9711199171 | all area service available
Russian Escorts Delhi | 9711199171 | all area service availablesandeepkumar69420
 
Experience learning - lessons from 25 years of ATACC - Mark Forrest and Halde...
Experience learning - lessons from 25 years of ATACC - Mark Forrest and Halde...Experience learning - lessons from 25 years of ATACC - Mark Forrest and Halde...
Experience learning - lessons from 25 years of ATACC - Mark Forrest and Halde...scanFOAM
 
Russian Call Girl Chandapura Dommasandra Road - 7001305949 Escorts Service 50...
Russian Call Girl Chandapura Dommasandra Road - 7001305949 Escorts Service 50...Russian Call Girl Chandapura Dommasandra Road - 7001305949 Escorts Service 50...
Russian Call Girl Chandapura Dommasandra Road - 7001305949 Escorts Service 50...narwatsonia7
 
Call Girls Gurgaon Vani 9999965857 Independent Escort Service Gurgaon
Call Girls Gurgaon Vani 9999965857 Independent Escort Service GurgaonCall Girls Gurgaon Vani 9999965857 Independent Escort Service Gurgaon
Call Girls Gurgaon Vani 9999965857 Independent Escort Service Gurgaonnitachopra
 
Call Girl Bangalore Aashi 7001305949 Independent Escort Service Bangalore
Call Girl Bangalore Aashi 7001305949 Independent Escort Service BangaloreCall Girl Bangalore Aashi 7001305949 Independent Escort Service Bangalore
Call Girl Bangalore Aashi 7001305949 Independent Escort Service Bangalorenarwatsonia7
 
Call Girls Uppal 7001305949 all area service COD available Any Time
Call Girls Uppal 7001305949 all area service COD available Any TimeCall Girls Uppal 7001305949 all area service COD available Any Time
Call Girls Uppal 7001305949 all area service COD available Any Timedelhimodelshub1
 
Book Call Girls in Hosur - 7001305949 | 24x7 Service Available Near Me
Book Call Girls in Hosur - 7001305949 | 24x7 Service Available Near MeBook Call Girls in Hosur - 7001305949 | 24x7 Service Available Near Me
Book Call Girls in Hosur - 7001305949 | 24x7 Service Available Near Menarwatsonia7
 
Call Girl Hyderabad Madhuri 9907093804 Independent Escort Service Hyderabad
Call Girl Hyderabad Madhuri 9907093804 Independent Escort Service HyderabadCall Girl Hyderabad Madhuri 9907093804 Independent Escort Service Hyderabad
Call Girl Hyderabad Madhuri 9907093804 Independent Escort Service Hyderabaddelhimodelshub1
 
Book Call Girls in Noida Pick Up Drop With Cash Payment 9711199171 Call Girls
Book Call Girls in Noida Pick Up Drop With Cash Payment 9711199171 Call GirlsBook Call Girls in Noida Pick Up Drop With Cash Payment 9711199171 Call Girls
Book Call Girls in Noida Pick Up Drop With Cash Payment 9711199171 Call GirlsCall Girls Noida
 
2024 HCAT Healthcare Technology Insights
2024 HCAT Healthcare Technology Insights2024 HCAT Healthcare Technology Insights
2024 HCAT Healthcare Technology InsightsHealth Catalyst
 
Gurgaon Sector 45 Call Girls ( 9873940964 ) Book Hot And Sexy Girls In A Few ...
Gurgaon Sector 45 Call Girls ( 9873940964 ) Book Hot And Sexy Girls In A Few ...Gurgaon Sector 45 Call Girls ( 9873940964 ) Book Hot And Sexy Girls In A Few ...
Gurgaon Sector 45 Call Girls ( 9873940964 ) Book Hot And Sexy Girls In A Few ...vrvipin164
 
Gurgaon Sector 68 Call Girls ( 9873940964 ) Book Hot And Sexy Girls In A Few ...
Gurgaon Sector 68 Call Girls ( 9873940964 ) Book Hot And Sexy Girls In A Few ...Gurgaon Sector 68 Call Girls ( 9873940964 ) Book Hot And Sexy Girls In A Few ...
Gurgaon Sector 68 Call Girls ( 9873940964 ) Book Hot And Sexy Girls In A Few ...ggsonu500
 
Call Girl Service ITPL - [ Cash on Delivery ] Contact 7001305949 Escorts Service
Call Girl Service ITPL - [ Cash on Delivery ] Contact 7001305949 Escorts ServiceCall Girl Service ITPL - [ Cash on Delivery ] Contact 7001305949 Escorts Service
Call Girl Service ITPL - [ Cash on Delivery ] Contact 7001305949 Escorts Servicenarwatsonia7
 

Recently uploaded (20)

Call Girls LB Nagar 7001305949 all area service COD available Any Time
Call Girls LB Nagar 7001305949 all area service COD available Any TimeCall Girls LB Nagar 7001305949 all area service COD available Any Time
Call Girls LB Nagar 7001305949 all area service COD available Any Time
 
Call Girl Gurgaon Saloni 9711199012 Independent Escort Service Gurgaon
Call Girl Gurgaon Saloni 9711199012 Independent Escort Service GurgaonCall Girl Gurgaon Saloni 9711199012 Independent Escort Service Gurgaon
Call Girl Gurgaon Saloni 9711199012 Independent Escort Service Gurgaon
 
Call Girls Service Chandigarh Grishma ❤️🍑 9907093804 👄🫦 Independent Escort Se...
Call Girls Service Chandigarh Grishma ❤️🍑 9907093804 👄🫦 Independent Escort Se...Call Girls Service Chandigarh Grishma ❤️🍑 9907093804 👄🫦 Independent Escort Se...
Call Girls Service Chandigarh Grishma ❤️🍑 9907093804 👄🫦 Independent Escort Se...
 
Call Girls in Lucknow Esha 🔝 8923113531 🔝 🎶 Independent Escort Service Lucknow
Call Girls in Lucknow Esha 🔝 8923113531  🔝 🎶 Independent Escort Service LucknowCall Girls in Lucknow Esha 🔝 8923113531  🔝 🎶 Independent Escort Service Lucknow
Call Girls in Lucknow Esha 🔝 8923113531 🔝 🎶 Independent Escort Service Lucknow
 
Housewife Call Girls Nandini Layout - Phone No 7001305949 For Ultimate Sexual...
Housewife Call Girls Nandini Layout - Phone No 7001305949 For Ultimate Sexual...Housewife Call Girls Nandini Layout - Phone No 7001305949 For Ultimate Sexual...
Housewife Call Girls Nandini Layout - Phone No 7001305949 For Ultimate Sexual...
 
College Call Girls Hyderabad Sakshi 9907093804 Independent Escort Service Hyd...
College Call Girls Hyderabad Sakshi 9907093804 Independent Escort Service Hyd...College Call Girls Hyderabad Sakshi 9907093804 Independent Escort Service Hyd...
College Call Girls Hyderabad Sakshi 9907093804 Independent Escort Service Hyd...
 
Call Girls Hyderabad Krisha 9907093804 Independent Escort Service Hyderabad
Call Girls Hyderabad Krisha 9907093804 Independent Escort Service HyderabadCall Girls Hyderabad Krisha 9907093804 Independent Escort Service Hyderabad
Call Girls Hyderabad Krisha 9907093804 Independent Escort Service Hyderabad
 
Russian Escorts Delhi | 9711199171 | all area service available
Russian Escorts Delhi | 9711199171 | all area service availableRussian Escorts Delhi | 9711199171 | all area service available
Russian Escorts Delhi | 9711199171 | all area service available
 
Experience learning - lessons from 25 years of ATACC - Mark Forrest and Halde...
Experience learning - lessons from 25 years of ATACC - Mark Forrest and Halde...Experience learning - lessons from 25 years of ATACC - Mark Forrest and Halde...
Experience learning - lessons from 25 years of ATACC - Mark Forrest and Halde...
 
Russian Call Girl Chandapura Dommasandra Road - 7001305949 Escorts Service 50...
Russian Call Girl Chandapura Dommasandra Road - 7001305949 Escorts Service 50...Russian Call Girl Chandapura Dommasandra Road - 7001305949 Escorts Service 50...
Russian Call Girl Chandapura Dommasandra Road - 7001305949 Escorts Service 50...
 
Call Girls Gurgaon Vani 9999965857 Independent Escort Service Gurgaon
Call Girls Gurgaon Vani 9999965857 Independent Escort Service GurgaonCall Girls Gurgaon Vani 9999965857 Independent Escort Service Gurgaon
Call Girls Gurgaon Vani 9999965857 Independent Escort Service Gurgaon
 
Call Girl Bangalore Aashi 7001305949 Independent Escort Service Bangalore
Call Girl Bangalore Aashi 7001305949 Independent Escort Service BangaloreCall Girl Bangalore Aashi 7001305949 Independent Escort Service Bangalore
Call Girl Bangalore Aashi 7001305949 Independent Escort Service Bangalore
 
Call Girls Uppal 7001305949 all area service COD available Any Time
Call Girls Uppal 7001305949 all area service COD available Any TimeCall Girls Uppal 7001305949 all area service COD available Any Time
Call Girls Uppal 7001305949 all area service COD available Any Time
 
Book Call Girls in Hosur - 7001305949 | 24x7 Service Available Near Me
Book Call Girls in Hosur - 7001305949 | 24x7 Service Available Near MeBook Call Girls in Hosur - 7001305949 | 24x7 Service Available Near Me
Book Call Girls in Hosur - 7001305949 | 24x7 Service Available Near Me
 
Call Girl Hyderabad Madhuri 9907093804 Independent Escort Service Hyderabad
Call Girl Hyderabad Madhuri 9907093804 Independent Escort Service HyderabadCall Girl Hyderabad Madhuri 9907093804 Independent Escort Service Hyderabad
Call Girl Hyderabad Madhuri 9907093804 Independent Escort Service Hyderabad
 
Book Call Girls in Noida Pick Up Drop With Cash Payment 9711199171 Call Girls
Book Call Girls in Noida Pick Up Drop With Cash Payment 9711199171 Call GirlsBook Call Girls in Noida Pick Up Drop With Cash Payment 9711199171 Call Girls
Book Call Girls in Noida Pick Up Drop With Cash Payment 9711199171 Call Girls
 
2024 HCAT Healthcare Technology Insights
2024 HCAT Healthcare Technology Insights2024 HCAT Healthcare Technology Insights
2024 HCAT Healthcare Technology Insights
 
Gurgaon Sector 45 Call Girls ( 9873940964 ) Book Hot And Sexy Girls In A Few ...
Gurgaon Sector 45 Call Girls ( 9873940964 ) Book Hot And Sexy Girls In A Few ...Gurgaon Sector 45 Call Girls ( 9873940964 ) Book Hot And Sexy Girls In A Few ...
Gurgaon Sector 45 Call Girls ( 9873940964 ) Book Hot And Sexy Girls In A Few ...
 
Gurgaon Sector 68 Call Girls ( 9873940964 ) Book Hot And Sexy Girls In A Few ...
Gurgaon Sector 68 Call Girls ( 9873940964 ) Book Hot And Sexy Girls In A Few ...Gurgaon Sector 68 Call Girls ( 9873940964 ) Book Hot And Sexy Girls In A Few ...
Gurgaon Sector 68 Call Girls ( 9873940964 ) Book Hot And Sexy Girls In A Few ...
 
Call Girl Service ITPL - [ Cash on Delivery ] Contact 7001305949 Escorts Service
Call Girl Service ITPL - [ Cash on Delivery ] Contact 7001305949 Escorts ServiceCall Girl Service ITPL - [ Cash on Delivery ] Contact 7001305949 Escorts Service
Call Girl Service ITPL - [ Cash on Delivery ] Contact 7001305949 Escorts Service
 

mHealth Israel_Consumer centric healthcare 2015_william blair

  • 1. Please refer to important disclosures on pages 46 and 47. Analyst certification is on page 46. William Blair does and seeks to do business with companies covered in its research reports. As a result, inves- tors should be aware that the firm may have a conflict of interest that could affect the objectivity of this report. Investors should consider this report as a single factor in making an investment decision. Equity Research Healthcare | Healthcare Services and Healthcare Technology Consumer-Centric Healthcare: 2015 Update The Tipping Point Has Arrived In January 2005, we published the irst of our continuing series of reports on the evolving role of the consumer in the U.S. healthcare market. The report, titled The Power of Choice: On the Brink of a Consumer Revolution in Health Care, provided our expectations for the most signi icant developments in the healthcare marketplace over the coming years. Adecadelater,ourthesisremainsintactandcontinuestounfoldrapidly.Wecontinue to believe that consumers—in tandem with disruptive healthcare technology and healthcare services providers—are the key to solving many of healthcare’s woes, particularly the unsustainably high cost of care in the United States. Our 2015 report also comes at an interesting time, as myriad trends have solidi ied the consumer—through public exchanges, private exchanges, and high-deductible health plans—as the fastest-growing payer of healthcare in the United States. This development is beginning to unleash our long-standing theory that the disruptive forces of competition will create a lower-cost system that promotes the growth of highly ef icient, low-cost, and high-quality providers and technologies. Equally important, the continued movement of inancial and quality risk back to providers (and increasingly to consumers themselves) is creating one of the more important changes witnessed in the U.S. healthcare delivery system in decades; put simply, we believe that providers and consumers alike will seek preventive medicine, cost ef iciency, clinical ef icacy, and overall value in healthcare more than ever before. In turn, this could drive signi icant change regarding the primary point of care delivery in the United States (rapidly moving outside the hospital), the overall cost of healthcare in our country (no longer trending well above the rate of GDP growth), and the investment decisions made by healthcare providers (more investments in data analytics, telehealth solutions, patient engagement strategies, well-being solutions, and ambulatory operations). However, given the complex and politically charged nature of healthcare, we also acknowledge that changes to long- standing delivery and reimbursement models likely will be drawn out, complex, and nonlinear. Still, we continue to believe that consumer-centric healthcare providers (or those companies that provide the technology and services to enable more consumer empowerment, quality, and ef iciency) will experience strong top- and bottom-line growth over the coming years. Moreover, we believe that investors in both the public and private-equity markets will achieve superior long-term returns by identifying and investing in these companies. The purpose of this report—now the 11th in our annual series on the topic—is to assist in that process. Ryan S. Daniels, CFA Jeffrey Garro Nick Hiller +1 312 364 8418 +1 312 364 8022 +1 312 364 8326 rdaniels@williamblair.com jgarro@williamblair.com nhiller@williamblair.com January 6, 2015 Industry Report (15-002)
  • 2. 2 Ryan S. Daniels, CFA +1 312 364 8418 William Blair & Company, L.L.C. Contents Introduction.................................................................................................................................................................3 Factor One: The High Cost of Healthcare in the United States...................................................8 Factor Two: Increased Availability of Healthcare Price and Quality Information ..... 13 Factor Three: Greater Use of HCIT Will Enable the CDHC Revolution................................. 22 Factor Four: More Financial and Quality Responsibility Borne by Healthcare Consumers ................................................................................................................................................ 31 Factor Five: Health Insurers, Employers, and Consumers Are Embracing Consumerism .......................................................................................................................................... 37 Summary and Investment Conclusions..................................................................................................... 41 Emerging Investment Themes................................................................................................................. 42 Emerging Investment Risks...................................................................................................................... 43 List of Public and Private Consumer-Centric Healthcare Companies................................. 44
  • 3. 3Ryan S. Daniels, CFA +1 312 364 8418 William Blair & Company, L.L.C. Introduction During the past decade, we have consistently written about the emerging trend of consumerism in the healthcare marketplace, and how this trend held the potential to radically reshape the U.S. healthcare delivery system for the better. While our conviction in this topic never waned, the rate of change was slower than we anticipated— as myriad inancial, political, and structural headwinds upheld the status quo, despite a number of emerging market forces. More recently, however, a convergence of events has rapidly pushed our thesis forward, and we believe a tipping point has arrived that is markedly changing the U.S. healthcare landscape. However, before addressing this changing environment, we believe it is instructive to review the past, especially the various in lection points that have occurred over the last several decades, which are now converging to make our consumer-centric thesis a reality. We brie ly recap these key in lec- tion points below. The Medicare Prescription Drug, Improvement, and Modernization Act. Near the end of 2003, President George W. Bush signed the Medicare Prescription Drug, Improvement, and Moderniza- tion Act (MMA) into law. While the marquee element of MMA was the introduction of a prescription drug bene it into Medicare, the legislation also created a new health savings account (HSA) statute, which allowed individuals to put pretax dollars into healthcare savings accounts that were paired with high-deductible health plans (HDHPs). While such plans had only limited traction at irst, they have since become the fastest-growing health plan offering in the United States, now accounting for roughly 20% of all privately insured individuals in the country (up from only 4% in 2006). Along with other bene it changes, the momen- tum in HDHPs has driven the average annual deductible for covered workers in the United States up by more than 100% since 2006; a 2014 Kaiser Family Foundation study reports that average deductibles have risen from only $584 in 2006 to $1,217 in 2014. In our view, this has been a clear boost for consumer-centric healthcare, as the incentive to become a more price-conscious consumer rises in tandem with deductible levels. Inaddition,averageHDHPsnowcarrydeductiblesofmorethan$2,000—roughlythreetimesgreater than the average PPO deductible of slightly more than $700. In turn, patients with HDHPs are likely to encounter signi icantly more medical procedures that fall within their deductible (i.e., become out-of-pocket expenditures). As a result, while it was unheard of to have insured workers covering the full costs of MRIs, endoscopies, cataract surgeries, and other non-acute procedures in the recent past, it is now commonplace for one in ive patients to face this reality. Accordingly, providers are now being pushed to offer price transparency for their services and have, for the irst time, also begun to compete on price to maintain market share. Overall, we believe the MMA legislation of 2003 is an underappreciated element of consumer-centric healthcare, yet its enactment created the foundation for the high-deductible plans, which are now sweeping the nation and putting more inancial responsibility directly into the hands of consumers. The Patient Protection and Affordable Care Act. In early 2010, President Barack Obama signed the Patient Protection and Affordable Care Act (ACA) into law. While the marquee piece of this leg- islation was expanded healthcare coverage for the uninsured, the law also contained a number of important elements that are now serving as key drivers of consumer-centric healthcare.
  • 4. 4 Ryan S. Daniels, CFA +1 312 364 8418 William Blair & Company, L.L.C. First, the law contained a wide variety of reforms to the Medicare payment system, which encourage a movement from a fee-for-service reimbursement structure to a fee-for-value environment. While the most well-known of these changes was the introduction of Medicare Accountable Care Organiza- tions (or ACOs), there also were a variety of bundled payment structures and novel reimbursement penalties—all of which combine to push providers toward bearing more inancial and quality risk for the care they provide. In our view, this has begun a massive shift in the healthcare marketplace, as providers are now incented to reduce the costs of care, focus on preventive medicine, and better engage consumers to understand their wants and needs and to help empower them to make lifestyle changes that lower long-term healthcare costs. In tandem with these changes—and to help fund the ACA’s coverage expansion—the law also put in place a number of rate reductions and additional penalties, which will begin to pressure acute-care hospitals’ Medicare margins over the coming years and (as we discuss later) require fundamental changes in the way hospitals manage their operations. In addition, the legislation established health insurance exchanges, where individuals can seek out a wide variety of insurance plans to meet their coverage needs. Importantly, roughly 20% of participants on the exchanges have purchased Bronze plans, while nearly 65% have purchased Silver plans. This is important because Silver plans are expected to have an average individual an- nual deductible of nearly $2,400 in 2015, while Bronze plans will hold a nearly $5,200 individual deductible. Thus, we estimate that more than 85% of the exchange population will fall in the HDHP category, which will stimulate further price shopping and consumer-centric behavior for these par- ticipants, as discussed above. Lastly, the ACA presented a novel excise tax on high-cost employer medical plans (often referred to as the “Cadillac tax”). This nondeductible tax, which takes effect in 2018, will require insurers (including employers for self-insured plans) to pay a 40% excise tax on the aggregate value of employer-sponsored insurance in excess of speci ied thresholds (in 2018, $10,200 for individual coverage and $27,500 for family coverage, with some exceptions). While few plans are expected to trigger this tax in 2018, it is estimated that as many as 50% to 75% of employers will face this tax over the next decade, as health insurance costs continue to rise. Thus, to offset this tax, we anticipate even more employers will move populations onto HDHPs (which are much less likely to face the tax, given their signi icantly higher deductibles and lower premium costs), which we believe will help further accelerate the consumer-centric trends discussed above. Demographic trends are actually working against many providers…Many investors view the aging U.S. population as a bullish sign for healthcare providers—as seniors tend to use healthcare services at a disproportionate rate compared with other age cohorts. As a result, it follows that the increase in Medicare bene iciaries from about 54 million today to a projection of more than 64 million by 2020 is bullish for the healthcare industry. However, given the recent baby bust and lower healthcare utilization in the commercial population, it is estimated that the average hospital’s case mix will move from approximately 42% Medicare in 2012 to roughly 58% Medicare in 2022. In our view, this is quite troubling for providers, as the aver- age hospital gross margin on Medicare patients is modestly negative at present (with the American Hospital Association estimating a Medicare payment-to-cost ratio of 0.86 in 2012); moreover, this is set to worsen signi icantly going forward (exhibit 1), as nearly $260 billion in Medicare hospital payment cuts are scheduled to occur through 2022.
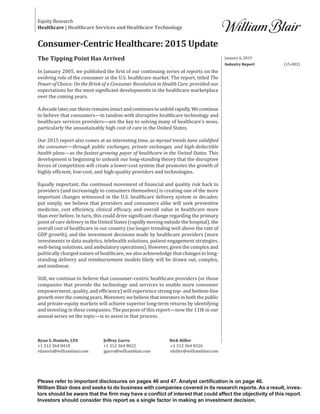
  • 5. 5Ryan S. Daniels, CFA +1 312 364 8418 William Blair & Company, L.L.C. Source: Tennessee Hospital Association Exhibit 1 Consumer-Driven Healthcare Declining Medicare Reimbursement Expected to Pressure Margins (25.0)% (20.0)% (15.0)% (10.0)% (5.0)% 0.0% 5.0% AverageChangeinMedicare Reimbursement …and cross-subsidizing with higher commercial rates is no longer possible. Given the abovemen- tioned scenario, the standard operating procedure for hospitals would be to simply cross-subsidize underpaymentsfrompublicpayerswithhighercommercialrates(theAmericanHospitalAssociation estimates a 2012 payment-to-cost ratio of 1.49 with private payers). Unfortunately for providers, we believe their ability to do so has greatly diminished over the last ive years—as employers have pushed back hard against rising healthcare costs and as individuals now bear markedly greater healthcare inancial responsibility than ever before, thus making it dif icult for hospitals to push up price with impunity. Combined with the abovementioned mix shift toward Medicare cases, it is this trend that has driven many leading providers to accept the fact that their traditional business model is slowly dying. In turn, this is pushing leading providers in nearly every market across the United States into more popula- tion health management arrangements with commercial and government payers (and even driving a number of leading providers to buy insurers or apply for insurance licenses). As mentioned earlier, we believe that better understanding individuals’ needs and preferences, as well as treating them more like consumers, will be a key to making this conversion work. Moreover, it will be critical to view patient volume as a key cost driver (versus pro it driver) in the near future, which we believe will soon put consumer-centricity and well-being at the heart of each provider’s operating model. Theriseoftheindividualhealthinsurancemarketalsoisakeydriver.Anothermegatrendsweep- ing the healthcare industry is the rise of the retail insurance market. For example, it is estimated that roughly 2 million individuals bought insurance via a private health insurance exchange in 2014, but this number is expected to skyrocket to nearly 40 million individuals by 2018. As we discussed in our 2014 report, we view this as a key driver of consumer-centric healthcare, as individuals will have signi icantly greater choice in (and likely more inancial responsibility for) their health plan options, thus becoming more active healthcare consumers from the outset. Combing this metric with other retail insurance markets (e.g., Medicare Advantage, the public exchanges, and private Medicaid options), The Advisory Board Company estimates that the retail health insurance market will grow to nearly 87 million members by 2018 (exhibit 2), which equates to nearly a quarter of the total projected U.S. population before the end of the decade.
  • 6. 6 Ryan S. Daniels, CFA +1 312 364 8418 William Blair & Company, L.L.C. Exhibit 2 Consumer-Driven Healthcare Retail Market Expected to Grow to 87 Million Enrollees by 2018 Sources: Congressional Budget Office, Accenture, Kaiser Family Foundation, and The Advisory Board Company 25 million 5 million 40 million 17 million 87 million Public exchange "Private Option" Medicaid expansion Private exchanges Medicare exchanges Total retail market Also of note, as risk dollars shift into these retail insurance markets, there is a signi icant movement from actuarial underwriting to individual underwriting. More speci ic, payments for members in these plans are generally driven by the actual disease states and comorbidity level of individual patients, and quality bonuses are paid based on the individual outcomes of patients. This ensures that providers with higher-risk (sicker) patients are paid more to manage their care. Or, stated dif- ferently, it ensures that cherry-picking of only the healthiest patients in each market (same payment but lower overall costs) does not occur. Therefore, there is also a clear need for data analytics to help payers better understand each patient’s speci ic risk characteristics and health status, as both revenue integrity and compliance are now dependent on it. Moreover, as quality measures are now monitored on an individual patient basis, there is an increased need for these payers to engage consumers more actively in care management and well-being initiatives than ever before. Technologyisbecominganenablerofconsumer-centrichealthcare.Lastly,webelievethemassive investments in electronic health records should yield marked improvements in the U.S. healthcare system over time. To be fair, EHRs arguably yield little value to consumers on their own; however, as data is now stored electronically, the next generation of healthcare technologies will focus on better communicating that data to the patient and other providers, risk stratifying patients more accurately, reducing waste, and providing more preventive care—at the lowest cost—to those at risk (both at the right time and in the best venue). Webelievethishasthepotentialtoyieldmarkedimprovementsinpatientcareandcosttrendsacross the United States, further enabling providers to bear inancial and quality risk that was impractical to manage under the paper-based systems of yesteryear. Again, as this arises, much greater engage- ment of the consumer will be key and, in our view, is eminently achievable. Outside of electronic health records and the coming wave of big data in healthcare technology, there are myriad other factors that should enable a more consumer-centric marketplace. More speci ic, trends like telehealth, biometric monitors, and pricing and quality data applications should yield a healthcare marketplace that eventually resembles the rest of the economy (versus being isolated against innovations that have bene ited other areas of society).
  • 7. 7Ryan S. Daniels, CFA +1 312 364 8418 William Blair & Company, L.L.C. Perhaps the next question then becomes: Why did it take so long to get to this point, and why are we so convinced the in lection point is here? This is a much more dif icult question to answer, as the factors driving this change are myriad and interrelated, and are discussed in more detail throughout our reports over the last decade. In summary, however, we believe that all the abovementioned trends—some of which have been in place for decades—are only now converging to force this change. For example, the movement of HDHPs to 20% market share (12 years in the making) and the pending wave of retail insur- ance growth (more novel, but with roots stemming back to the 1980s) are all but eliminating the ability for hospitals to consistently raise commercial prices to cross-subsidize weak government reimbursements. Combined with unfavorable demographic trends (emerging) and reduced Medicare payments (via the 2010 ACA legislation and sequestration cuts in 2013), this is driving most providers down a path toward increased inancial and clinical risk bearing (a 2012 starting point), which is turning the healthcare business model on its head (today); more speci ic, patient volume moves from a key pro it driver in the old world to the key direct cost in the new healthcare paradigm. And this has led to a dramatic change in how providers view the healthcare consumer today. As a result, the many consumer-centric and low-cost solutions that were once rejected by provid- ers as against their best interests (reducing volumes negatively affected sales under fee-for-service models) should emerge and be embraced as key solutions for their cost-reduction and quality- improvement initiatives going forward. In turn, we believe this will continue to drive a signi icant amount of disruption to traditional healthcare business models over the coming years. So what does all of this mean for healthcare providers and the public- and private-market investors who help fund their growth? We believe that as the healthcare marketplace becomes more consumer-centric, the disruptive forces of competition will create a system that promotes growth of highly ef icient, low-cost, and high-quality providers and technologies. In turn, we expect that more consumer-centric healthcare services and information technology providers (such as those pro iled in this report) will experience strong top- and bottom-line growth over the coming years. Moreover, we believe that investors will achieve superior long-term returns by identifying and investing in these companies. To assist investors in this process, we present an updated overview of the emerging consumer- centric healthcare marketplace. In particular, we focus on recent developments surrounding the ive key elements that we believe will drive greater growth of consumer-centric healthcare over the coming years: 1. a dire need for healthcare cost control in the United States, which remains pressing despite the recent slowdown in healthcare expenditure growth; 2. increased quality and pricing transparency for healthcare products and services; 3. greater use of healthcare information technology solutions among providers and consumers; 4. growing responsibility for healthcare utilization and quality at both the consumer and provider levels; and 5. increasing employer, insurer, and consumer support for more consumer-centric healthcare solutions.
  • 8. 8 Ryan S. Daniels, CFA +1 312 364 8418 William Blair & Company, L.L.C. After this analysis, we provide investors with an overview of key investment merits and risks to monitor over the coming years; we then conclude our report with our updated list of some of the leading consumer-centric healthcare operators in both the public and private markets, which we believe are well positioned for growth over the coming years. Factor One: The High Cost of Healthcare in the United States Before discussing consumer-centric healthcare drivers in more detail, we begin with a brief update on perhaps the most pervasive trend in healthcare today—its sizable cost. We believe this discus- sion is crucial as exorbitant healthcare costs and the structural inef iciencies that support them continue to serve as two of the most important impetuses for broader change in the marketplace. To be fair, U.S. healthcare expenditures have experienced a dramatic slowdown over the last sev- eral years. In fact, a recent government report showed that total U.S. health expenditures in 2013 increased at the slowest rate in decades: per capita spending grew only 2.9% in 2013, compared with 3.4% in 2012 and 5.3%, on average, between 2004 and 2008. Still, whether or not this cost trend has staying power remains to be seen, and the impact of cyclical- ity versus structural considerations (including consumer-centric healthcare) remains the subject of intense debate among experts. Historically, healthcare spending growth has trended in line with overall gross domestic product (GDP) growth during economic expansions; it follows that accelera- tion in spending in 2014 and beyond is likely, in our view, especially given incremental spending driven by the expanded health insurance coverage afforded via the ACA. Equally important, despite the recent slowdown in growth rates, healthcare expenditures continue to increase at rates greater than or equal to GDP (and off a very large base), thus consuming a greater portion of our country’s resources. Therefore, we believe there is still a signi icant amount of heavy lifting ahead—both to maintain lower per-capita health expenditures and to deliver a sustainable gap between long-term per-capita GDP growth and per-capita healthcare spending. Other novel data points also continue to demonstrate the need for long-term cost reductions in U.S. healthcare spending, especially relative to other countries. For example, a recent report by the International Federation of Health Plans showed that a day spent as an inpatient in an American hospital costs on average nearly $4,300, well above the cost in other developed countries like Aus- tralia ($1,308) or Spain ($481). Moreover, the most expensive facilities in the United States charge more than $12,700 per day for care, without any noticeable difference in the quality of care delivered (rather, these providers likely have stronger market share and thus can charge much-higher-than- average rates to payers). In a more consumer-centric environment, however, we believe these rates would face material pressure, as consumers would seek to take their business to less expensive, but equally high-quality, locations. We also believe physician-led population health providers will begin to search out this pricing (with help from their EHR vendors or other niche providers) and will start to change referral patterns to help manage cost trends. In turn, these high-cost providers will be pressured to reduce charges or they will likely begin to see market share erode over time. Similarly, data from more than 100 million U.S. claims from multiple payers in the 2013 Compara- tive Price Report (published during 2014 by the International Federation of Health Plans) indicate that a wide variety of procedures and prescription drugs in the United States cost signi icantly more than in other developed nations. For example, the average cost of prescription Celebrex in the United States was roughly $225 (and as high as $461), versus an average of roughly $115 in other countries, despite being the same product.
  • 9. 9Ryan S. Daniels, CFA +1 312 364 8418 William Blair & Company, L.L.C. Source: International Federation of Health Plans, 2013 Comparative Price Report Cost of Celebrex in the United States Consumer-Driven Healthcare Exhibit 3 $139 $225 $164 $138 $112 $112 $51 $461 $0 $50 $100 $150 $200 $250 $300 $350 $400 $450 $500 United States Spain Switzerland England Netherlands Canada USA 25th percentile Average Price USA 95th percentile Even routine surgical procedures, such as an appendectomy, cost roughly two to three times more in the United States than in other countries studied (exhibit 4). Source: International Federation of Health Plans, 2013 Comparative Price Report Exhibit 4 Consumer-Driven Healthcare Total Hospital and Physician Costs of an Appendectomy $8,244 $13,910 $5,467 $5,392 $4,782 $4,463 $4,496 $4,221 $29,499 $0 $5,000 $10,000 $15,000 $20,000 $25,000 $30,000 $35,000 United States Switzerland New Zealand Australia Netherlands Spain Argentina USA 25th percentile Average Price USA 95th percentile Given these exorbitant pricing trends, the overall cost of healthcare coverage also has increased markedlyoverthelastdecade,despitetherecentslowdowninexpenditures.Forexample,ananalysis conducted by the Kaiser Family Foundation and Health Research and Educational Trust showed that, between 2004 and 2014, the average annual premium for employee-only coverage rose 63%, to $6,025, while family premiums increased 69%, to $16,834, over the same period (exhibit 5, on page 10).
  • 10. 10 Ryan S. Daniels, CFA +1 312 364 8418 William Blair & Company, L.L.C. Exhibit 5 Consumer-Driven Healthcare Average Annual Premiums Have Risen Markedly Source: Kaiser Family Foundation / Health Research & Educational Trust, Employer Health Benefits Survey (2014) $2.2 $2.5 $2.7 $3.1 $3.4 $3.7 $4.0 $4.2 $4.5 $4.7 $4.8 $5.0 $5.4 $5.6 $5.9 $6.0$5.8 $6.4 $7.1 $8.0 $9.1 $10.0 $10.9 $11.5 $12.1 $12.7 $13.4 $13.8 $15.1 $15.7 $16.4 $16.8 $0.0 $2.0 $4.0 $6.0 $8.0 $10.0 $12.0 $14.0 $16.0 $18.0 Averageannualpremium (thousands) Single coverage Family coverage A similar study released in December 2014 by the Commonwealth Fund showed that while family premiums have increased, by their estimate, roughly 73% since 2003, the median family income has risen by only 16% over the same period. As a result, the average annual family premiums accounted for 23% of median family income, up from only 15% in 2003 and 21% in 2010. Similarly, the study showed that single coverage rose roughly 60% since 2003 versus a rise in me- dian income for a single-person household of only 11%. Thus, despite the slowdown in recent cost trends, the pressure to reduce healthcare expenses remains as acute as ever. Moreover, there has been some fanfare of late regarding the stabilization in the percentage of total premiums that employers contribute to purchase coverage. In 2013, it is estimated that employees contributed 21% of the total premiums, unchanged since 2010 andonly a modest increase from 17% in 2013. However, total premiums have grown markedly over this time frame, from $606 in 2003 (employee-only coverage) to $1,170 in 2013, marking a 93% increase in the actual employee dollar contribution to coverage premiums over the last decade. Similar results can be seen in a recent Kaiser/HRET study, which shows the cumulative increases in health insurance premiums and employee contributions to premiums versus cumulative in lation and growth in earnings. As shown in exhibit 6, the gap between earnings growth and premium con- tributed has continued to expand in the last several years, despite the recent spending slowdown, highlighting the still-urgent need to stem these cost increases.
  • 11. 11Ryan S. Daniels, CFA +1 312 364 8418 William Blair & Company, L.L.C. Exhibit 6 Consumer-Driven Healthcare Sources: Kaiser Family Foundation / Health Research & Educational Trust, Employer Health Benefits Survey (2014); and Bureau of Labor Statistics Employee Premium Contributions Have Grown Faster than Overall Premiums, Earnings, and Inflation Since 1999 72% 131% 191% 72% 127% 212% 17% 38% 54% 13% 28% 43% 0% 50% 100% 150% 200% 250% 2004 2009 2014 Cumulativechangesince1999 Health insurance premiums Workers' contriubtion to premiums Workers' earnings Overall inflation Also a result of these trends, the percentage of nonelderly Americans with health insurance through an employer also fell from 69.2% in 2000 to only 58.0% by 2013, according to our analysis of the U.S. Census Bureau’s Current Population Survey (exhibit 7), although the rate of decline has slowed somewhat in recent years. Exhibit 7 Consumer-Driven Healthcare Source: William Blair & Company, L.L.C. analysis of the Bureau of Labor Statistics’ 2013 Annual Social and Economic (ASEC) Supplement to the Current Population Survey (CPS) Proportion of Nonelderly Americans with Employer-Sponsored Insurance Is Declining 69.2% 63.4% 58.0% 75.0% 69.6% 65.8% 50.0% 55.0% 60.0% 65.0% 70.0% 75.0% 80.0% Employer-sponsored All private insurance Correcting this long-term decline in employer-sponsored health insurance (and private insurance more broadly) was one of the chief aims of the ACA, by requiring large employers to offer health insurance and offering subsidized health insurance to those unable to afford offerings in the exist- ing individual market.
  • 12. 12 Ryan S. Daniels, CFA +1 312 364 8418 William Blair & Company, L.L.C. While this may address some of the coverage issue, it does little to remedy the exorbitant costs that are, in our view, the primary driver of declining coverage to begin with. We believe it could even accelerate cost trends in future years, as the provision of health insurance has never proved to be a panacea for cost growth in the past; rather, it has driven higher utilization and costs and will likely do so again in the future. Lastly, recent data from across the United States shows that, despite an improving economic envi- ronment and lower healthcare costs trends of late, a greater percentage of adults in each state are going without care as a result of increasing costs (see below). Source: The Commonwealth Fund Exhibit 8 Consumer-Driven Healthcare More Forgoing Care Due to Cost Similarly, a December 2014 survey of more than 15,000 seniors (over age 65) from The Com- monwealth Fund showed that healthcare is still unaffordable for many individuals. More speci ic, 19% of older Americans struggled to pay for healthcare, indicating that cost was the main reason preventing them from seeing a physician or illing a prescription. Only one other nation around the globe recorded a similar double-digit response rate to this question (New Zealand, at 10%). Among U.S. seniors, the report also highlighted that 21% had out-of-pocket expenses of more than $2,000 and 11% had dif iculty paying medical bills; in other developed countries (e.g., Germany), the percentage indicating trouble paying for medical bills was only 3%. The ability for American seniors to get next-day or same-day appointments when ill fell near the bottom of all countries, yet their use of emergency rooms was near the top of the list (39% use in the last two years) and access to specialists was quite high. In a more consumer-centric market, we would hope to see all of these trends begin to reverse. So what is driving these still-exorbitant healthcare cost trends? While there are myriad an- swers to this question, if we had one word to describe our key concern it would be “incentives.” More speci ic, we believe one actual ef iciency in the healthcare marketplace is that all participants respond to the incentives given to them.
  • 13. 13Ryan S. Daniels, CFA +1 312 364 8418 William Blair & Company, L.L.C. In the past, this meant providers’ general underinvestment in understanding consumer prefer- ences and managing patient well-being, as these investment areas were somewhat counter to the fee-for-service reimbursement environment that paid the bills. And for consumers, what incentive was there to shop around (or even so much as ask questions about price) with a low-deductible health plans that sheltered individuals against the true cost of care? To this end, we found a 2014 Commonwealth Fund report card on quality improvements across the United States somewhat instructive. More speci ic, the report card indicated that outcomes have improved in a number of key areas over the last several years, including: readmission rates, patient- center care delivery, care coordination, and hospital-acquired infections. However, there was little to negative progress made on overall health conditions, such as 30-day mortality rates, access to care, and obesity. Coincidentally, the areas that showed improvement also were tied to novel incentives in the healthcare market, e.g., not paying for excess readmissions, and no payment for hospital- acquired infections. Still, in some regards, this may actually be a positive, as it shows that care and outcomes can and will be improved as provider and patient incentives change in the near future. FactorTwo:IncreasedAvailabilityofHealthcarePriceandQuality Information To control escalating costs with more consumer-centric healthcare, we believe that increased access to healthcare pricing and quality information also is needed. Without this, patients are generally unable to take a more proactive role in assessing treatment options, determining the quality of physicians, and choosing appropriate healthcare service providers and points of care—key factors in a more consumer-centric market, in our opinion. While we believe that progress continues on multiple fronts, a 2014 survey funded by the Robert Wood Johnson Foundation and conducted by the Associated Press-NORC Center for Public Affairs Research shows that gaps remain between the needs of an empowered healthcare consumer and the information currently available. More speci ic, about 48% of respondents thought it was “very easy” or “moderately easy” to ind information that compared the quality of healthcare providers, which outnumbers the roughly 25% who thought it was moderately or very dif icult to ind information. However, when asked about the ease of inding cost information, only 32% felt it easy to ind, while 38% said it was dif icult to ind. Even more troubling, only 26% reported that it is easy to ind a reliable source that compares both cost and quality data on healthcare providers side-by-side. Studies have shown that many consum- ers naturally associate higher-cost healthcare with higher-quality healthcare. Thus, being presented cost data without the accompanying quality ratings may actually lead some consumers to gravitate toward providers who charge higher prices without delivering a better outcome, in our view.
  • 14. 14 Ryan S. Daniels, CFA +1 312 364 8418 William Blair & Company, L.L.C. Sources: Associated Press-NORC Center for Public Affairs Research and Robert Wood Johnson Foundation Exhibit 9 Consumer-Driven Healthcare Only 48% Say it Is Easy to Find and Compare Quality Information on Healthcare Providers Very/moderately easy, 48% Neither easy nor difficult, 22% Very/moderately difficult, 25% Don't know, 5% Sources: Associated Press-NORC Center for Public Affairs Research and Robert Wood Johnson Foundation Exhibit 10 Consumer-Driven Healthcare Few Find it Easy to Compare Both Cost and Quality Information Together Very/moderately easy, 26% Neither easy nor difficult, 22% Very/moderately difficult, 44% Don't know, 8% In the section that follows, we provide an overview of some of the recent developments on the cost and quality transparency front, while also highlighting a number of remaining hurdles. More Providers Are Disclosing Charges Hospitals and other providers are increasingly moving toward more disclosure of cost and quality data. In part, this is due to legislation enacted by state and federal governments. For example, the Affordable Care Act called on hospitals to publicly report a list of standard charges for services rendered, and in August 2014, the Centers for Medicare and Medicaid Services (CMS) issued a regulation regarding data disclosure within the iscal 2015 Inpatient Prospective Pay- ment Systems (IPPS) inal rule. Although hospitals are now required to release a charge list to the
  • 15. 15Ryan S. Daniels, CFA +1 312 364 8418 William Blair & Company, L.L.C. public, the CMS granted considerable leeway in determining how these prices are communicated. For example, both an Internet posting of the master charge list and furnishing a list of prices upon request will satisfy the transparency requirement. In addition, in 2013 the CMS began publishing average charges by hospital and the average Medicare reimbursement rate for the 100 most common inpatient and 30 most common outpatient proce- dures. This was augmented by the release of data on Medicare payments to physicians in April 2014. Other federal initiatives, however, such as the Health Care Price Transparency Promotion Act and the Medicare Data Access and Transparency Act, have stalled in Congress. States have also enacted myriad legislation to promote price and quality transparency, but the level and quality of the data varies signi icantly by state. As it stands, there are 35 states that require hospitals to disclose some charges to the public, and a number of states are debating expanded access to this information or (for those with no disclosure) publishing such data for the irst time. Unfortunately, incremental price transparency by providers can only go so far, in our view. First, disclosing a charge itself is of limited utility to those with private insurance, as payers typically have a contractually negotiated rate at a discount to the published charge; importantly, for competitive reasons, providers are contractually forbidden from disclosing these rates. Second, any episode of care will usually involve multiple charges from different provider groups. For instance, if a patient wished to calculate the out-of-pocket costs for an upcoming hip replacement using only data from providers, this would require aggregatingcharge information from radiologists, anesthesiologists, the facility, and the surgeon (who may all work for different organizations), and then factoring in considerations like the amount remaining on his or her deductible and the size of copayments or coinsurance. Moreover, considering that a 2013 survey by Carnegie Mellon showed that only 11% of respondents were able to correctly calculate the cost of a four-day hospital stay when presented all relevant information (including cost per day, deductible, copay, co-insurance, out-of-pocket maximum), provider disclosure by itself, although de initely important, may not be enough to enable a consumer-driven revolution in healthcare. To increase price and quality transparency for entire episodes of care, we believe it is necessary to increase collaboration among all industry stakeholders. To this end, health plans increasingly are offering in-house or third-party tools to help members calculate projected out-of-pocket expenses, sometimes using real-time information. According to a survey by HealthSparq, slightly less than half (48%) of the largest health plans offer members some form of out-of-pocket cost estimator. We expect this penetration to increase in the future, in response to demand for such tools from both enrolled members and large group customers. Unfortunately, few of the tools available today allow consumers to quickly compare out-of-pocket costs across a wide set of providers.
  • 16. 16 Ryan S. Daniels, CFA +1 312 364 8418 William Blair & Company, L.L.C. Source: HealthSparq Exhibit 11 Consumer-Driven Healthcare Percentage of Insurers Offering an Out-of-Pocket Cost Estimator to Members 30% 55% 48% 0% 10% 20% 30% 40% 50% 60% Less than 250,000 members Between 250,000 and 1 million members More than 1 million members All Payers Claims Databases Another encouraging trend has been the development of all-payer claims databases (APCDs) in several states. APCDs are a statewide repository of information, to which all payers within a state contribute claims information. In our view, APCDs have a few speci ic advantages over other transparency-related initiatives. First, they allow consumers of healthcare to compare the amounts actually paid (i.e., the negotiated rate) across a broad set of payers, locations, and procedures. In addition, because data is collected directly from payers, consumers could gain insight into the cost of care for a complete episode (facility costs, diagnostics, professional fees, etc.). At present, there are 11 states that have mandated the contribution of data to APCDs, while three other states have voluntary programs. As shown in exhibit 12, however, ive additional states are now implementing APCDs and 21 have expressed a strong interest. At present, only 10 states do not have any form of ACPD in operation or under consideration. Source: APCD Council Exhibit 12 Consumer-Driven Healthcare Status of APCD Initiatives by State
  • 17. 17Ryan S. Daniels, CFA +1 312 364 8418 William Blair & Company, L.L.C. In our view, one large challenge to the development of these databases will be the incremental administrative costs for large health plans that operate in multiple states. Another challenge will be developing a user-friendly portal to access the information. For example, of the 11 states that currently aggregate data into APCDs, only a few states (Massachusetts, Maine, and Colorado) have developed a consumer-friendly website allowing consumers to easily access and interpret the col- lected cost and quality data. Of note, in the Catalyst for Payment Reform’s Report Card on State Price Transparency Laws, Massa- chusetts was one of only two states not to receive a failing mark for the state-mandated website. The Massachusetts APCD has collected data (medical claims, eligibility, dental, pharmacy, product and provider iles) since 2008 from 100 commercial sources of claims. The consumer-facing component, MyHealthCareOptions (hcqcc.hcf.state.ma.us), aggregates this data into a relatively user-friendly format. As shown in exhibit 13, a prospective patient is able to search by location, provider name, and condition or procedure. Source: Commonwealth of Massachusetts Health Care Quality and Cost Council, MyHealthCareOptions Exhibit 13 Consumer-Driven Healthcare User-Friendly Way to Utilize APCDs
  • 18. 18 Ryan S. Daniels, CFA +1 312 364 8418 William Blair & Company, L.L.C. Below, for example, we compare the cost and quality ratings of four Boston-area hospitals for a hip replacement procedure. Source: Commonwealth of Massachusetts Health Care Quality and Cost Council, MyHealthCareOptions Exhibit 14 Consumer-Driven Healthcare Side-by-Side Quality and Cost Comparison
  • 19. 19Ryan S. Daniels, CFA +1 312 364 8418 William Blair & Company, L.L.C. Source: Commonwealth of Massachusetts Health Care Quality and Cost Council, MyHealthCareOptions Exhibit 15 Consumer-Driven Healthcare Detailed Cost and Quality Metrics Wisconsin Hospital Association An example of a provider-led initiative to promote greater transparency and allow consumers to compare cost and quality metrics between hospitals for different procedures is the Wisconsin Hospital Association’s PricePoint website (www.wipricepoint.org). In the example below, we com- pared the cost of a delivery at three Green Bay area hospitals. There also are links to a companion website, CheckPoint (www.wicheckpoint.org), which allow future patients to compare measures of outcomes, patient satisfaction, and treatment quality. Again, we view developments such as the Wisconsin website as favorable, and believe the growth in HDHPs will soon force more hospitals to contribute such data going forward.
  • 20. 20 Ryan S. Daniels, CFA +1 312 364 8418 William Blair & Company, L.L.C. Source: Wisconsin PricePoint Exhibit 16 Consumer-Driven Healthcare Wisconsin PricePoint Allows Comparison of Median Charge for Care with Links to Quality Metrics Health Care Cost Institute Tool A potentially interesting development during 2015 will be the launch of a free online tool by the Health Care Cost Institute (HCCI), in collaboration with some of the largest insurers in the United States: Aetna, Humana, and UnitedHealthcare. Although little is known at this point, the partners aim to provide consumers with additional information on the price and quality of various healthcare services. Furthermore, cost data will be based on paid claims across the multiple plans. Eventually, the HCCI believes that other commercial health plans, as well as Medicare Advantage and Medicaid plans, will join the initiative. This collaboration could have several advantages over existing price and quality comparisons. First, basing a cost estimate on paid claims versus a provider charge list is, by nature, more accurate. In addition, almost all tools currently offered by health plans are available only to members and not to the broader public. If the tool is also able to incorporate information regarding a plan member’s deductible and other out-of-pocket responsibilities, we believe it could represent a powerful step forward for price and quality transparency. Therefore, we will closely monitor the rollout from the HCCI over the coming quarters. Transparency Scorecard The Catalyst for Payment Reform (CPR) recently released a scorecard, rating existing state laws and regulations regarding price and quality transparency. Although we believe that progress has been made on increasing transparency, as evidenced by the examples above, the CPR report highlights that signi icant room for improvement remains. Higher grades were awarded for states with legislation requiring the release of charge and payment data for common outpatient and inpatient services to the general public in an easy to access and understand format. In 2014, no states received an “A” rating, two received a “B,” three a “C,” and the remainder an “F.” Again, we are hopeful that legislative pressures can accelerate this transparency trend; however, we believe market dynamics are more likely to push this transparency forward at
  • 21. 21Ryan S. Daniels, CFA +1 312 364 8418 William Blair & Company, L.L.C. an even more rapid pace, as employers and consumers with more inancial responsibility begin to demand such offerings (and as creative technology vendors begin to aggregate more of this data to offer a consumer-centric healthcare comparison solution in the future). Source: Catalyst for Payment Reform Exhibit 17 Consumer-Driven Healthcare All but Five States Receive “F” for Price and Transparency Lawsy GAO Report on Healthcare Cost, Quality Data TheU.S.GovernmentAccountabilityOf ice(GAO)recentlyissuedareport(HealthCareTransparency: Actions Needed to Improve Cost and Quality Information for Consumers) that recommended further improvements to the CMS’s healthcare compare databases for nursing homes, dialysis facilities, home healthcare organizations, hospitals, and physicians. More speci ic, the GAO recommended that the CMS improve the information in its transparency tools to include items such as out-of-pocket cost estimates for treatments that can be planned in advance. We continue to believe the push from government regulatory agencies to improve cost and quality transparency in Medicare will continue to drive greater access to useful information for all consumers across the United States. The Bottom Line We believe that transparency initiatives remain at the forefront in healthcare, driven by many trends discussed in this report: an increasingly unbearable cost of healthcare, higher out-of-pocket con- sumer exposure, and the support of HCIT vendors. Moreover, key industry stakeholders continue to leverage their unique sets of data to develop innovative ways to empower patients with more information, which we believe is needed to drive the consumer revolution in healthcare. In particu- lar, as the broader industry moves away from fee-for-service pricing toward novel reimbursement methods, we believe that industry agents will increasingly collaborate in new ways that support healthcare purchasing decisions by consumers. In addition, demand is increasing for improved price transparency among large employers. A survey conducted by Deloitte, for example, found that among employers of all sizes, price transparency was rated among the top three ways to improve U.S. healthcare system performance. Again, we be- lieve these market demands will soon push greater transparency to the forefront of the healthcare experience in the United States.
  • 22. 22 Ryan S. Daniels, CFA +1 312 364 8418 William Blair & Company, L.L.C. FactorThree:GreaterUseofHCITWillEnabletheCDHCRevolution As discussed above, a prerequisite to more consumer-centric healthcare is providing individuals with more information on the quality and cost of healthcare. Moreover, it is critical to support these consumers with better care coordination and population health management—initiatives that should drive not only better outcomes but also lower costs. In years past, this was a challenging endeavor because of the lack of ef icient, accurate, and com- prehensive clinical data collection in an electronic format. In turn, sharing this information among caregivers, providers, and patients was nearly impossible. However, as a result of signi icantly in- creased government funding, as well as certain aspects of recent healthcare reform, this is rapidly changing. For example, the cumulative percentage of U.S. physicians attesting to the irst stage of meaningful use of a certi ied electronic health record (EHR) has risen from 6% at the end of 2011 to 52% as of October 2014. The story is even more promising in the inpatient setting, where the cumulative percentage of U.S. hospitals attesting to the irst stage of meaningful use has risen from 17% at the end of 2011 to 89% as of the end of October 2014. In our view, this is critically important, as we believe that EHRs are the basic infrastructure that will eventually allow sizable returns from increased data analytics, clinician behavior change, and stronger patient engagement. However, the transition from installing an EHR to realizing the above- mentioned returns will not be a linear path without challenges. In 2014, the regulatory page turned to require providers that had attested to stage 1 in 2011 or 2012 to graduate to stage 2 of the meaningful use program, which requires stricter compliance with clinician behavior change and patient engagement goals—two keys to a more consumer-centric marketplace. So far in 2014, only 8% of the physicians and 64% of the hospitals required to attest to stage 2 have met the heightened burden (exhibit 18), and more than 75% of those stage 2 attesta- tions occurred in the last two months after the CMS extended the attestation deadlines past federal iscal year-end, indicating a struggle to meet the heightened requirements. Source: Centers for Medicare and Medicaid Services Exhibit 18 Consumer-Driven Healthcare Percentage of Eligible Providers and Hospitals Attesting to Meaningful Use of EHRs 6% 26% 42% 52% 8% 17% 54% 84% 89% 64% 0% 10% 20% 30% 40% 50% 60% 70% 80% 90% 100% 2011 2012 2013 YTD 2014 Eligible Providers (Stage 1) Eligible Providers (Stage 2) Hospitals (Stage 1) Hospitals (Stage 2) While EHR adoption is at various stages depending on provider size and specialty, numerous health- care stakeholders have started to enable consumer-oriented bene its by digitizing the healthcare process. For example, on an individual basis, both payers (including the CMS) and providers are
  • 23. 23Ryan S. Daniels, CFA +1 312 364 8418 William Blair & Company, L.L.C. increasing patient access to their own health records. Moving forward, we believe there also will be a greater push not only for patient access to digital health information, but also to make the data portable for patients (i.e., not simply siloed with an individual provider) and exchangeable across the care continuum. On a larger scale, providers also are beginning to analyze terabytes of de-identi ied patient data (big data)toidentifybetterwaystomanagethehealthofpatients orbene iciaries(orentirepopulations). Over the longer term, collecting and sharing data and outcomes should help engage consumers in their own health and, in turn, reduce overall health costs. While skeptics view “population health management” as a buzzword used to sell more software products and services in a post-meaningful-use environment, we believe fee-for-value reimburse- ment arrangements have gained signi icant momentum and will fuel the need for stronger analytical solutions, such as the proliferation of readmission preventions tools discussed below, to provide higher-quality care at lower costs. Moreover, even beyond the four walls of the hospital or ambulatory clinic, providers are showing a greater proclivity to adopt technology. For example, the Epocrates 2014 Mobile Trends Report indicated that 100% of healthcare providers use computers and 80% use smartphones profession- ally. Further, the report indicated that 74% of surveyed healthcare providers expect to be “digital omnivores”—those who use a tablet, smartphone, and laptop/desktop computer routinely in a pro- fessional capacity—in 2015. Of note, that expectation is a stark reversal from the trend observed in 2014, where digital omnivores decreased from 47% of respondents in 2013 to 41% in 2014, while the number of hours spent accessing patient information at a computer increased (exhibit 19). Source: Epocrates 2014 Mobile Trends Report Exhibit 19 Consumer-Driven Healthcare More Providers Expect to Be “Digital Omnivores” in 2015 28% 47% 41% 74% 20% 30% 40% 50% 60% 70% 80% 2012 2013 2014 2015E In 2014, we believe that either a lack of full functionality on mobile devices or new regulatory requirements altering work lows caused providers to refocus on non-mobile devices. Yet, provid- ers remain optimistic that mobile device usage—and its inherent non-stop connection to relevant healthcare data—will reverse course and become the status quo in the near future. Moreover, just like with providers’ meaningful use stage 2 attestation struggles, we view the slowdown in mobile device usage as merely a speed bump, as providers bridge the gap between simple adoption of HCIT and effective use of technology. In combination with greater consumer access to their own
  • 24. 24 Ryan S. Daniels, CFA +1 312 364 8418 William Blair & Company, L.L.C. digital health information, mandated in part by the meaningful-use program and in part by market demands, healthcare is progressing toward a technological revolution that is nearly complete in every other sector. The section that follows begins with a brief recap of why we believe greater adoption of HCIT and effective use of HCIT will occur over the next several years. We then discuss why this adoption is critical to a more consumer-centric healthcare marketplace. Why HCIT Adoption Will Achieve Higher Levels of Sophistication The HITECH Act has driven greater EHR adoption. Before the enactment of the HITECH Act in February 2009, EHR adoption, while occurring at a decent pace, was hindered by two factors: 1) the perception that the cost of adoption was high, especially considering an initial negative productivity impact on physicians, and 2) the reality that there are asymmetries between the stakeholders who bear the cost of adoption (providers) and those who reap many of the bene its (payers and patients). Fortunately,theHITECHActhelpedjump-startclinicalHCITadoptionthroughtwodistinctinitiatives: 1) more than $30 billion in adoption incentives for providers that purchase and use, in a meaningful way, certi ied EHRs, and 2) eventual penalties for those providers that do not adopt and use robust systems. Below, we brie ly discuss each of these aspects. Funding incentives: In terms of incentive funds, physicians are eligible for up to $44,000 in aggregate Medicare payments, or $63,500 in aggregate incentives from Medicaid. Hospitals are also eligible for Medicare and Medicaid funding, with the level of combined payment dependent on the number of discharges a hospital has, its Medicare/Medicaid patient mix, and its level of charity care. According to PricewaterhouseCoopers, a 500-bed hospital may receive as much as $6.1 million in Medicare in- centives; we believe a similar amount could be earned from Medicaid simultaneously (assuming an equivalentMedicaidpatientvolume).Ofnote,theCMSrecentlyreportedthatroughly$25.8billion in Medicare and Medicaid incentive funds have already been paid out by the end of October 2014 (up 54% from the $16.7 billion reported at the end of October 2013). Source: Centers for Medicare and Medicaid Services Exhibit 20 Consumer-Driven Healthcare CMS Meaningful-Use Incentive Payments (Cumulative, in Billions of Dollars) $7.4 $16.7 $25.8 $0.0 $5.0 $10.0 $15.0 $20.0 $25.0 $30.0 Sep-12 Oct-13 Oct-14
  • 25. 25Ryan S. Daniels, CFA +1 312 364 8418 William Blair & Company, L.L.C. Penalties: Physicians who did not adopt EHRs by the end of 2014 are subject to a 1% reduction in Medicare reimbursement in 2015, which increases to as much as 5% by 2019. Similarly, hospitals that did not adopt EHRs by iscal 2014 are subject to a payment reduction based on their Medicare basket update in 2015. While these penalties initially seemed distant and ancillary to the in- centive payments driving purchasing decisions, we believe they are now altering provider behavior as the penalty dates are upon providers. The incentive payments will be made over a number of years as physicians and hospitals achieve each of three levels of adoption set forth by the CMS under its “meaningful use” regulations. The stages build on each other, with stage 1 focused on data capturing and sharing, stage 2 concentrating on more-advanced clinical process and patient communications, and stage 3 centered on improving outcomes. Physicians and hospitals that started the meaningful-use program in 2011 or 2012 were required to meet the stage 2 requirements in 2014, so some patients should have already begun to see the bene its of improved patient communications (e.g., patient portals and electronic com- munication) and data exchange, although fairly broad hardship exceptions were made available by the CMS that allowed many providers and hospitals to put off stage 2 for another year. Stage 2 demands stricter compliance with stage 1 requirements, including increased patient com- munication (e.g., more than 5% of patients must send secure messages to their physician and more than 5% of patients must access health information online) and electronic information exchange (e.g., care summaries must be transmitted electronically for more than 10% of transitions of care or referrals). Looking ahead to stage 3, recommendations focus on supporting new models of care that are team- based and support population health management through better clinical decision support (CDS) systems, care coordination, and transitions of care. For example, an EHR will not just place lab orders but also track when results come back. Further, for 10% of patients referred, referral results must be returned to the requestor within three business days. Lastly, patients must receive a summary of care when transferred to another care setting, including home, and, in some cases, noti ications must be sent to key members of the patient’s care team. Overall, we view the stage 2 and pending stage 3 regulations as key enablers of a more consumer-centric healthcare marketplace. Changes in the healthcare delivery system also will promote greater HCIT adoption and in- novation. In addition to the HITECH Act, the healthcare reform legislation also should promote greater HCIT adoption. As part of the reform legislation, there have been myriad reimbursement changes that move to more value-based payments, all of which reimburse providers more for the care delivered and outcomes achieved rather than the mere volume of services rendered. More speci ic, the ACA drove three new payment/reimbursement strategies for Medicare, each of which is designed to reduce costs and improve health outcomes. Two of the strategies, pay-for-per- formance (providers are paid bonuses if they achieve certain inancial and/or clinical benchmarks) and bundled or episodic payments (provider networks are paid a lump sum for all care provided across multiple care settings for a single episode of care—e.g., a hip replacement), felt like precur- sors to the third strategy, accountable care organizations (ACOs). In turn, we believe many payers and providers have been regularly skipping ahead directly to this strategy. In our view, ACOs drive a more comprehensive approach to value-based reimbursement. They enable a shared-savings model between Medicare and integrated provider networks in a tiered fashion, ranging from modest pay-for-performance bene its (no inancial risk for providers) to capitation-like per-member per-month (PMPM) payments (more inancial risk for providers but potentially higher rewards).
  • 26. 26 Ryan S. Daniels, CFA +1 312 364 8418 William Blair & Company, L.L.C. The ACO program, with its potential to enable a sustainable business model (as opposed to a discrete pilotprogram),hasdrawnthestrongestinterestfromproviders.ACOparticipationlevelsarerelatively steady, although the CMS has commented that it has seen strong interest from new organizations looking to join in 2015, while inancial and quality performance of participants has improved. More speci ic,theCMShassigneduproughly400organizationstoparticipateinitsthreeACOprograms:35 in the advance payment model ( lat year-over-year), 337 in the shared-savings program (roughly latyear-over-yearbutupfrom106attheendof2012),and19inthepioneerACOprogram(down from 23 last year, as some transitioned into the more risk-averse shared-savings program). In iscal 2014, the shared-savings program and the pioneer ACO program generated $417 million in savings for Medicare, while organizations quali ied for $460 million in bonus payments. In addition, the CMS shifts toward a more value-based reimbursement model have been adopted (in one form or another) by private insurers and health systems at a dizzying pace. The prime example of this shift comes from insurance giant UnitedHealth Group, which in 2012 stated a goal of reaching $50 billion in value-based arrangements with physicians by 2017, and a year later, it increased the goal to reach $65 billion in value-based partnerships with care providers by 2018. The company is on track toward the goal, with $36 billion in value-based arrangements in 2014 (up 38% year-over- year), or 31% of estimated premium revenue in 2014, and a projection of $43 billion in value-based arrangements in 2015 (exhibit 21). Sources: United HealthGroup and FactSet Exhibit 21 Consumer-Driven Healthcare Large Insurers Like United Healthcare Are Adopting Value-Base Reimbursement $ 26 $ 36 $ 43 24% 31% 35% $ - $ 5 $ 10 $ 15 $ 20 $ 25 $ 30 $ 35 $ 40 $ 45 $ 50 0% 10% 20% 30% 40% 50% 60% 2013 2014E 2015E UNH revenue from value-based arrangements ($ in billions) UNH value-based arrangements, as a percentage of total premium revenue Not only is momentum building for ACOs or other shared-savings models, some early returns showthatthesemodelsarereducinghealthcarecostswhileimprovingormaintainingquality of care. Perhaps the most high-pro ile example of such an agreement between a private insurer and healthcare providers is the Massachusetts Blue Cross Blue Shield Alternative Quality Contract. This model is noteworthy for two reasons: irst, all the players are in Massachusetts, where a smaller- scale version of the ACA is already in place; second, seven healthcare provider organizations have participated since 2009, meaning there is historical data to analyze. Of note, a study published in the New England Journal of Medicine by Harvard Medical School researchers demonstrated 6.8% cost savings against a benchmark in the fourth year of participation, with most savings generated by reduced prices and lower utilization in outpatient procedures, imaging, and tests, while quality of patient care exceeded the benchmark.
  • 27. 27Ryan S. Daniels, CFA +1 312 364 8418 William Blair & Company, L.L.C. We also believe changes to reimbursement models are beginning to affect provider behavior as it relates to HCIT investments. For example, the CMS published data on readmission rates indi- cating that 30-day hospital readmission rates among Medicare fee-for-service bene iciaries fell by more than 100 basis points from 2011 to 2013. This change has resulted in an estimated 150,000 fewer hospital readmissions between January 2012 and December 2013—a clear example of how outcomes and cost trends can improve when provider incentives change. Source: The Centers for Medicare and Medicaid Services Exhibit 22 Consumer-Driven Healthcare Readmission Rates Are Falling 30-Day,All-ConditionMedicareReadmission 19.0% 19.0% 19.2% 19.1% 19.0% 18.5% 17.5% 17.0% 17.5% 18.0% 18.5% 19.0% 19.5% 20.0% 2007 2008 2009 2010 2011 2012 2013 In another high-pro ile example, Advocate Physician Partners and Advocate Health in Illinois have seen costs reduced in one of the largest shared-savings model in the United States. Advocate cur- rently has 553,000 lives (both Medicare and commercial bene iciaries), or 55% of projected 2014 revenue, in value-based agreements. The organization has already seen some bene its from its technological advancements and care-coordination efforts, with total costs for commercial shared- savings contracts down 1.7% in second quarter 2013 (most recently available data), while costs stayed lat over the irst 12 months of its participation in the Medicare shared-savings program. Advocate is achieving these positive results despite being in only the early stages of a major tech- nology project to increase the sophistication of its population health management endeavors. More speci ic, Advocate is working to enhance Cerner’s Healthe Intent electronic data warehousing plat- form, predictive modeling, and clinician-facing tools that use comprehensive data and more discrete, disease-focusedalgorithms.AdvocateandCernerhavecliniciansworkingside-by-sidewithprogram- mers on predictive models, the irst two of which are completed and focus on potential readmissions and incidents of patients falling. Cerner’s readmission algorithm has performed 20% better than industry average and is now deployed at over 120 non-Advocate sites, giving those facilities a clear edge in reducing readmissions, lowering costs, and, in turn, producing shared-savings bonuses. Data warehousing, analytics, and predictive modeling such as those taken on by the Cerner/Advocate partnershiparetopprioritiesforprovidersoperatinganACOorotherpopulation-health-management– focused strategy. In addition, we believe any comprehensive value-based approach will require HCIT systems that at least to some degree: 1) combine inancial and clinical data, which requires more ro- bust systems than most in the marketplace can currently handle, and 2) improve exchange of clinical informationandcoordinationofcarebetweenproviders,bothofwhicharealsodif iculttoaccomplish with paper-based medical records.
  • 28. 28 Ryan S. Daniels, CFA +1 312 364 8418 William Blair & Company, L.L.C. We have also observed some meaningful steps taken toward both of these endeavors in the past year. Regarding tighter linkage between inancial and clinical information, we have observed continued progress from Utah-based Intermountain Healthcare integrating activity-based costing into clinical documentation with Cerner. As a not-for-pro it, integrated system with its own insurance offerings and very solid inancial footing (e.g., increasing organic revenue and operating income, and top bond ratings), Intermountain serves as a goal state for many healthcare organizations, but still strives for an improved inancial outlook to support research and development and provide a greater bene it to the communities it serves (e.g., it hopes to minimize rate increases to CPI plus 1% for insurance offerings by 2016). However, even though the system achieves top quality scores in most key areas, it still sees large local variation for many common outpatient procedures—and the organization views variation as “the enemy of cost and care.” Toward this end, Intermountain is working with Cerner to develop a “cost master” rather than a charge master. Management engineers are work- ing to identify best practices and translate the organization’s 5,000 clinical terms and 25,000 total items in the cost master into an identi iable cost per procedure. Further, much of the Cerner and Intermountain development is using open and interoperable APIs, which should allow a quicker translation of the intellectual property into non-Cerner and non-Intermountain environments. This effort acknowledges that applications deliver more value when they can be inserted into a large number of work lows, which is more easily achieved on an open, rather than proprietary, platform. Put simply, to bear more risk for outcomes and costs, we believe a robust set of HCIT applications is a prerequisite and value is more easily unlocked when these applications can interact on open platforms. In turn, we see greater adoption of these reimbursement approaches as another key catalyst for HCIT adoption (and thus more consumer-centric care delivery) over the next few years. Why Increased HCIT Adoption Will Help Spur Consumer-Driven Healthcare Once these systems are in place, we anticipate a number of positive bene its that will help drive consumer-driven healthcare (CDHC) initiatives, including the following. Improvement in collecting and reporting clinical outcomes. A key tenet of CDHC is better tracking and reporting of provider quality and cost levels, patient outcomes, and other associated informa- tion, so that consumers can make more-informed healthcare decisions. Given the limited penetration of robust EHRs in the past, this was challenging to provide and there is still a greater need for transparency in the marketplace, as discussed in the prior section. As HCIT adoption ramps up, however, collecting, reporting, and analyzing quality and cost data will be sig- ni icantly easier (and more robust than relying on claims data alone), which in turn can be shared with consumers comparing treatment options and the quality of healthcare providers. For example, the latest data published by the CMS on the Physician Quality Reporting System (PQRS) from 2012 indicates that only 36% of eligible physicians reported the quality measures necessary to earn payment incentives, although the 2012 results represented a 36% increase from 2011 par- ticipation. We believe these positive trends have continued the last two years, particularly ahead of payment penalties that will be applied to non-participants in 2015. Again, stage 2 of the meaningful-use program is pushing providers in the right direction of increased collection and reporting of clinical outcomes. For example, stage 2 requires that providers use structured data in lab results 55% of the time. Lab reports feeding data into the provider’s EHR, rather than received by fax or PDF, will reduce labor costs and allow for better data sharing and analysis, in our view.
  • 29. 29Ryan S. Daniels, CFA +1 312 364 8418 William Blair & Company, L.L.C. Sharing of data between providers also should enhance the consumer experience. Another key issue contributing to the country’s healthcare cost escalation and poor care coordination is the lack of data sharing among providers. Today, it is more common to see records relayed between provid- ers via fax or by the patient carrying documents to an appointment than it is to see full electronic transmission of records. Similarly, there is rampant waste in the system, as providers that are unable to access prior tests (like MRIs or lab work) have incentives—at least today—to simply order a new one (often getting paid for the additional tests). This not only drives unnecessary costs, but also adds inconvenience to patients (e.g., obtaining another MRI) and reduces the quality of care delivered (e.g., more radiation exposure and potential delays in obtaining necessary care). Given the previously discussed reimbursement and delivery system changes, we believe that health- care providers will soon have greater incentives to improve care coordination, foster more exchange of health information, and lower the use of unnecessary, duplicate testing. By nature, this should foster a more consumer-centric care delivery process. In recent years, the biggest shift in the HIE landscape has come from HCIT vendors. While this push is aligned with many vendors’ mission to improve healthcare, from a practical perspec- tive, we believe the technology vendor community recognizes that unlocking the long-term value (i.e., more than earning meaningful-use payments) of their systems is only possible in a more open, interoperable HCIT environment. Morespeci ic,theannouncementoftheCommonWellAllianceattheHIMSS2013conferencemarked a key step toward a more widely adopted method of exchanging key clinical information between disparate (and often competing) providers. While the organization’s goals remain modest, it rep- resents a commitment to (at least) a minimal amount of interoperability between rival vendors, and it should help establish an improved framework for secure liberation of clinical data bene iting patients. The alliance has already made some progress, moving from regional pilots to nationwide availability of limited cross-vendor interoperability (identity management, record locator, consent management, and trusted data access) between athenahealth, Cerner, CPSI, Greenway Health, and McKesson clients. More recently, several vendors including athenahealth, Cerner, Epic Systems, Meditech, McKesson, and The Advisory Board Company, along with several providers including Intermountain Health- care and the Mayo Clinic, joined forces on the “Argonaut Project,” which aims to accelerate adoption of the Fast Healthcare Interoperability Resources (FHIR), a standards framework and API, based on modern Internet-based conventions. One of the group’s goals is to play a role in the stage 3 meaningful-use regulations. In sum, while technological, operational, and inancial pitfalls remain, we see strong momen- tum for data liquidity, as more volume and more breadth of health information are exchanged among a more diverse group of stakeholders, including providers, patients, payers, and employers. Further, we believe the aforementioned stakeholders view robust health information exchange (and the ef iciencies, care coordination, and analytics that come with it) as one of the key bene its of the infrastructure created by widespread adoption of EHRs. HCIT can engage patients more actively in their own care management. As we have highlighted in past reports, there is perhaps no more ef icient labor force than consumers themselves. Today, for example, ATMs, automated check-ins for airlines, and online ticket ordering systems all afford consumers quicker and more-convenient solutions at lower costs.
  • 30. 30 Ryan S. Daniels, CFA +1 312 364 8418 William Blair & Company, L.L.C. In our view, there are many aspects of healthcare where this can also be put into place, such as check-in kiosks at hospitals and physician of ices (which are helpful for both revenue cycle manage- ment activities and labor ef iciencies), online prescription re ill requests and of ice visit scheduling (via patient portal technologies included in many practice management systems), and more active patient monitoring of their daily health through mobile devices (which can be integrated back into EHRs and personal health records). Webelievepatients’onlineaccesstohealthinformationalsoisincreasingandthisaccessispositively affecting patient health. More speci ic, the National Partnership for Women & Families recently conducted a survey that found that 50% of patients now have online access to their health infor- mation, versus only 26% in 2011. Further, the study found that those with online access are taking advantage: 86% of those with online access to their health information are using it at least once per year and 55% are using online access three or more times per year. Lastly, those frequently ac- cessing their health information online are seeing bene its: 71% of those using online access three or more times per year report that accessing the information motivates them to positively affect their health, compared with only 39% of those who access online health information less often. In the past year, strides also have been made regarding patients contributing to their own health records. For example, Allscripts FollowMyHealth Achieve allows patients to post information from consumer wireless technologies like activity trackers, weight scales, or blood pressure monitors to their electronic health record available through a patient portal. In turn, providers can then moni- tor patients’ compliance with care plans and initiate interventions to in luence behavior and affect outcomes. Moreover, athenahealth recently reported that patient portal adoption has increased markedly from the prior-year period, with more than 3.6 million patients registered as of third quarter 2014—up more than 71% year-over-year. We believe that enabling this type of frequent, consumer-friendly clinical contact will increase patient engagement and increase the likelihood of in luencing patients’ lifestyle changes. A recent study from EBRI also highlighted how technology is becoming a more important aspect of healthcare consumers’ daily lives. For example, the study indicated that more than three-fourths of the adult population with private health insurance used a smartphone, while 58% used a tablet. Among these plan members, 20% to 29% used an app for nutrition management, 20% to 27% used an app for general health information, and 15% to 26% used an app for weight management. Moreover, among those who have never used an app for health-related reasons, up to 50% indi- cated an interest in using one for health-related purposes (weight management, exercise, nutrition, etc.) or to obtain information on drug prices, medical history, or other general health information. Moreover, for individuals with HSAs and HRAs, more than 50% desired an app to check the balance of their accounts. Overall, we believe that we are on the cusp of an in lection point of HCIT increasing consumer engagement because of providers’ heightened focus on patient portal activity (thanks in part to heightened requirements in stage 2 of meaningful use), proven returns for payers (and, in turn, providers involved in shared-savings models) for increasing patient access to their records and care management tools, and the in lux of mobile technologies now at consumers’ ingertips. HCIT adoption will assist in reducing overall healthcare costs. The inal area where we see a tie between HCIT and CDHC is in the common goal of reducing healthcare costs for consumers. Consumer-driven healthcare is centered on inding higher-quality care at lower price points, and we believe that increased HCIT adoption will foster both of these objectives. HCIT will unquestionably facilitate a consumer’s ability to judge providers against each other from an outcomes and cost per- spective; moreover, it should help lower the overall cost curve, bene iting all consumers. Technolo- gies like clinical decision support and patient registries also should promote higher quality-of-care
  • 31. 31Ryan S. Daniels, CFA +1 312 364 8418 William Blair & Company, L.L.C. standards, population health management, and more rapid deployment of clinical best practices. As big data continues to proliferate the healthcare market, we believe hundreds of billions of dollars can be saved by more effectively identifying and illing gaps in care. Lastly, we view telehealth as a prime example of using technology to promote high-quality care at lower costs. A recent study by Red Quill Consulting found that the average cost of a telehealth visit for a commercially insured patient is $40 to $50, compared with the average estimated cost of $136 to $176 for in-person care (probability weighted between emergency room, urgent care, physician of ice visits, and doing nothing). The study also pushed back on the notion that increased telehealth prevalence will drive costs up through more frequent utilization, as more than 80% of patients used telehealth services only one time per year. Lastly, we believe the study shows that telehealth was the appropriate venue for care with the most common diagnoses being for sinusitis, cold, and lu and the patient’s issue was reported as resolved 83% of the time. In our view, this presents an outstanding example of the intersection of consumer-centric technology and a stronger consumer value proposition positioning a subsector for explosive growth over the coming years. The Bottom Line Webelievenumerousgovernmentalandprivate-marketinitiativeshaveincreasedthebasicadoption of HCIT and that a further in lection point in the usefulness of these now-digitized work lows is on the horizon. This transformation will be instrumental for CDHC initiatives to broadly take hold, as full electronic record use will facilitate greater sharing of clinical and cost data, allowing patients to make more-informed choices, as well as enabling the implementation of the population health management initiatives needed to reduce waste and lower costs. Factor Four: More Financial and Quality Responsibility Borne by Healthcare Consumers Our fourth tenet of consumer-centric healthcare is that most consumers will make better healthcare decisions and healthier lifestyle choices when their money is on the line. As discussed earlier, a key driver of this change is the large increase in high-deductible health plans across the United States. According to the Centers for Disease Control and Prevention (CDC), the number of nonelderly (under the age of 65) Americans with a high-deductible health plan (HDHP) or a consumer-driven health plan (a high-deductible plan with a health savings account) has risen steadily over recent years. In 2009 about 22.5 million persons were covered under some form of HDHP; this number rose by 60% through the beginning of 2014, to 36.0 million.
  • 32. 32 Ryan S. Daniels, CFA +1 312 364 8418 William Blair & Company, L.L.C. Source: CDC/NCHS National Health Interview Survey Exhibit 23 Consumer-Driven Healthcare Percentage of Nonelderly Population Enrolled in HDHPs 16% 18% 20% 20% 22% 24% 7% 8% 9% 11% 12% 12% 0% 5% 10% 15% 20% 25% 30% 35% 40% 2009 2010 2011 2012 2013 2014 Consumer-driven health plan (high-deductible plan with a health savings account) High-deductible health plan As discussed earlier, we believe this places signi icantly more inancial responsibility for healthcare consumption on consumers themselves, which is a key element pushing consumer-centric health- care into the mainstream. Consumers Are Bearing a Larger Share of Medical Cost Although the slowdown in total healthcare spending growth since the recession has been widely reported, this trend has gone unnoticed by the majority of consumers, whose healthcare costs have continued to increase at a higher rate than overall healthcare spending. According to the Health Cost Institute, total healthcare spending on those with employer-sponsored insurance rose 3.9% in 2013, a slight acceleration from 3.5% in 2012 and equal with 3.9% in 2011. Out-of-pocket expenditures by those with employer-sponsored insurance rose at a slightly faster rate, however, increasing by 4.0% in 2013, although this was a deceleration from an increase of 4.8% in 2012 and 4.6% in 2011. The slowdown in out-of-pocket spending in 2013 was largely driven by lower generic (down 0.6%) and brand name (down 10.2%) prescription spending, as well as lat per capita spending for young adult women (ages 19 to 25). The slowdown in out-of-pocket spending among young adult women, in particular, may re lect the impact of ACA mandates, like contraceptive coverage for adults. Over the three years examined, we believe that faster growth in out-of-pocket spending was almost entirely due to the already mentioned cost-shifting from employers and insurance companies to consumers, and the movement of employees into HDHPs. Below, we discuss the movement of em- ployees into HDHPs in greater detail. Each year, the Kaiser Family Foundation and the Health Research and Educational Trust (HRET) pub- lish an extensive survey of the employer-sponsored insurance market. The 2014 edition con irmed that the trend of increasing employee responsibility for healthcare costs, which we have highlighted since publishing the irst edition of Consumer-Centric Healthcare in 2005, continues apace.
  • 33. 33Ryan S. Daniels, CFA +1 312 364 8418 William Blair & Company, L.L.C. Of note, the percentage of covered workers who enroll in HDHPs has increased markedly over recent years, while plan structures like HMOs and PPOs have had their market share shrink. In 2014, for example, roughly 20% of employer-sponsored bene iciaries were enrolled in HDHPs, signi icantly above the 4% mix in 2006 (exhibit 24). Exhibit 24 Consumer-Driven Healthcare Distribution of Health Plan Enrollment for Covered Workers, by Plan Type Source: Kaiser Family Foundation / Health Research & Educational Trust, Employer Health Benefits Survey (2014) <1% <1% <1% 1% 1% 1% 2% 3% 3% 3% 5% 5% 4% 7% 8% 10% 27% 46% 73% 13% 14% 16% 17% 19% 20% 20% 21% 20% 21% 25% 24% 27% 24% 29% 28% 31% 21% 16% 58% 57% 56% 55% 58% 60% 58% 57% 60% 61% 55% 54% 52% 46% 42% 39% 28% 26% 11% 8% 9% 9% 10% 8% 10% 12% 13% 13% 15% 15% 17% 18% 23% 21% 24% 14% 7% 20% 20% 19% 17% 13% 8% 8% 5% 4% 0% 20% 40% 60% 80% 100% 2014 2013 2012 2011 2010 2009 2008 2007 2006 2005 2004 2003 2002 2001 2000 1999 1996 1993 1988 Conventional HMO PPO POS HDHP/SO In our view, one of the drivers of the shift toward HDHPs (which typically have lower premiums) has been an increase in the portion of the monthly premium borne by employees. The mix of workers who make no contribution to their premium for single coverage has decreased from 24% in 2002 to 14% in 2014, while the proportion of workers who pay between 25% and 50% of their premium has increased from 13% in 2002 to 27% in 2013. A similar trend can be observed in exhibit 26, on page 35, for family coverage: in 2002, 9% of workers made no contribution to the premium, which fell to only 5% in 2014.
  • 34. 34 Ryan S. Daniels, CFA +1 312 364 8418 William Blair & Company, L.L.C. Source: Kaiser Family Foundation / Health Research & Educational Trust, Employer Health Benefits Survey (2014) Exhibit 25 Consumer-Driven Healthcare Distribution of Portion of Premium Paid by Workers for Single Coverage 14% 14% 16% 16% 16% 18% 20% 20% 23% 21% 21% 24% 24% 57% 62% 61% 59% 56% 58% 59% 56% 56% 57% 56% 57% 58% 27% 22% 22% 22% 24% 22% 19% 21% 18% 19% 21% 17% 13% 2% 2% 2% 3% 4% 1% 2% 2% 2% 3% 2% 3% 5% 0% 20% 40% 60% 80% 100% 2014 2013 2012 2011 2010 2009 2008 2007 2006 2005 2004 2003 2002 0% Greater than 0%, less than or equal to 25% Greater than 25%, less than or equal to 50% Greater than 50%
  • 35. 35Ryan S. Daniels, CFA +1 312 364 8418 William Blair & Company, L.L.C. Source: Kaiser Family Foundation / Health Research & Educational Trust, Employer Health Benefits Survey (2014) Exhibit 26 Consumer-Driven Healthcare Distribution of Portion of Premium Paid by Workers for Family Coverage 5% 5% 6% 6% 5% 6% 7% 6% 9% 9% 7% 8% 9% 42% 42% 43% 47% 43% 48% 46% 47% 42% 46% 44% 47% 46% 38% 38% 37% 32% 35% 33% 33% 31% 37% 32% 36% 31% 29% 15% 14% 14% 15% 16% 12% 14% 15% 12% 13% 13% 14% 16% 0% 20% 40% 60% 80% 100% 2014 2013 2012 2011 2010 2009 2008 2007 2006 2005 2004 2003 2002 0% Greater than 0%, less than or equal to 25% Greater than 25%, less than or equal to 50% Greater than 50% In addition, as shown in exhibit 27, the average worker contribution to premiums for single cover- age rose 8.2% in 2014—well above any of the underlying trends in overall spending growth, and the second highest increase in the last seven years. Exhibit 27 Consumer-Driven Healthcare Average Annual Contribution to Premiums for Single Coverage Source: Kaiser Family Foundation / Health Research & Educational Trust, Employer Health Benefits Survey (2014) $610 $627 $694 $721 $779 $899 $921 $951 $999 $1,081 $3,413 $3,615 $3,785 $3,983 $4,045 $4,150 $4,508 $4,664 $4,885 $4,994$4,023 $4,242 $4,479 $4,704 $4,824 $5,049 $5,429 $5,615 $5,884 $6,075 $0 $1,000 $2,000 $3,000 $4,000 $5,000 $6,000 $7,000 2005 2006 2007 2008 2009 2010 2011 2012 2013 2014 Worker contribution Employer contribution Total premium
  • 36. 36 Ryan S. Daniels, CFA +1 312 364 8418 William Blair & Company, L.L.C. Also of note, the average PPO premium for single coverage in 2014 was $6,217, of which the worker contributed $1,134; however, by switching to an HDHP, an employee can lower his or her monthly premium contribution by about 20%, on average. In part, we believe this explains the nearly 47% rise in the average employee PPO deductible since 2009, to $1,217. Moreover, as private exchanges and de ined-contribution plans for healthcare continue to gain momentum, we believe the shift toward high-deductible plans will only accelerate further in the coming years. We also believe the trend toward HDHPs is set to accelerate further in 2015, as increasingly more employers have selected such an offering as their only plan choice. For example, according to a recent study by the National Business Group on Health, which included 136 large companies that, com- bined, employ more than 7.5 million workers, 81% of employers (up from just over 50% in 2010) now offer an HDHP as a plan choice and roughly one-third of them will offer only an HDHP in 2015 (up from only 22% in 2014 and 10% in 2010). Inconjunctionwiththeearlier-discusseddevelopmentsonthepriceandqualitytransparencyfronts, this increasing exposure to healthcare costs will provide consumers with a much greater incentive to manage their healthcare expenditures. For example, even under a traditional plan structure, annual deductibles have risen to a point that encourages consumerism for basic medical services. As mentioned in the introduction of this report, the average annual deductible for a single-coverage PPO plan was $843 in 2014, which is well above the amount for most basic medical services like a primary care visit or a specialist visit. Even more important, the average annual deductible for a single-coverage HDHP was $2,215 in 2014—meaning that the consumer will be responsible for (and thus incentivized to compare costs) a wide variety of non-emergent care in a given year (exhibit 28). Source: Kaiser Family Foundation; Healthcare Blue Book; Health Care Advisory Board Exhibit 28 Consumer-Driven Healthcare Many Routine Services Fall Within Average Annual Deductibles $150 $275 $400 $900 $1,000 $2,000 $6,000 $0 $1,000 $2,000 $3,000 $4,000 $5,000 $6,000 $7,000 Primary care visit Specialist visit Ultrasound MRI Endoscopy Cataract Surgery Renal failure admission Fall within HDHP deductible ($2,215) Fall within PPO deductible ($843) In our view, the rise of plan structures that require bene iciaries to shoulder a larger proportion of healthcare costs, although sometimes not greeted enthusiastically by consumers, ultimately makes patients a larger stakeholder in healthcare purchasing decisions, thereby creating incentives to seek quality care at a lower cost.
  • 37. 37Ryan S. Daniels, CFA +1 312 364 8418 William Blair & Company, L.L.C. Factor Five: Health Insurers, Employers, and Consumers Are Embracing Consumerism Throughout 2014, we continued to see evidence that insurers, employers, and payers are embracing consumerism, largely through the abovementioned use of account-based health plans such as health savings accounts (HSAs) and health reimbursement accounts (HRAs). Equally important, data that validates the overall cost ef icacy and improved outcomes associated with such initiatives continue to be published. In turn, we expect this trend will continue to gain momentum over the coming years. In addition to these account-based plans, there also continues to be traction in de ined-contribution plans, where employers provide their workforce with a ixed dollar amount for healthcare cover- age and ask the employees to choose from a wide variety of coverage options (including HDHPs) made available through private insurance exchanges. As discussed earlier in our report, this has the potential to dramatically affect the healthcare landscape, as consumers will begin to shop for coverage (and thus see a wide variety of cost differences between various health plans) based on their individual (or family’s) healthcare needs. In the past, the overwhelming majority of employees had almost no lexibility in purchasing health insurance coverage—as they were limited to the two to three health plan options their employer offered. Moreover, given the lack of plan changes year to year, inertia became a driving force behind many employees’ decisions simply to re-enroll in the same coverage year after year (which helped further distance consumers from healthcare cost realities). In the future environment, however, switching costs will be extremely low, and individuals will be afforded the opportunity to change health plans from year to year without the need for an employer to overhaul its entire bene it design. We expect this trend will also drive providers into a more consumer-centric mindset, as they will need to work to lower costs and compete on price to remain in increasingly narrow health plan networks. In this vein, there is a strong argument to be made to invest in population health management and consumer-centeredcaremodels,evenoutsideanaccountablecare(orshared-savings)environment. More speci ic, with more of a retail insurance environment, payers will face signi icant pressure to provide the lowest-cost health plans for buyers (again, who will now have a variety of options avail- able to them to choose from). To maintain their margins, these payers will look for the lowest-cost, highest-quality providers to partner with. In turn, the “retailization” of the insurance market will yield another reason for healthcare providers to try to reduce their cost structure to gain market share. Thus, the incentive to invest in population health and consumer-centric solutions remains robust even without entering an ACO model—a realization that we believe is starting to permeate the provider market for the irst time as we exit 2014. Below, we provide several data points regarding the traction that consumer-centric health plans (including momentum behind reference-based pricing—another key trend we highlighted in our CDHC reports several years ago) have gained in the marketplace in 2014. Kaiser/HRET Annual Employee Bene it Survey Points to Several Consumer-Centric Trends. A 2014 Kaiser/HRET study on employee bene its highlighted several important trends that dem- onstrate employers’ increased willingness to push additional healthcare inancial responsibility onto consumers. For example, roughly 13% of large employers (more than 200 employees) now consider offering health bene its through a private exchange, with the largest employers (those with more than 5,000 employers) even more likely to do so, at 20%. Similarly, when asked which health bene it strate- gies are most effective to contain healthcare costs, roughly half of all employers referenced higher
  • 38. 38 Ryan S. Daniels, CFA +1 312 364 8418 William Blair & Company, L.L.C. employee cost sharing, while nearly 70% highlighted consumer-driven health plans. Of note, these initiatives—along with wellness plans (which engage consumers in managing their health more actively)—were the strategies recognized as most effective by irms in the survey (exhibit 29). Exhibit 29 Consumer-Driven Healthcare Employers Believe CDHPs Are Effective Source: Kaiser Family Foundation / Health Research & Educational Trust, Employer Health Benefits Survey (2014) 71% 53% 69% 47% 69% 54% 33% 27% 41% 26% 46% 25% 35% 62% Wellness programs Managed care restrictions CDHPs Cost sharing Disease management Tiered networks Narrow networks Very/somewhat effective Not too/at all effective Annual Cigna Study Demonstrates Bene its of Consumer-Centric Plans. Cigna recently released its Eighth Annual Cigna Choice Fund Experience Study, which compares the actual claims experience of more than 3.6 million Cigna members who are enrolled in consumer-driven health plans, PPOs, and traditional HMOs. Some of the key conclusions include: • Members in consumer-centric plans were 50% more likely to complete a health risk assess- ment (HRA), and those with chronic illness were up to 41% more likely to participate in disease management programs. • Members in consumer-centric plans were much more likely to use consumer-centric technology applications. For example, 75% of these plan members registered for the myCigna.com personal health portal and/or mobile app and they were 82% more likely to use tools to manage their health and look up quality of care and cost information on providers. • Consumer-centric plan members were more likely to adhere to recommended levels of care, with equal or higher compliance rates on roughly 500 evidence-based medical best practices. • Total cost trends were 12% lower for consumer-centric plan participants, with cumulative ive-year savings per member of $7,900. • Lastly, members of consumer-centric plans were much more likely to choose generic drug op- tions and showed a 5% lower utilization rate at emergency rooms. EmployeeBene itResearchInstituteStudyShowsMyriadImpactsofMoreConsumer-Centricity inHealthcare.Similar to the abovementioned Cigna study, the Employee Bene it Research Institute (EBRI) released a study in mid-2014 (based on 2013 data) that demonstrated marked differences between the behaviors of individuals in consumer-centric healthcare plans and other insurance types. More speci ic, plan members with health savings accounts and high-deductible plans were