6 8
•
0 likes•150 views


Recommended
More Related Content
Similar to 6 8
Similar to 6 8 (20)
More from INTERNATIONAL INDEXED,REFERRED,MULTILINGUAL,INTERDISCIPLINARY, MONTHLY RESEARCH JOURNAL
More from INTERNATIONAL INDEXED,REFERRED,MULTILINGUAL,INTERDISCIPLINARY, MONTHLY RESEARCH JOURNAL (20)
Recently uploaded
Recently uploaded (20)
6 8
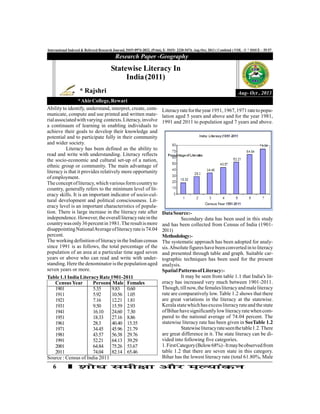
- 1. 6 International Indexed & Refereed Research Journal, ISSN 0974-2832, (Print), E- ISSN- 2320-5474, Aug-Oct, 2013 ( Combind ) VOL –V * ISSUE – 55-57 Ability to identify, understand, interpret, create, com- municate, compute and use printed and written mate- rialassociatedwithvarying contexts.Literacy,involve a continuum of learning in enabling individuals to achieve their goals to develop their knowledge and potential and to participate fully in their community and wider society. Literacy has been defined as the ability to read and write with understanding. Literacy reflects the socio-economic and cultural set-up of a nation, ethnic group or community. The main advantage of literacy is that it provides relatively more opportunity of employment. The concept ofliteracy,which various formcountryto country, generally refers to the minimum level of lit- eracy skills. It is an important indicator of socio-cul- tural development and political consciousness. Lit- eracy level is an important characteristics of popula- tion. There is large increase in the literacy rate after independence.However,theoverallliteracyrateinthe countrywasonly36percentin1981.Theresultismore disappointingNationalAverageofliteracyrateis74.04 percent. The working definition ofliteracyinthe Indian census since 1991 is as follows, the total percentage of the population of an area at a particular time aged seven years or above who can read and write with under- standing. Here the denominator isthe population aged seven years or more. Research Paper -Geography Aug- Oct , 2013 Statewise Literacy In India(2011) * Rajshri *AhirCollege,Rewari Literacyratefortheyear1951,1967,1971ratetopopu- lation aged 5 years and above and for the year 1981, 1991 and 2011 to population aged 7 years and above. Table1.1India LiteracyRate1901-2011 Census Year Persons Male Females 1901 5.35 9.83 0.60 1911 5.92 10.56 1.05 1921 7.16 12.21 1.81 1931 9.50 15.59 2.93 1941 16.10 24.60 7.30 1951 18.33 27.16 8.86 1961 28.3 40.40 15.35 1971 34.45 45.96 21.79 1981 43.57 56.38 29.76 1991 52.21 64.13 39.29 2001 64.84 75.26 53.67 2011 74.04 82.14 65.46 Source : Census of India 2011 DataSource:- Secondary data has been used in this study and has been collected from Census of India (1901- 2011) Methodology:- The systematic approach has been adopted for analy- sis.Absolute figures havebeenconverted in to literacy and presented through table and graph. Suitable car- tographic techniques has been used for the present analysis. SpatialPatternsofLiteracy:- It may be seen from table 1.1 that India's lit- eracy has increased very much between 1901-2011. Though,tillnow,thefemalesliteracyandmaleliteracy rate are comparatively low. Table 1.2 shows that there are great variations in the literacy at the statewise. Keralastatewhichhasexcessliteracyrateand thestate ofBiharhavesignificantlylowliteracyratewhencom- pared to the national average of 74.04 percent. The statewise literacy rate has been given in SeeTable 1.2 Statewiseliteracyrateseenthetable1.2.There are great difference in it. The state literacy can be di- vided into following five categories. 1.FirstCategory(Below68%)-Itmaybeobservedfrom table 1.2 that there are seven state in this category. Bihar has the lowest literacy rate (total 61.80%, Male
- 2. 7SHODH, SAMIKSHA AUR MULYANKAN International Indexed & Refereed Research Journal, ISSN 0974-2832, (Print), E- ISSN- 2320-5474, Aug-Oct, 2013 ( Combind ) VOL –V * ISSUE – 55-57 Table 1.2 Statewise Literacy Rate according to Census 2011 S.No. State Literacy Male Female % Change India 74.04 82.14 65.46 8.66 1 Kerala 94.00 96.11 100.76 3.14 2 Lakshadweep 91.85 95.56 86.29 5.19 3 Mizram 91.33 93.35 86.72 2.53 4 Goa 88.70 92.60 82.16 6.69 5 Tripura 87.22 91.53 78.98 14.03 6 Himachal Pradesh 82.80 89.53 73.51 6.32 7 Maharashtra 82.34 88.38 69.87 5.46 8 Sikkim 81.42 86.55 66.39 12.61 9 Tamil Nadu 80.09 86.77 73.14 6.64 10 Nagaland 79.55 82.75 70.01 12.96 11 Manipur 79.21 86.06 71.73 8.68 12 Uttarakahdn 78.82 87.40 67.06 7.20 13 Gujarat 78.03 85.75 63.31 8.89 14 West Bengal 76.26 81.69 66.57 7.62 15 Punjab 75.84 80.44 62.52 6.19 16 Haryana 75.55 84.06 56.91 7.64 17 Karnataka 75.36 82.47 66.01 8.72 18 Meghalaya 74.43 75.95 71.88 11.87 19 Orissa 72.87 81.59 62.46 9.79 20 Assam 72.19 77.85 63.00 8.94 21 Chhattisgarh 70.28 80.27 59.58 5.62 22 Madhya Pradesh 69.32 78.73 54.49 5.58 23 Uttar Pradesh 67.68 77.28 51.36 11.41 24 Jammu and Kashmir 67.16 76.75 49.12 11.64 25 Andhra Pradesh 67.02 74.88 58.68 6.55 26 Jharkhand 66.41 76.84 52.04 12.85 27 Rajasthan 66.11 79.19 47.76 5.70 28 Arunachal Pradesh 65.38 72.55 53.52 11.04 29 Bihar 61.80 71.20 46.40 14.80 Source : Census of India 2011 71.20%,Female46.40%),ArunachalPradesh(65.38%), Rajasthan (66.11%), Jharkhand (66.41%), Andhra Pradesh(67.02%),JammuandKashmir(67.16%),Uttar Pradesh(67.68%),BiharwastheonlyremainingIndian intheyear2011 censuswherethemajorityofthepopu- lation (38%) was illiterate. Even in Bihar however the literacyrateisrisingfrom43.53%in2001to61.80%in 2011. The Government ofBihar launched several pro- gram to boost literacy and its department of adult edu- cation even won a UNESC award in 1981. 2. Second Category (68-73%) - In this category the literacy rate varies between 68-73%. There are four state in this category.There are average ofliteracyrate inMadhyaPradesh(total69.32%,Male78.73%,Female 54.49%),Chhattisgarh(70.28%),Assam(72.19%),Orissa (72.87%). 3. Third Category(73-78%) - It may be observed from the table 1.2 that there are five state in this category. In thiscategoryliteracyratevariesbetween73-78%.There areaverageofliteracyratesinMeghalaya(total74.73%, Male 75.95%, Female 71.88%), Karnataka 75.36%, Haryana75.55%,Punjab75.55%,WestBengal79.55%. National Average of literacy rate is belong in this cat- egory. StateWise Literacy(2011) 4.FourthCategory(78-83%)-Inthiscategoryliteracy rate varies between 78-83%. There are average of lit- eracyrateisinGujarat(78.03%),Uttarakhand(78.82%), Manipur (79.21%), Nagaland (79.55%), Tamil Nadu (80.09%), Sikkim (81.42%), Maharashtra (82.34%), Himachal Pradesh (82.80%), Tamil Nadu took an ap- proach to promoting literacy based on free lunches for school children. Tamil Nadu literacy rate rose from 73.4%in2001to80.09%in2011.In2001theSupreme CourtofIndiainstructedallStateGovernmenttoimple- mentation has been patchy due to corruption and so- cial issues. 5.FifthCategory(Above80%)-Itmaybeseenfromthe table 1.2 that Kerala is the most literate state in India with 94.00%)literacy.TheGovernmentofKeralathen replicatedtheinitiativeonastatewidelevel,launching the Kerala literacy campaign. Followed closely by Mizoram (91.33%) Mizoram literacy rate rose rapidly after independence from31.14%in1951to91.33%in2011.AsinHimachal Pradesh, Mizoram has a social structure that is rela- tively free of hierarchy and strong official intent to produce total literacy. Other state in the category Goa (88.70%)andTripura(87.22%) SeeTable1.3 Itmaybeseenfromthetable1.3thatthereare a few states at the top. Most state are just below or above the national average.
- 3. 8 International Indexed & Refereed Research Journal, ISSN 0974-2832, (Print), E- ISSN- 2320-5474, Aug-Oct, 2013 ( Combind ) VOL –V * ISSUE – 55-57 Reasonsforlowliteracyrate:- 1. Theabsence ofadequateschool infrastructurelike improper facilities and inefficient teaching staff is one of the main factors affecting literacy in India. 2. Thelargeproportionofilliteratefemalesinanother reason for the lowliteracy rate in India. Inequality based on gender difference resulted in female lit eracy rates being lower of 74.43%. 3. Absolute poverty in India has also deterred the pursuit of formal education as education is not deemed of as the highest priority among the poor as compared to other basic necessities. List of steps taken by Government of India to im prove literacy rate in India:- 1. Free education program to poor people living in villages and towns. 2. Setting up of new school and college at district and state level. 3. Several committees have been formed to en 1. Husain Majid (2008) Geography of India, Jamia Millia University, New Delhi. 2. Govt. of India, Census of India, 1991 to 2001. 3. Govt. of India (1973), The Tribunal People of India, Ministry of Information and Broadcasting. 4. Chandna R.C. (2002), Geography of Population, Kalyani Publisher, Ludhiana. 5. Tiwari, R.C. (2006), Geography of India, Allahabad, Prayag Pustak Bhawan. 6. Unesco Literacy, Unesco. 7. Jayant Pandurang Nayaka Syed Nuruallah (1974), A Students History of Education in India, 1802-1973 Macmillian. 8. Ranjit Tirtha (2002), Geography of India, Rawat Publications, Jaipur and New Delhi. sure proper utilization of funds allotted to improveliteracyrate. Conclusion:- In this research paper, it is observed that - Kerala is the most literate state in India with 94.00% literacy.FollowedcloselybyMizoramat91.33%.Bihar was the onlyremaining Indian state in the 2011 census wherethe majorityofthe population(38%) wasilliter- ate.Everycensussince1881hadindicated risinginthe country, but the population growth rate had been high enoughthattheabsolutenumberofilliteratesrosewith every decade. The 2001-2011 decade is the second censusperiod(afterthe1991-2001censusperiod)when the absolute number of Indian illiterates declined (be 31,196,847 people) indicating that the literacy growth rate is now outstripping the population growth rate. Largevariationinliteracyexistevenbetween contiguous states. While there are a few states at the top and bottom. Table1.3 LiteracyRateinIndia 2011 R E F E R E N C E Sr. No. Percent of Literacy Rate according to census of 2011 Name of States No. of States 1 First Category below 68% Bihar, Arunachal Pradesh, Rajasthan, Jharkhand, Andhra Pradesh, Jammu and Kashmir, Uttar Pradesh 7 2 Second Category 68-73% Madhya Pradesh, Assam, Chhattisgarh, Orissa 4 3 Third Category 73-78% Megalaya, Karnataka, Haryana, Punjab, West Bengal 5 4 Fourth Category 78-83% Gujarat, Uttarakhand, Sikkim, Maharahstra, Himachal Pradesh, Tamil Nadu, Manipur, Nagaland 8 5 Fifth Category Above 83% Kerala, Mizoram, Goa, Tripura 4