1. A monthly report produced for Commerce Real Estate Solutions by Stephen P. A. Brown, PhD, Center for Business & Economic Research University of Nevada, Las Vegas
Issue 19 july 2012
To receive this newsletter by e-mail,
please subscribe at
www.comre.com/subscribe
fiscal cliff raises fears of u.s. recession
In late 2012, U.S. policymakers will be faced with making controversial decisions about the nation’s
fiscal policies. As current law stands, the U.S. government will implement a number of tax increases
and spending cuts beginning in 2013. Because implementation of current law results in an abrupt
change in government spending and taxation policy, the current laws are seen as creating what is
known as a “fiscal cliff.” According to many analysts, plunging over the fiscal cliff is likely to push
an already weak U.S. economy back into recession.
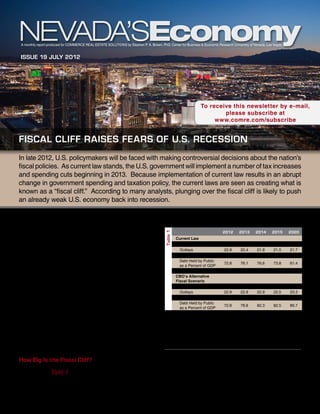
On the other hand, postponing or cancelling Projected U.S. Government Deficits as a Percent of GDP
implementation of current laws will leave the U.S.
Table 1
2012 2013 2014 2015 2020
government with a large deficit and a growing debt. Current Law
A failure to reduce the deficit to a sufficiently small Revenues 15.7 18.4 19.6 20.3 21.1
Outlays 22.9 22.4 21.9 21.5 21.7
percentage of the nation’s gross domestic product Deficit -7.3 -4 -2.4 -1.2 -0.6
(GDP) will lead to a growing debt-to-GDP ratio. Debt Held by Public
72.8 76.1 76.6 73.8 61.4
as a Percent of GDP
Over time, a high debt-to-GDP ratio will weaken the
long-term prospects for economic growth. CBO’s Alternative
Fiscal Scenario
In what follows, we examine the size of the fiscal cliff Revenues 15.7 16.3 17.2 17.8 18.5
Outlays 22.9 22.8 22.9 22.5 23.3
and assess its effects on U.S. economic activity. Our Deficit -7.3 -6.5 -5.6 -4.6 -4.8
assessment suggests that policymakers can reduce Debt Held by Public
72.8 78.6 82.3 82.5 85.7
as a Percent of GDP
the near-term risk of recession and gain most of the
Source: Congressional Budget Office
benefits of reducing the U.S. government debt-to-
GDP ratio by taking a gradualist policy. Under such a by the current tax laws are the expiration of provisions
policy, the U.S. government would gradually bring its that reduce income, estate and gift taxes (commonly
budget deficit as a percent of GDP below the growth known as Bush-era tax cuts). In addition, the reduction
rate of U.S. economic activity.
How Big Is the Fiscal Cliff? This report is commissioned by
Commerce Real Estate Solutions
As shown in Table 1, current law will bring big changes info@comre.com • 801-322-2000
to both U.S. government taxation and spending policies
beginning in 2013. Some of the changes brought about
2. nevada’s Economy july 2012
in the employee’s portion of the payroll tax will expire. GDP will be higher than the growth rate of U.S. GDP.
The Affordable Care Act also will bring tax increases. Consequently, the debt-to-GDP ratio will grow. In
Among the changes to spending policies are sharp countries with high debt-to-GDP ratios, economic
reductions in Medicare payment rates for physicians’ activity is strangled by high interest rates and a lack of
services and the expiration of some unemployment investment. Reducing deficit spending contributes to
benefits. The automatic enforcement procedures a higher trajectory of economic growth by avoiding the
established under the Budget Control Act of 2011 problems associated with a high debt-to-GDP ratio.
also will cut spending across a number of programs What Are the Implications for Near-Term
including defense. Economic Growth?
Together the changes in fiscal policy brought about by Unfortunately, an abrupt resolution of the budget
current law will sharply reduce the U.S. government deficit also removes what many see as a short-term
budget deficit—from 7.3 percent of GDP in 2012 to fiscal stimulus to economic activity during a period in
4.0 percent and 2.4 percent of GDP in 2013 and 2014, which the economy is already performing poorly. That
respectively. To provide a contrast with current law, is, government deficit spending is seen as boosting
the Congressional Budget Office (CBO) developed short-term activity. Removing the stimulus could
an alternative fiscal scenario, in which some current yield a near-term slowdown in economic activity or a
laws would be changed so that fiscal policy remains recession.
relatively unchanged. The alternative scenario shows
a much larger deficit—6.5 percent and 5.6 percent of According to CBO estimates, a continuation of the
GDP in 2013 and 2014, respectively. current laws will lead to a mild recession in which U.S.
real GDP declines by 0.5 percent from fourth quarter
In contrast, CBO expects both reduced revenues and 2012 to fourth quarter 2013. CBO also estimates that
higher expenditures if the laws are changed to sustain the policies in their alternative scenario will result in
current policy. The result is a larger deficit—an the U.S. real GDP growing by 1.7 percent from fourth
additional 2.5 percent of U.S. GDP in 2013. quarter 2012 to fourth quarter 2013. Combined, these
With the smaller deficits found under current law, the estimates indicate that CBO sees the fiscal cliff built
U.S. government’s debt-to-GDP ratio is projected to into current law as resulting in a 2.2 percent reduction
decline gradually. With the larger deficits found under in GDP during 2013.
CBO’s alternative fiscal scenario, the U.S. government’s Other economic perspectives suggest that a 2.5
debt-to-GDP ratio is expected to rise. percentage point reduction in the U.S. government
What Are the Implications for Long-Term Economic deficit as a share of GDP will yield an estimated GDP
Growth? loss for 2013 that ranges from 0.0 percent to 3.0 percent,
Table 2. For instance, application of the Ricardian
Reducing the U.S. government budget deficit by the equivalence theorem suggests no loss in GDP. In
amount expected under current law seems likely to contrast, application of Keynesian multipliers similar
promote long-term economic growth. Under current to those used by Zandi (2008) suggests a GDP loss of
law, the deficit as a percent of GDP is expected to fall 3.0 percent.1
below the growth rate of U.S. real GDP. Economists
Estimated GDP Loss
see that development as advantageous to long-term
Source Estimated GDP Loss
economic growth because the debt-to-GDP ratio will
Table 2
CBO 2.2%
fall. Keynesian Multipliers 3.0%
Ricardian Equivalence 0.0%
With a change in laws to permit the continuation of Imperfect Ricardian Equivalence 0.8%
current policies, however, the deficit as a percent of Sources: Congressional Budget Office; Author’s estimates
Commerce Real Estate Solutions | comre.com
6. 170 South Main Street, Suite 1600
Salt Lake City, Utah 84101
This information is provided compliments of Commerce Real Estate Solutions
3980 Howard Hughes Parkway, Suite 100
Michael M. Lawson Las Vegas, NV 89169
President and CEO of Commerce Real Estate Solutions Tel (702) 796-7900 • Fax (702) 796-7920
www.comre.com
Ed Turpin
managing director - branch manager, las vegas office 6121 Lakeside Drive, Suite 205
Reno, NV 89511
Brian Armon, SIOR, CCIM Tel (775) 851-9500 • Fax (775) 851-9551
managing partner, northern nevada office
www.comre.com
To receive this newsletter by e-mail, please subscribe at
www.comre.com/subscribe This report has been prepared solely
for information purposes. It does not
Commerce is a regional real estate firm with international ties, purport to be a complete description of
dedicated first and foremost to our clients. With the industry’s premier the markets or developments contained
professionals, and industry leading technology, our mission is to in this material.
exceed our clients’ expectations through service excellence.
The information contained in this report,
For further information on the Nevada commercial real estate market, while not guaranteed, has been secured
visit www.comre.com or call 702-796-7900 or 775-851-9500. from sources we believe to be reliable.