
Recomendados
Recomendados
Mais conteúdo relacionado
Mais procurados
Mais procurados (20)
Semelhante a The Natural History Of The Normal First Stage Of 6[1]
Semelhante a The Natural History Of The Normal First Stage Of 6[1] (20)
Último
Último (20)
The Natural History Of The Normal First Stage Of 6[1]
- 1. The Natural History of the Normal First Stage of Labor Jun Zhang, PhD, MD, James Troendle, PhD, Rafael Mikolajczyk, MD, MSc, Rajeshwari Sundaram, PhD, Julie Beaver, MS, and William Fraser, MD, MS OBJECTIVE: To examine labor patterns in a large popu- CONCLUSION: The active phase of labor may not start lation and to explore an alternative approach for diag- until 5 cm of cervical dilation in multiparas and even later nosing abnormal labor progression. in nulliparas. A 2-hour threshold for diagnosing labor METHODS: Data from the National Collaborative Peri- arrest may be too short before 6 cm of dilation, whereas natal Project were used. A total of 26,838 parturients a 4-hour limit may be too long after 6 cm. Given that were selected who had a singleton term gestation, spon- cervical dilation accelerates as labor advances, a gradu- ated approach based on levels of cervical dilation to taneous onset of labor, vertex presentation, and a normal diagnose labor protraction and arrest is proposed. perinatal outcome. A repeated-measures analysis was (Obstet Gynecol 2010;115:705–10) used to construct average labor curves by parity. An interval-censored regression was used to estimate dura- LEVEL OF EVIDENCE: III tion of labor stratified by cervical dilation at admission and centimeter by centimeter. RESULTS: The median time needed to progress from one centimeter to the next became shorter as labor advanced T he escalating rate of cesarean delivery worldwide has caused serious concerns in the obstetric com- munity and the public.1,2 Causes for the high rate are (eg, from 1.2 hours at 3– 4 cm to 0.4 hours at 7– 8 cm in complex.3 Currently, there is a lack of convincing and nulliparas). Nulliparous women had the longest and most effective strategies to reverse the trend. gradual labor curve; multiparous women of different pari- ties had very similar curves. Nulliparas may start the active Our inability to reduce the cesarean rate may be phase after 5 cm of cervical dilation and may not necessarily attributable in part to the incomplete understanding have a clear active phase characterized by precipitous of a normal labor process, particularly in the first dilation. The deceleration phase in the late active phase of stage of labor. However, owing to various interven- labor may be an artifact in many cases. tions in contemporary obstetric practice, a natural process of labor progression no longer can be studied From the Division of Epidemiology, Statistics and Prevention Research, Eunice in a large population. The high rate of elective and Kennedy Shriver National Institute of Child Health and Human Development, intrapartum cesarean delivery may further cause se- National Institutes of Health, Bethesda, Maryland; the Department of Clinical Epidemiology, Bremen Institute for Prevention Research and Social Medicine, rious selection bias. Thus, we sought to study the first Bremen University, Bremen, Germany; and the Department of Obstetrics and stage of labor using data from the National Collabora- Gynecology, University of Montreal, Montreal, Quebec, Canada. tive Perinatal Project, a large, multicenter, prospective, Supported by the Intramural Program of the Eunice Kennedy Shriver National observational study conducted between 1959 and 1966.4 Institute of Child Health and Human Development, National Institutes of Health. Because obstetric interventions in the first stage of labor The authors thank Dr. Ann Trumble for preparing the database. were less common in that era, these data provide a Presented at the Society for Maternal-Fetal Medicine 29th Annual Meeting, unique opportunity to observe what may be closest to January 26 –31, 2009, San Diego, California. the natural process of labor in a large population. The Corresponding author: Jun Zhang, MD, PhD, Epidemiology Branch, NICHD, National Institutes of Health, Building 6100, Room 7B03, Bethesda, MD objective of our study was to examine labor patterns in 20892; e-mail: zhangj@mail.nih.gov. a large population and to explore an alternative ap- Financial Disclosure proach for diagnosing abnormal labor progression. Dr. Fraser receives salary support from the Canadian Institutes of Health Research through a Canada Research Chair. The other authors did not report MATERIALS AND METHODS any potential conflicts of interest. The National Collaborative Perinatal Project was © 2010 by The American College of Obstetricians and Gynecologists. Published by Lippincott Williams & Wilkins. designed to study factors during pregnancy and early ISSN: 0029-7844/10 childhood that affect child neurodevelopment and VOL. 115, NO. 4, APRIL 2010 OBSTETRICS & GYNECOLOGY 705
- 2. diseases such as cerebral palsy. Abnormal progress of study. We restricted our analysis to term pregnancies labor was one of the factors of interest. Women who (37– 42 weeks, n 40,973) with a spontaneous onset of sought prenatal care at 12 hospitals in the United labor (n 36,402). We also restricted to pregnancies States were recruited prospectively from 1959 to with vertex fetal presentation at admission (excluding 1965.4 At entry, detailed demographic, socioeco- face, brow, or chin position, n 35,318). Further ex- nomic, and behavioral data were collected through cluded were cases of placenta previa, severe hyperten- in-person interviews. Medical history, physical exam- sion in pregnancy, cord prolapse, and uterine rupture ination, and blood sample also were obtained. In the (n 34,250). To examine the labor pattern in parturients ensuing prenatal visits, women were interviewed re- with normal perinatal outcomes, we restricted our anal- peatedly and physical findings were recorded. When the ysis to births of neonates with 5-minute Apgar scores of woman was admitted to the hospital for labor and at least 7 (n 30,872). Finally, we excluded women who delivery, her physical status was reevaluated and all had fewer than two values of cervical dilation in the first labor and delivery events were recorded in detail by a stage (n 27,801) or never reached 10 cm, leaving trained observer. However, no particular labor protocol 26,838 women for analysis. was used, and the number and timing of pelvic exams Rectal exams to measure cervical dilation were were not standardized. A summary of the labor and performed quite commonly in that era. Among delivery was completed by the obstetrician responsible 262,262 pelvic exams in the National Collaborative for the patient’s care.5 Children were observed up to 7 Perinatal Project data, 45% were vaginal, 45% were years of age. A comprehensive battery of physical rectal, and 10% were unknown. We compared two exams and psychological and neurodevelopmental tests types of measurements in terms of degree of error and were conducted.6 effect on labor curves and found no clinically signifi- The current study uses information on maternal cant differences (results not shown). Thus, we used baseline characteristics, physical findings at admission both types of measurements in our analysis. to labor and delivery, repeated measures of cervical We first grouped the participants according to dilation, and delivery information. Friedman et al5 their parity (0, 1, 2 ) and compared baseline charac- conducted a detailed validation study on errors of the teristics. We used the 2 test for categorical variables, labor data in the National Collaborative Perinatal analysis of variance for continuous variables with Project. A sample of 667 gravidas was selected for normal distribution, and nonparametric rank-sum test whom there were suspicious labor data entry errors for continuous variables with skewed distribution to on cervical dilation, fetal station, or date and time of examine statistical significance. We then used a re- the exams because the labor progress was unusually peated-measures analysis7 with an eighth-degree poly- rapid or dilatation regressed. A total of 17,916 data nomial model to construct average labor curves by items from these cases were verified against hardcopy parity. In this analysis, the starting point was set at the records. The authors found that the overall error rate first time when the dilation reached 10 cm (time 0) was about 1% with the error rate of 0.96%, 0.87%, and the time was calculated backwards (eg, 60 min- 1.11% and 1.24% for date, time, cervical dilation and utes before the complete dilation, -60 minutes). After fetal station, respectively. Conversely, they selected the labor curve models had been computed, the X 1,764 dilation values, 1,925 station values, 1,901 time axis (time) was reverted to a positive value, ie, instead values and 1,901 date values that were not suspected of being -12 3 0 hours, it became 0 3 12 hours. of being problematic in any way. The error rates were Labor progression data are interval censored, eg, 1.25%, 1.19%, 1.26% and 0%, respectively. Therefore, one only knows that the cervix dilated from 4 to 5 cm it was concluded that the National Collaborative between two pelvic exams but does not know exactly Perinatal Project labor data were reasonably complete when it happened. Thus, we used an interval cen- and accurate. During our own data preparation for sored regression8 to estimate the distribution of times the current analysis, we identified a problem related for progression from one integer centimeter of dila- to time. In one hospital, the clock in the delivery tion to the next (called traverse time) with an assump- room was not correctly adjusted for daylight savings tion that the labor data are log-normally distributed.9 time, which resulted in discrepancies in time between The median and 95th percentiles were calculated. A labor and delivery records. A total of 2,718 records total of 6.6% of women with parity of two or more were affected by this error and, therefore, fixed by contributed more than one pregnancy data to that adding 1 hour to the delivery time in these cases. group (P2 ). We therefore used a parametric frailty A total of 54,304 singleton pregnancies who were model to account for the repeated measures in these delivered at 20 weeks or later were included in the women.10 Because multiparous women tended to be 706 Zhang et al The First Stage of Labor OBSTETRICS & GYNECOLOGY
- 3. admitted at a more advanced stage labor than nullip- PROC LIFEREG for interval censored regression and arous women, many multiparous women did not have PROC NLMIXED for interval censored regression with information on cervical dilation before 3.5 cm. There- repeated measures). Because the National Collaborative fore, the labor curves and traverse time for multipa- Perinatal Project data are publicly available, our study rous women started at 3.5 cm (or 4 cm) rather than at was exempted from institutional review board review. 3 cm as for nulliparous women. Finally, to address the clinical experience where a RESULTS woman is first observed at a given dilation and then In National Collaborative Perinatal Project, the over- measured periodically, we calculated cumulative dura- all rate of cesarean delivery was 5.6%; in women who tion of labor from admission to any given dilation up to had trial of labor, the cesarean rate was 2.6% and the the first 10 cm in nulliparas. The same interval censored induction rate was 7.1%. Table 1 presents the mater- regression approach was used. We provide the estimates nal characteristics of the selected study population by according to the dilation at admission (2.0 or 2.5 cm, 3.0 parity. Approximately half of the women were white, or 3.5 cm, 4.0 or 4.5 cm, 5.0 or 5.5 cm) because women 40% were African American, and 8% were other, admitted at different dilation levels may have different mainly Hispanic. The socioeconomic status index (com- patterns of labor progression. All statistical analyses bination of education, occupation and household in- were performed using SAS 9.1 (SAS Institute Inc., Cary, come) suggests that the majority of women were be- NC; PROC MIXED for the repeated-measures analysis, tween the 20th and 80th percentiles based on 1960 U.S. Table 1. Characteristics of the Parturients by Parity, National Collaborative Perinatal Project, 1959 –1966 Parity 0 Parity 1 Parity 2 (n 8,690) (n 6,373) (n 11,765) Maternal race White 53 55 45 African American 39 38 48 Other 8 7 7 Socioeconomic status index (percentile) Less than 20th 8 5 7 20th–39th 24 26 34 40th–59th 28 32 33 60th–79th 23 24 19 80th or higher 17 13 7 Maternal age (y) 20.3 3.9 22.7 4.4 27.4 5.5 2 Prepregnancy BMI (kg/m ) 21.5 3.2 22.2 3.8 23.5 4.5 Weight gain (kg) 10.9 4.5 10.3 4.4 10.3 4.9 BMI at delivery (kg/m2) 25.4 3.5 25.9 3.9 27.1 4.5 Cervical dilation at admission (cm) 3 (1, 6) 3.5 (2, 7) 3.5 (1.5, 6.5) Station at admission 0 ( 2, 1) 0 ( 2, 1) 1 ( 3, 1) Effacement at admission (%) 85 (50, 100) 80 (45, 100) 75 (30, 100) Rupture of the membranes at admission 29 26 27 Oxytocin for augmentation 20 12 12 Regional analgesia (caudal, sacral, epidural, peridural) 8 11 8 Total number of pelvic exams in first stage 6 (3, 11) 5 (2, 9) 5 (2, 9) Forceps delivery None 27 55 76 Outlet 33 17 9 Low 27 16 8 Mid/high 13 12 7 Cesarean delivery at second stage 0.24 0.02 0.05 Gestational age at delivery (wk) 39.8 1.4 39.8 1.4 39.8 1.4 Birth weight (g) 3,185 434 3,259 443 3,301 483 White 3,290 431 3,337 446 3,390 487 African American 3,060 409 3,155 424 3,220 467 Other 3,118 403 3,225 402 3,295 477 BMI, body mass index. Data are %, mean standard deviation, or median (10th, 90th percentile). All differences among the three groups were statistically significant at P .01 except for gestational age at delivery, where P .02. VOL. 115, NO. 4, APRIL 2010 Zhang et al The First Stage of Labor 707
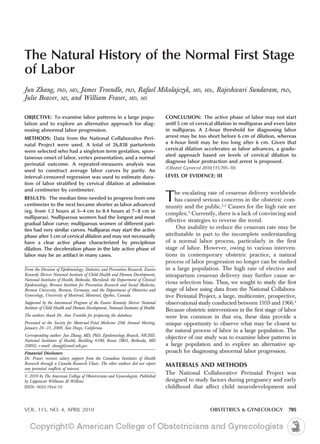
- 4. census.11 The mean maternal age was 20, 23, and 27 Table 2. Duration of Labor (in Hours) by Parity, years for parity 0, 1, 2 , respectively. Women were National Collaborative Perinatal Project, lean; gained 10 kg, on average, during pregnancy. 1959 –1966 The median cervical dilation at admission was 3 Cervical cm for nulliparas and 3.5 cm for multiparas. 20% Dilation (cm) Parity 0 Parity 1 Parity 2 nulliparas and 12% multiparas received oxytocin for From 3 to 4 1.2 (6.6) augmentation. 8 - 11% of women used regional anal- From 4 to 5 0.9 (4.5) 0.7 (3.3) 0.7 (3.5) gesia for labor pain (approximately half used caudal From 5 to 6 0.6 (2.6) 0.4 (1.6) 0.4 (1.6) and sacral analgesia and half used epidural and From 6 to 7 0.5 (1.8) 0.4 (1.2) 0.3 (1.2) peridural analgesia). Virtually all of them were deliv- From 7 to 8 0.4 (1.4) 0.3 (0.8) 0.3 (0.7) ered vaginally (cesarean deliveries at the first stage From 8 to 9 0.4 (1.3) 0.3 (0.7) 0.2 (0.6) From 9 to 10 0.4 (1.2) 0.2 (0.5) 0.2 (0.5) were excluded). The mean gestational age was 39.8 From 4 to 10 3.7 (16.7) 2.4 (13.8) 2.2 (14.2) weeks for both nulliparas and multiparas. The mean Data are median (95th percentile). birth weight increased with parity in all races. Figure 1 depicts the average labor curves for the three parity groups. Nulliparous women had the spontaneous onset of labor was admitted at 3 cm, the longest and most gradual labor curve; multiparous median time from admission to 6 cm was approximately women of different parities had very similar curves. 2.7 hours and the 95th percentile was 12.3 hours. If a The division between latent and active phases was woman was admitted at 4 cm, her median and 95th more obvious in multiparas than in nulliparas. The percentile of the duration of labor from admission to 6 inflection point appeared to have occurred earlier in cm were approximately 1.4 and 7.8 hours, respectively. parity 2 (at 5 cm) than in parity 1 (at 5.5 cm). The nulliparous curve did not have a clear inflection point. DISCUSSION Table 2 provides a more detailed analysis on Labor progression was first studied systematically and labor progression. The median time needed to extensively by Dr. Friedman for four decades (from progress from one centimeter to the next became the 1950s to the 1980s). A number of his highly shorter as the labor advanced. The 95th percentiles influential articles and books established the land- suggest that, in nulliparous women, labor may be slow scape of this field.5,12–14 Perhaps because labor is often before 6 cm but that it still can result in a vaginal considered unpredictable and the methodology re- delivery with a normal perinatal outcome. quired to study labor is complex, the pace of research Table 3 presents the median and 95th percentiles of on this topic has been painstakingly slow. Only in the duration of labor in nulliparous women whose first more recent years has it regained some traction as cervical examination was at 2, 3, 4, or 5 cm of dilation, cesarean delivery became pandemic. Unfortunately, respectively. For example, if a nulliparous woman with because a large proportion of pregnancies now are delivered by cesarean, either before or during labor, 10 selection bias (ie, who is left to have a vaginal P0 delivery?) can have a serious effect on findings in any 9 P2+ P1 contemporary studies. The high frequency of obstet- Cervical dilation (cm) 8 ric intervention (eg, induction of labor) further com- 7 plicates the data, which makes a natural history study 6 P1 and P2+ difficult. It thus becomes more challenging to conduct start at 3.5 cm statistical analyses that will yield unbiased results. We, 5 therefore, based our analysis on the old National 4 Collaborative Perinatal Project cohort where cesarean 3 delivery was uncommon and the rate of labor induc- 0 1 2 3 4 5 6 7 8 9 10 11 tion relatively low. We describe the labor progression Time (hours) in the first stage only, as forceps were frequently used Fig. 1. The average labor curves by parity in women with in the second stage of labor, particularly in nulliparas singleton term pregnancies with spontaneous onset of labor (33%, 27%, and 13% for outlet, low, and mid/high and vertex presentation who completed the first stage of labor and whose newborns had 5-minute Apgar scores of at forceps, respectively), which could have affected the least 7. The National Collaborative Perinatal Project, 1959 – course of the second stage. 1966. P0, nulliparas; P1, parity 1; P2 , parity 2 or higher. One of the interesting findings of our study is that Zhang. The First Stage of Labor. Obstet Gynecol 2010. the inflection point on the average labor curves of the 708 Zhang et al The First Stage of Labor OBSTETRICS & GYNECOLOGY
- 5. Table 3. Duration of Labor (in Hours) in Nulliparas Based on Cervical Dilation at Admission, National Collaborative Perinatal Project, 1959 –1966 Admitted at 2 Admitted at 3 Admitted at 4 Admitted at 5 Cervical Dilation (cm) or 2.5 cm or 3.5 cm or 4.5 cm or 5.5 cm Adm. to 3 1.0 (8.5) Adm. to 4 2.3 (12.6) 0.7 (6.5) Adm. to 5 3.6 (15.3) 1.9 (10.5) 0.5 (5.4) Adm. to 6 4.5 (17.0) 2.7 (12.4) 1.3 (8.4) 0.4 (3.4) Adm. to 7 5.1 (18.0) 3.3 (13.3) 2.0 (10.1) 0.9 (5.5) Adm. to 8 5.5 (18.8) 3.7 (14.1) 2.4 (11.4) 1.3 (6.6) Adm. to 9 5.9 (19.8) 4.1 (15.2) 2.8 (12.7) 1.7 (8.2) Adm. to 10 6.3 (20.7) 4.5 (16.2) 3.2 (14.1) 2.1 (9.3) Adm., admission. Data are median (95th percentile). multiparas was more obvious and emerged much phase of labor was defined as time when the cervix sooner than that of the nulliparas. After the inflection dilated faster than 1.2 cm/h in nulliparas and 1.5 point, the cervix dilated precipitously to 10 cm. The cm/h in multiparas. They found that among women inflection point appears slightly sooner in parity 2 who had no active phase arrest, 50% of them entered than in parity 1. On the other hand, the nulliparas had active phase by 4 cm dilation; 74% by 5 cm and 89% a quite different average labor curve. The inflection by 6 cm. Unfortunately, mixing women with various point was unclear and appeared quite late in labor. parities makes the application of their findings to Interpretation of the average labor curve requires nulliparas as well as multiparas difficult. caution. First, duration of labor expressed in the curves These observations raise an important question: is the mean rather than the median. The mean and how should the active phase be defined? Hendricks et median may not match. For example, the duration of al16 define it as “Pains plus Progress,” “which usually labor from 4 to 10 cm was 4.4 hours on the nulliparous means that contractions are coming at intervals of five labor curve (the mean) but 3.7 hours according to minutes or less, are associated with discomfort for the traverse time (the median). Furthermore, the shape of patient, and with observable progress in cervical dilata- the average labor curve is determined by the shape and tion.” Based on the Friedman curve in primigravid,13,17 variability of the underlying individual curves. For in- the transition from the latent to active phase appeared to stance, if parturients have diverse speeds of cervical occur between 3 and 4 cm. A more commonly used dilation in the latent and active phases and enter the definition is that the active phase starts at 4 cm dila- active phase at various time (measured by cervical tion.18,19 However, if the observations by Peisner and dilation), the average labor curve will tend to look flat Rosen15 and our study are true, there are a large number and the inflection point will be unclear. From the of women who are not in the active phase at 4 cm, average labor curves (Fig. 1), one may deduce that the particularly in nulliparas. As Peisner and Rosen15 con- variation of multiparous curves is smaller than that of clude, “a patient who is not progressing in labor at 4 cm nulliparous curves; and women of parity 2 may enter cervical dilation is not necessarily abnormal.” Our anal- the active phase of labor slightly sooner than parity 1. ysis shows that it may take more than 4 hours for The speed of cervical dilation in active phase is slower in nulliparas to progress from 4 to 5 cm (Table 2). nulliparas than in multiparas. Rouse et al20,21 subsequently proposed a new defi- More importantly, the inflection point on the mul- nition of the active phase (4-cm dilatation and at least tiparous curve is at 5 cm or 5.5 cm. Although we cannot 90% effacement or 5-cm dilatation regardless of efface- be certain that all multiparas enter the active phase at ment) and asserted that this definition would capture the 5 cm, we may acknowledge that by 5 cm, the vast majority of women who have entered the active phase majority of multiparous women have entered the during labor induction.20 It is yet to be tested whether active phase. Further, if the latest starting point of the this definition applies to spontaneous labor and whether active labor is 5 cm for multiparas, the inflection point it works equally well in nulliparas and multiparas. for nulliparas is likely to be later than 5 cm. Another important difference between Friedman Peisner and Rosen15 examined 1,699 labors with curve13 and ours is the deceleration phase. Our study as approximately two thirds nulliparas and one third well as previous studies16 do not show a clear decelera- multiparas. The transition from the latent to active tion phase in late active phase although we used an VOL. 115, NO. 4, APRIL 2010 Zhang et al The First Stage of Labor 709
- 6. eighth-degree polynomial model with a very large sam- REFERENCES ple size. After examining a large number of individual 1. Betran AP, Merialdi M, Lauer JA, Bing-Shun W, Thomas J, ´ labor curves, we agree with Hendricks et al16 that “the Van Look P, et al. Rates of caesarean section: analysis of global, regional and national estimates. Paediatr Perinat Epi- deceleration phase” may be an artifact of missed obser- demiol 2007;21:98 –113. vation in most cases. As the cervical dilation accelerates 2. Villar J, Valladares E, Wojdyla D, Zavaleta N, Carroli G, when it approaches 10 cm, prompt and frequent pelvic Velazco A, et al. Caesarean delivery rates and pregnancy outcomes: the 2005 WHO global survey on maternal and exams are necessary to observe for the first time when perinatal health in Latin America. Lancet 2006;367:1819 –29. the cervix reaches the 10 cm. If the full dilation is not 3. Coleman VH, Lawrence H, Schulkin J. Rising cesarean deliv- observed promptly, for example, a cervical examination ery rates: the impact of cesarean delivery on maternal request. was not done until half an hour after the cervix had Obstet Gynecol Surv 2009;64:115–9. reached the full dilation, it would appear on the labor 4. Niswander KR, Gordon M, editors. The collaborative perina- tal study of the National Institute of Neurological Diseases and curve that the cervix had taken a long time to dilate from Stroke: the women and their pregnancies. Philadelphia (PA): 9 cm to 10 cm – a deceleration phase. WB Saunders; 1972. Despite the fact that the average labor curve is easy 5. Friedman EA, Neff RK. Labor and delivery: impact on off- to understand and provides ample information for spring. Littleton (MA): PSG Publishing Co., Inc.; 1987. p. 9 –34. studying labor progression, its clinical utility in manag- 6. Hardy JB. The Collaborative Perinatal Project: lessons and ing individual patients is limited. We, therefore, propose legacy. Ann Epidemiol 2003;13:303–11. alternative tools for clinical purposes. Table 2 presents 7. Crowder KJ, Hand DJ. Analysis of repeated measures. New the median and 95th percentiles of duration of labor York (NY): Chapman and Hall; 1990. from one dilation level to the next in women who 8. Klein JP, Moeschberger ML. Survival analysis: techniques for reached full dilation and had a normal perinatal out- censored and truncated data. Berlin: Springer; 1997. come. This information gives clinicians a more objective 9. Vahratian A, Troendle JF, Siega-Riz AM, Zhang J. Method- ological challenges in studying labour progression in contem- assessment of whether labor arrest has occurred. This porary practice. Paediatr Perinat Epidemiol 2006;20:72– 8. table suggests that a 2-hour threshold14 may be too short 10. Bellamy SL, Li Y, Ryan LM, Lipsitz S, Canner MJ, Wright R. before 6 cm whereas a 4-hour limit22 may be too long Analysis of clustered and interval censored data from a com- after 6 cm. Given that the speed of cervical dilation is munity-based study in asthma. Statist Med 2004;23:3607–21. not constant, a graduated threshold based on the level of 11. Myrianthopoulos NC, French KS. An application of the U.S. Bureau of the Census socioeconomic index to a large, diversi- cervical dilation may be a more appropriate approach to fied patient population. Soc Sci Med 1968;2:283–99. defining labor arrest than a “one-size-fits-all” method. 12. Friedman EA. The graphic analysis of labor. Am J Obstet Similarly, Table 3 illustrates the cumulative duration of Gynecol 1954;68:1568 –75. labor from admission. It provides some guidance to 13. Friedman EA. Primigravid labor: a graphicostatistical analysis. diagnose labor protraction or dystocia. Obstet Gynecol 1955;6:567– 89. It should be pointed out that, although the old data 14. Friedman EA. Labor: clinical evaluation and management. 2nd ed. New York (NY): Appleton-Century-Crofts; 1978. have advantages in studying natural history, ie, the 15. Peisner DB, Rosen MG. Transition from latent to active labor. shape of the labor curve and pattern of labor progres- Obstet Gynecol 1986;68:448 –51. sion, it is necessary to exercise caution in generalizing 16. Hendricks CH, Brenner WE, Kraus G. Normal cervical dila- the absolute values in Tables 2 and 3 to contemporary tation pattern in late pregnancy and labor. Am J Obstet obstetric populations. This is because the characteristics Gynecol 1970;106:1065– 82. of the parturients (eg, maternal age, body mass and fetal 17. Bowes Jr WA, Thorp Jr JM. Clinical aspects of normal and abnormal labor. In: Creasy RK, Resnik R, Iams JD, editors. size) have changed substantially; so has the obstetric Maternal-fetal medicine 5th ed. Philadelphia (PA): Saunders. practice. Contemporary data, therefore, are needed to 2004:671. establish such references for current practice. 18. Albers LL, Schiff M, Gorwoda JG. The length of active labor in In summary, our observation of a large group of normal pregnancies. Obstet Gynecol 1996;87:355–9. parturients with fewer obstetric interventions suggests 19. Rouse DJ, Owen J, Hauth JC. Active-phase labor arrest: oxytocin augmentation for at least 4 hours. Obstet Gynecol that multiparas may not enter the active phase of 1999;93:323– 8. labor until 5 cm. Nulliparas may start the active phase 20. Lin MG, Rouse DJ. What is a failed labor induction? Clin even later and may not necessarily have a clear active Obstet Gynecol 2006;49:585–93. phase characterized by precipitous dilation. The de- 21. Rouse DJ, Owen J, Hauth JC. Criteria for failed labor induc- celeration phase in the late active phase of labor may tion: prospective evaluation of a standardized protocol. Obstet Gynecol 2000;96:671–7. be an artifact in many cases. A graduated approach 22. Rouse DJ, Owen J, Savage KG, Hauth JC. Active phase labor for assessing labor progression in individual patients arrest: revisiting the 2-hour minimum. Obstet Gynecol is proposed. 2001;98:550 – 4. 710 Zhang et al The First Stage of Labor OBSTETRICS & GYNECOLOGY