SlideShare uma empresa Scribd logo
1 de 3
Baixar para ler offline
Sponsored by

                                                                                                                                                          Vol. 11, No. 56 / March 25, 2013 

           USDA’a monthly Cattle On Feed report, re-                         USDA Cattle on Feed Report -- March 2013
leased on Friday, will likely be viewed as bullish by the                                                             Thous. Hd.               2013 as pct. Of 2012
trade this morning primarily due to a larger-than-
                                                                                                                                                          Esti-        Differ-
expected decline in February placements. The key                                                                   2012          2013        Actual
                                                                                                                                                          mate*         ence
national data from the report appear at right. February
placements into feedlots with capacities of 1000 head and         On Feed, March 1                                11,677 10,857               93.0         93.5          -0.5
more numbered 1.482 million head, 13.5% fewer than one Placed on Feed in February                                   1,714        1,482        86.5         91.0          -4.5
year ago and nearly 78,000 head fewer than was ex-                Fed Cattle Marketed, February                     1,755        1,638        93.3         92.7           0.6
pected, on average, by the analysts surveyed before the           *Dow Jones survey
report by Dow Jones. The other key measures are quite
close to the average pre-report estimates. Weakening fed cattle futures                                           CATTLE ON FEED, U.S
and concern about the status of meat demand in general and beef de-                                    Range '08-'12        2012       2013       Avg. '08-'12
                                                                                 Thous. Head
mand in particular certainly reduced the incentives to place cattle last
                                                                                  12500
month. The total March 1 feedlot inventory of 10.857 million head, how-
ever, represents the largest year-on-year decline yet seen in this cycle
                                                                                  12000
that began back in September. The –7% figure for March 1 inventory is
also the largest year-on-year percentage decline since January 2009
                                                                                  11500
and further solidifies our position that fed cattle supplies will tighten sig-
nificantly in the second half or 2013. As can be seen at right, the March
                                                                                  11000
1, 2013 inventory was almost the smallest March 1 inventory of the past
6 years, exceeding only the 2010 inventory of 10.849 million head.
                                                                                  10500
           The average weight of cattle placed in February was 714.2
pounds, nearly 9 pounds of 1.3% lower than one year ago. That aver-
                                                                                  10000
age in-weight was tied for the third lowest for February in the current
Cattle-On-Feed data series that dates back to 1996. Over time, Febru-
                                                                                    9500
ary has marked the peak for placement weights during the year. The                         J         F       M      A      M       J      J     A       S       O       N     D
2007-2011 average for February is 722.5 pounds.
           USDA’s monthly Cold Storage report, also released on                                  MEAT & POULTRY IN COLD STORAGE
Friday afternoon, indicates continued large stocks of frozen meat                             Total, 4 Species         Beef          Chicken        Pork           Turkey
an poultry as of the end of February. Total meat and poultry in freez-               Individual Species                                                  Total Meat & Poultry
ers on February 28 was 2.188 billion pounds, 5.7% higher than last year
and 2.6% higher than last month. And in spite of apparently soft de-                1200                                                                                2400
mand for both beef and pork, neither of those species was the culprit in
the frozen meat/poultry stock increase. Data appear on page 3.                    t 1000
                                                                                  .                                                                                     2000 t .
           That label would apply to the two poultry species with chicken         W                                                                                            W
                                                                                  C                                                                                            C
inventories exceeding last year by 6.1% and turkey stocks growing by              T 800
                                                                                  R
                                                                                                                                                                        1600 T
                                                                                                                                                                               R
                                                                                  /                                                                                            /
14.1% versus 2012. Of the 118.15 million pound total increase in fro-             c
                                                                                  r                                                                                            c
                                                                                                                                                                               r
                                                                                  a                                                                                            a
zen meat and poultry inventories versus last year, chicken accounted              C 600
                                                                                  ,
                                                                                  .
                                                                                                                                                                        1200 C ,
                                                                                                                                                                               .
for 36.5 million and turkey accounted for 49.4 million — a total of 85.14         s                                                                                            s
                                                                                  b                                                                                            b
                                                                                  L                                                                                            L
million or 72% of the year-on-year total increase. The amount of chick-           .
                                                                                  l
                                                                                  i 400                                                                                 800    .
                                                                                                                                                                               l
                                                                                                                                                                               i
                                                                                  M                                                                                            M
en in freezers at the end of February was down 3.2% from January.
Turkey inventories were up 10.8% versus January. It was not a good                    200                                                                               400
month for poultry movement and there is more chicken on the way.
These poultry supplies could get large indeed!                                          0                                                                               0
                                                                                           00 01 02 03 04 05 06 07 08 09 10 11 12 13
           Stocks of both pork and beef were higher at the end of Febru-
ary but not by much. Pork inventories grew 5% during month and end-
ed up at 637 million pounds, 2.3% higher than last year. Ribs remain           about one-third lower than one year ago.
the big driver (along with “Other” pork) of the year-on-year increase.                       Beef stocks were 1.2% higher than at the end of January and
Let’s hope that warmer weather and barbecued rib features make a               4.1% higher than last year. Per normal, the big driver is boneless beef
dent in this supply soon. Belly stocks grew during January but remain          inventories since that category accounts for nearly 90% of the total.

                       The Daily Livestock Report is made possible with support from readers like you. If you enjoy this report, find if valuable
                      and would like to sustain it going forward, consider becoming a contributor. Just go to www.DailyLivestockReport.com to
                             contribute by credit card or send your check to The Daily Livestock Report, P.O. Box 2, Adel, IA 50003.


 The Daily Livestock Report is published by Steve Meyer & Len Steiner, Inc., Adel, IA and Merrimack, NH.   To subscribe, support or unsubscribe visit www.dailylivestockreport.com. Copyright © 2013 
 Steve Meyer and Len Steiner, Inc.  All rights reserved. 
 The Daily Livestock Report is not owned, controlled, endorsed or sold by CME Group Inc. or its affiliates and CME Group Inc. and its affiliates disclaim any and all responsibility for the informa on 
 contained herein.   CME Group®, CME® and the Globe logo are trademarks of Chicago Mercan le Exchange, Inc.  
 Disclaimer: The Daily Livestock Report is intended solely for informa on purposes and is not to be construed, under any circumstances, by implica on or otherwise, as an offer to sell or a solicita‐
   on to buy or trade any commodi es or securi es whatsoever. Informa on is obtained from sources believed to be reliable, but is in no way guaranteed. No guarantee of any kind is implied or 
 possible where projec ons of future condi ons are a empted. Futures trading is not suitable for all investors, and involves the risk of loss. Past results are no indica on of future performance. 
 Futures are a leveraged investment, and because only a percentage of a contract’s value is require to trade, it is possible to lose more than the amount of money ini ally deposited for a futures 
 posi on. Therefore, traders should only use funds that they can afford to lose without affec ng their lifestyle. And only a por on of those funds should be devoted to any one trade because a 
 trader cannot expect to profit on every trade.  
Sponsored by

                                                                                            Vol. 11, No. 56 / March 25, 2013 

                           USDA Cold Storage Report
                                   March 22, 2013
Product                              Quantity in All Warehouses                            Current as pct. of:
                                 2/28/12                1/31/13                  2/28/13    2/28/12     1/31/13
Chicken                          -------------- Thous. Lbs. ----------------
  Whole Chickens                   13937                18,741                   16,372       117.5        87.4
  Hens, Mature Chickens             4051                 3,474                    1,505        37.2        43.3
  Breasts & Breast Meat          122332               129,741                   127,276       104.0        98.1
  Drumsticks                       15040                17,032                   12,824        85.3        75.3
  Leg Quarters                     94769              116,367                   109,227       115.3        93.9
  Legs                              9715                13,055                   10,020       103.1        76.8
  Thigh & Thigh Quarters            9620                 8,836                    7,673        79.8        86.8
  Thigh Meat                       20834                17,914                   17,627        84.6        98.4
  Wings                            33732                59,737                   62,788       186.1       105.1
  Paws and Feet                    27681                22,546                   19,684        71.1        87.3
  Other                          247987               250,105                   251,226       101.3       100.4
Total Chicken                   599,698               657,548                   636,222       106.1        96.8
Turkey
 Whole Turkeys                  141,002                146,967                   171,734      121.8       116.9
   Toms (Whole)                  59,607                 68,418                    83,145      139.5       121.5
   Hens (Whole)                  81,395                 78,549                    88,589      108.8       112.8
 Breasts                         59,759                 63,914                    66,800      111.8       104.5
 Legs                            21,533                 20,930                    19,683       91.4        94.0
 Mech. Deboned Turkey            10,427                  9,660                    13,036      125.0       134.9
 Other Turkey                    36,041                 33,232                    30,451       84.5        91.6
 Unclassified                    80,815                 85,315                    97,229      120.3       114.0
Total Turkey                    349,577                360,018                   398,933      114.1       110.8
Ducks                             2,222                  1,444                     1,482       66.7       102.6
Total Poultry                   951,497              1,019,010                 1,036,637      108.9       101.7
Frozen Pork
  Picnics, Bone-in               12,068                 12,267                   15,581       129.1       127.0
  Hams, Total                   110,238                108,450                  110,506       100.2       101.9
   Bone-in                       55,591                 50,539                   53,462        96.2       105.8
   Boneless 3/                   54,647                 57,911                   57,044       104.4        98.5
  Bellies                        61,577                 36,425                   42,667        69.3       117.1
  Loins, Total                   43,440                 43,989                   41,867        96.4        95.2
   Bone-in                       14,253                 13,755                   15,083       105.8       109.7
   Boneless 4/                   29,187                 30,234                   26,784        91.8        88.6
  Ribs 5/                        96,043                114,370                  122,620       127.7       107.2
  Butts                          27,822                 31,091                   28,640       102.9        92.1
  Trimmings 6/                   64,964                 57,826                   64,328        99.0       111.2
  Other 7/                       94,597                109,891                  111,654       118.0       101.6
  Variety Meats 8/               37,466                 28,109                   32,416        86.5       115.3
  Unclassified 9/                74,458                 64,007                   66,414        89.2       103.8
Total Pork                      622,673                606,425                  636,693       102.3       105.0
Frozen Beef
  Boneless 1/                   412,908                420,786                  433,597       105.0       103.0
  Beef Cuts 2/                   57,900                 63,824                   56,716        98.0        88.9
Total Beef                      470,808                484,610                  490,313       104.1       101.2
Other Meat
  Veal                            4,363                  5,012                    4,858       111.3        96.9
  Lamb & Mutton                  20,851                 18,768                   19,841        95.2       105.7
Total Other Meat                 25,214                 23,780                   24,699        98.0       103.9

Total Meat                     1,118,695             1,114,815                 1,151,705      103.0       103.3

Total Meat & Poultry           2,070,192             2,133,825                 2,188,342      105.7       102.6
Sponsored by

                                                                                                                                         Vol. 11, No. 56 / March 25, 2013 


PRODUCTION AND PRICE SUMMARY                                                                                               Week Ending                           3/23/2013
                                                                         Current                          Pct.                           Pct.                         Pct.
       Item                                   Units                       Week Last Week               Change Last Year               Change                 YTD   Change
       Total Meat & Poultry Prod.             Million lbs.                  1693.7         1713.7         -1.17%          1683.6          0.60%          19,394       0.34%
  C    FI Slaughter                           Thou. Head                       601            606        -0.83%              603        -0.32%          7,041        -3.38%
  A    FI Cow Slaughter                       Thou. Head                    123.7          116.9          5.87%           124.6         -0.72%          1,228        -2.11%
  T    Avg. Live Weight                       Lbs.                           1315           1312          0.23%            1297          1.39%          1,324         1.34%
  T    Avg. Dressed Weight                    Lbs.                            796             798        -0.25%              787         1.14%            799         1.49%
  L    Beef Production                        Million Lbs.                  476.9          482.3         -1.12%           473.6          0.70%          5,577        -2.57%
  E    Live Fed Steer                         $/cwt live wt.               124.77         126.66         -1.50%          126.59         -1.44%
       Dressed Steer                          $/cwt carcass                197.71         200.46         -1.37%          203.15         -2.68%
  &    OKC Feeder Steer                       700-800 Lbs.                 139.10         136.65          1.80%          157.18        -11.50%
       Beef Cutout                            600-750 Choice               193.57         196.75         -1.62%          189.63          2.08%
  B    Hide/Offal                             $/cwt live wt.                14.25          13.96          2.08%           13.71          3.94%
  E    Rib                                    Choice                       287.08         286.18          0.31%          282.41          1.65%
  E    Round                                  Choice                       167.72         172.50         -2.77%          160.51          4.49%
  F    Chuck                                  Choice                       168.91         173.71         -2.76%          151.63         11.40%
       Trimmings, 50%                         Fresh                         88.09          88.05          0.05%           89.23         -1.28%
       Trimmings, 90%                         Fresh                        219.41         219.19          0.10%          218.89          0.24%
  H    FI Slaughter                           Thou. Head                     2176           2203         -1.23%            2132          2.06%         25,476        -1.12%
  O    FI Sow Slaughter                       Thou. Head                      57.0           54.9         3.68%             54.8         3.98%            556        -0.19%
  G    Avg. Dressed Weight                    Lbs.                            208             207         0.48%              209        -0.48%            208        -0.68%
  S    Pork Production                        Million Lbs.                  451.7             457        -1.16%           445.4          1.41%          5,285        -1.69%
       Iowa-S. Minn. Direct                   Avg.                          72.36          74.49         -2.86%           84.37        -14.23%
  &    Natl. Base Carcass Price               Weighted Avg.                 75.74          76.42         -0.89%           84.82        -10.71%
       Natl. Net Carcass Price                Weighted Avg.                 78.17          78.83         -0.84%           87.29        -10.45%
  P    Pork Cutout                            200 Lbs                       77.98          78.46         -0.61%           80.50         -3.13%
  O    Hams                                   Primal Cutout                 56.50          58.30         -3.09%           61.34         -7.89%
  R    Loins                                  Primal Cutout                 86.15          87.28         -1.29%           97.68        -11.80%
  K    Trimmings, 72% Lean                    Fresh                         53.00          53.61         -1.14%           59.29        -10.61%
       Bellies                                Primal Cutout                128.69         128.68          0.01%          102.27         25.83%
  C    Young Chicken Slaughter*               Million Head                 151.26         153.39         -1.39%          153.06         -1.17%          1,663        1.10%
  H    Avg. Weight                            Lbs., RTC                       4.37           4.34         0.51%             4.28         2.09%             4.3       1.86%
  I    Broiler Production                     Million Lbs., RTC             660.4          666.2         -0.88%           654.5          0.89%          7,371        4.34%
  C    Eggs Set                               Million                       200.2          199.4          0.42%           197.6          1.34%          2,179        1.48%
  K    Chicks Placed                          Million Head                  164.9          164.8          0.02%           163.0          1.14%          1,796        0.93%
  E    12-City Broiler                        Composite                    106.68         107.78         -1.00%           91.82         16.20%
  N    Georgia Dock Broiler                   2.5-3 Lbs.                   101.86         101.69          0.20%           92.34         10.30%
       Northeast Breast                       Skinlss/Bonelss               148.8         145.48          2.30%          134.51         10.60%
       Northeast Leg Quarters                                               66.85          66.59          3.00%           72.10         -6.90%
  T    Young Turkey Slaughter*                Million Head                    4.15           4.31        -3.78%             4.45        -6.74%           46.4         0.03%
  U    Avg. Weight                            Lbs.                          25.24          25.08          0.64%           24.74          2.00%           25.1        -0.26%
  R    Turkey Production                      Million Lbs.                  104.7          108.2         -3.17%           110.1         -4.87%          1,161        -0.28%
  K    Eastern Region Hen                     8-16 Lbs.                     95.50          95.50          0.00%           104.5         -8.60%
  F    Corn, Omaha                            $ per Bushel                    7.66           7.54         1.59%             6.50        17.94%
  E    DDGS, Minnesota                        $ per ton                    257.50         257.50          0.00%          201.50         27.79%
  E    Wheat, Kansas City                     $ per Bushel                    7.35           7.20         2.08%             6.68        10.03%
  D    Soybeans, S. Iowa                      $ per Bushel                  14.87          14.81          0.41%           13.57          9.50%
       SB Meal, 48% Central Illinois          $ per Ton                    435.90         437.00         -0.25%          366.10         19.10%
* Chicken & turkey slaughter, production and prices are 1 week earlier than the date at the top of this table. Cow & sow slaughter are for 2 weeks earlier

Mais conteúdo relacionado

Mais procurados

Daily livestock report oct 25 2012
Daily livestock report oct 25 2012Daily livestock report oct 25 2012
Daily livestock report oct 25 2012joseleorcasita
 
Daily livestock report jan 9 2013
Daily livestock report jan 9 2013Daily livestock report jan 9 2013
Daily livestock report jan 9 2013joseleorcasita
 
Daily livestock report feb 19 2013
Daily livestock report feb 19 2013Daily livestock report feb 19 2013
Daily livestock report feb 19 2013joseleorcasita
 
Daily livestock report apr 01 2013
Daily livestock report apr 01 2013Daily livestock report apr 01 2013
Daily livestock report apr 01 2013joseleorcasita
 
March 2013 Energy Index - Bord Gáis Energy
March 2013 Energy Index - Bord Gáis EnergyMarch 2013 Energy Index - Bord Gáis Energy
March 2013 Energy Index - Bord Gáis EnergyBord Gáis Energy
 
Daily livestock report mar 11 2013
Daily livestock report mar 11 2013Daily livestock report mar 11 2013
Daily livestock report mar 11 2013joseleorcasita
 
Daily livestock report sep 19 2012
Daily livestock report sep 19 2012Daily livestock report sep 19 2012
Daily livestock report sep 19 2012joseleorcasita
 
Daily livestock report aug 7 2012
Daily livestock report aug 7 2012Daily livestock report aug 7 2012
Daily livestock report aug 7 2012joseleorcasita
 
Daily livestock report sep 12 2012
Daily livestock report sep 12 2012Daily livestock report sep 12 2012
Daily livestock report sep 12 2012joseleorcasita
 
Daily livestock report aug 22 2012
Daily livestock report aug 22 2012Daily livestock report aug 22 2012
Daily livestock report aug 22 2012joseleorcasita
 
Daily livestock report sep 10 2012
Daily livestock report sep 10 2012Daily livestock report sep 10 2012
Daily livestock report sep 10 2012joseleorcasita
 
Daily livestock report dec 18 2012
Daily livestock report dec 18 2012Daily livestock report dec 18 2012
Daily livestock report dec 18 2012joseleorcasita
 
Daily livestock report sep 11 2012
Daily livestock report sep 11 2012Daily livestock report sep 11 2012
Daily livestock report sep 11 2012joseleorcasita
 
Daily livestock report oct 1 2012
Daily livestock report oct 1 2012Daily livestock report oct 1 2012
Daily livestock report oct 1 2012joseleorcasita
 
Daily livestock report dec 4 2012
Daily livestock report dec 4 2012Daily livestock report dec 4 2012
Daily livestock report dec 4 2012joseleorcasita
 
Daily livestock report dec 21 2012
Daily livestock report dec 21 2012Daily livestock report dec 21 2012
Daily livestock report dec 21 2012joseleorcasita
 
Daily livestock report oct 8 2012
Daily livestock report oct 8 2012Daily livestock report oct 8 2012
Daily livestock report oct 8 2012joseleorcasita
 

Mais procurados (17)

Daily livestock report oct 25 2012
Daily livestock report oct 25 2012Daily livestock report oct 25 2012
Daily livestock report oct 25 2012
 
Daily livestock report jan 9 2013
Daily livestock report jan 9 2013Daily livestock report jan 9 2013
Daily livestock report jan 9 2013
 
Daily livestock report feb 19 2013
Daily livestock report feb 19 2013Daily livestock report feb 19 2013
Daily livestock report feb 19 2013
 
Daily livestock report apr 01 2013
Daily livestock report apr 01 2013Daily livestock report apr 01 2013
Daily livestock report apr 01 2013
 
March 2013 Energy Index - Bord Gáis Energy
March 2013 Energy Index - Bord Gáis EnergyMarch 2013 Energy Index - Bord Gáis Energy
March 2013 Energy Index - Bord Gáis Energy
 
Daily livestock report mar 11 2013
Daily livestock report mar 11 2013Daily livestock report mar 11 2013
Daily livestock report mar 11 2013
 
Daily livestock report sep 19 2012
Daily livestock report sep 19 2012Daily livestock report sep 19 2012
Daily livestock report sep 19 2012
 
Daily livestock report aug 7 2012
Daily livestock report aug 7 2012Daily livestock report aug 7 2012
Daily livestock report aug 7 2012
 
Daily livestock report sep 12 2012
Daily livestock report sep 12 2012Daily livestock report sep 12 2012
Daily livestock report sep 12 2012
 
Daily livestock report aug 22 2012
Daily livestock report aug 22 2012Daily livestock report aug 22 2012
Daily livestock report aug 22 2012
 
Daily livestock report sep 10 2012
Daily livestock report sep 10 2012Daily livestock report sep 10 2012
Daily livestock report sep 10 2012
 
Daily livestock report dec 18 2012
Daily livestock report dec 18 2012Daily livestock report dec 18 2012
Daily livestock report dec 18 2012
 
Daily livestock report sep 11 2012
Daily livestock report sep 11 2012Daily livestock report sep 11 2012
Daily livestock report sep 11 2012
 
Daily livestock report oct 1 2012
Daily livestock report oct 1 2012Daily livestock report oct 1 2012
Daily livestock report oct 1 2012
 
Daily livestock report dec 4 2012
Daily livestock report dec 4 2012Daily livestock report dec 4 2012
Daily livestock report dec 4 2012
 
Daily livestock report dec 21 2012
Daily livestock report dec 21 2012Daily livestock report dec 21 2012
Daily livestock report dec 21 2012
 
Daily livestock report oct 8 2012
Daily livestock report oct 8 2012Daily livestock report oct 8 2012
Daily livestock report oct 8 2012
 

Destaque

Parque nacional de_aiguestortes
Parque nacional de_aiguestortesParque nacional de_aiguestortes
Parque nacional de_aiguestortescpascual2b
 
дидактические игры, педсовет, 01.04.2013
дидактические игры, педсовет, 01.04.2013дидактические игры, педсовет, 01.04.2013
дидактические игры, педсовет, 01.04.2013Лада Родионова
 
Día mundial de la concienciación del autismo
Día mundial de la concienciación del autismoDía mundial de la concienciación del autismo
Día mundial de la concienciación del autismojovension
 
Economias ilicitas colombia
Economias ilicitas   colombiaEconomias ilicitas   colombia
Economias ilicitas colombiaAndres Fajardo
 

Destaque (7)

Parque nacional de_aiguestortes
Parque nacional de_aiguestortesParque nacional de_aiguestortes
Parque nacional de_aiguestortes
 
Boston areia jan 2012 - feb 2015
Boston areia   jan 2012 - feb 2015Boston areia   jan 2012 - feb 2015
Boston areia jan 2012 - feb 2015
 
Odio
OdioOdio
Odio
 
дидактические игры, педсовет, 01.04.2013
дидактические игры, педсовет, 01.04.2013дидактические игры, педсовет, 01.04.2013
дидактические игры, педсовет, 01.04.2013
 
Día mundial de la concienciación del autismo
Día mundial de la concienciación del autismoDía mundial de la concienciación del autismo
Día mundial de la concienciación del autismo
 
Integral reputation management
Integral reputation managementIntegral reputation management
Integral reputation management
 
Economias ilicitas colombia
Economias ilicitas   colombiaEconomias ilicitas   colombia
Economias ilicitas colombia
 

Semelhante a Daily livestock report mar 25 2013

Daily livestock report jan 28 2013
Daily livestock report jan 28 2013Daily livestock report jan 28 2013
Daily livestock report jan 28 2013joseleorcasita
 
Daily livestock report feb 25 2013
Daily livestock report feb 25 2013Daily livestock report feb 25 2013
Daily livestock report feb 25 2013joseleorcasita
 
Daily livestock report feb 21 2013
Daily livestock report feb 21 2013Daily livestock report feb 21 2013
Daily livestock report feb 21 2013joseleorcasita
 
Daily livestock report sep 20 2012
Daily livestock report sep 20 2012Daily livestock report sep 20 2012
Daily livestock report sep 20 2012joseleorcasita
 
Daily livestock report july 23 2012
Daily livestock report july 23 2012Daily livestock report july 23 2012
Daily livestock report july 23 2012joseleorcasita
 
Daily livestock report mar 05 2013
Daily livestock report mar 05 2013Daily livestock report mar 05 2013
Daily livestock report mar 05 2013joseleorcasita
 
Daily livestock report mar 20 2013
Daily livestock report mar 20 2013Daily livestock report mar 20 2013
Daily livestock report mar 20 2013joseleorcasita
 
Daily livestock report mar 21 2013
Daily livestock report mar 21 2013Daily livestock report mar 21 2013
Daily livestock report mar 21 2013joseleorcasita
 
Daily livestock report apr 09 2013
Daily livestock report apr 09 2013Daily livestock report apr 09 2013
Daily livestock report apr 09 2013joseleorcasita
 
Daily livestock report mar 27 2013
Daily livestock report mar 27 2013Daily livestock report mar 27 2013
Daily livestock report mar 27 2013joseleorcasita
 
Daily livestock report oct 16 2012
Daily livestock report oct 16 2012Daily livestock report oct 16 2012
Daily livestock report oct 16 2012joseleorcasita
 
Daily livestock report nov 15 2012
Daily livestock report nov 15 2012Daily livestock report nov 15 2012
Daily livestock report nov 15 2012joseleorcasita
 
Daily livestock report jan 31 2013
Daily livestock report jan 31 2013Daily livestock report jan 31 2013
Daily livestock report jan 31 2013joseleorcasita
 
Daily livestock report feb 26 2013
Daily livestock report feb 26 2013Daily livestock report feb 26 2013
Daily livestock report feb 26 2013joseleorcasita
 
Daily livestock report sep 10 2012
Daily livestock report sep 10 2012Daily livestock report sep 10 2012
Daily livestock report sep 10 2012joseleorcasita
 
Daily livestock report dec 26 2012
Daily livestock report dec 26 2012Daily livestock report dec 26 2012
Daily livestock report dec 26 2012joseleorcasita
 
Daily livestock report apr 03 2013
Daily livestock report apr 03 2013Daily livestock report apr 03 2013
Daily livestock report apr 03 2013joseleorcasita
 

Semelhante a Daily livestock report mar 25 2013 (20)

Daily livestock report jan 28 2013
Daily livestock report jan 28 2013Daily livestock report jan 28 2013
Daily livestock report jan 28 2013
 
Daily livestock report feb 25 2013
Daily livestock report feb 25 2013Daily livestock report feb 25 2013
Daily livestock report feb 25 2013
 
Daily livestock report feb 21 2013
Daily livestock report feb 21 2013Daily livestock report feb 21 2013
Daily livestock report feb 21 2013
 
Daily livestock report sep 20 2012
Daily livestock report sep 20 2012Daily livestock report sep 20 2012
Daily livestock report sep 20 2012
 
Ldp m february 2013
Ldp m february 2013Ldp m february 2013
Ldp m february 2013
 
Daily livestock report july 23 2012
Daily livestock report july 23 2012Daily livestock report july 23 2012
Daily livestock report july 23 2012
 
Daily livestock report mar 05 2013
Daily livestock report mar 05 2013Daily livestock report mar 05 2013
Daily livestock report mar 05 2013
 
Daily livestock report mar 20 2013
Daily livestock report mar 20 2013Daily livestock report mar 20 2013
Daily livestock report mar 20 2013
 
Daily livestock report mar 21 2013
Daily livestock report mar 21 2013Daily livestock report mar 21 2013
Daily livestock report mar 21 2013
 
Ldp m august 2012
Ldp m august 2012Ldp m august 2012
Ldp m august 2012
 
Ldp m october 2012
Ldp m october 2012Ldp m october 2012
Ldp m october 2012
 
Daily livestock report apr 09 2013
Daily livestock report apr 09 2013Daily livestock report apr 09 2013
Daily livestock report apr 09 2013
 
Daily livestock report mar 27 2013
Daily livestock report mar 27 2013Daily livestock report mar 27 2013
Daily livestock report mar 27 2013
 
Daily livestock report oct 16 2012
Daily livestock report oct 16 2012Daily livestock report oct 16 2012
Daily livestock report oct 16 2012
 
Daily livestock report nov 15 2012
Daily livestock report nov 15 2012Daily livestock report nov 15 2012
Daily livestock report nov 15 2012
 
Daily livestock report jan 31 2013
Daily livestock report jan 31 2013Daily livestock report jan 31 2013
Daily livestock report jan 31 2013
 
Daily livestock report feb 26 2013
Daily livestock report feb 26 2013Daily livestock report feb 26 2013
Daily livestock report feb 26 2013
 
Daily livestock report sep 10 2012
Daily livestock report sep 10 2012Daily livestock report sep 10 2012
Daily livestock report sep 10 2012
 
Daily livestock report dec 26 2012
Daily livestock report dec 26 2012Daily livestock report dec 26 2012
Daily livestock report dec 26 2012
 
Daily livestock report apr 03 2013
Daily livestock report apr 03 2013Daily livestock report apr 03 2013
Daily livestock report apr 03 2013
 

Mais de joseleorcasita

Inac boletin semanal 24082013
Inac boletin semanal 24082013Inac boletin semanal 24082013
Inac boletin semanal 24082013joseleorcasita
 
Bcr boletin informativo 23082013
Bcr boletin informativo 23082013Bcr boletin informativo 23082013
Bcr boletin informativo 23082013joseleorcasita
 
Bcr informativo semanal 19042013
Bcr informativo semanal 19042013Bcr informativo semanal 19042013
Bcr informativo semanal 19042013joseleorcasita
 
Inac boletin semanal 13042013
Inac boletin semanal 13042013Inac boletin semanal 13042013
Inac boletin semanal 13042013joseleorcasita
 
Daily livestock report apr 19 2013
Daily livestock report apr 19 2013Daily livestock report apr 19 2013
Daily livestock report apr 19 2013joseleorcasita
 
Daily livestock report apr 18 2013
Daily livestock report apr 18 2013Daily livestock report apr 18 2013
Daily livestock report apr 18 2013joseleorcasita
 
Daily livestock report apr 16 2013
Daily livestock report apr 16 2013Daily livestock report apr 16 2013
Daily livestock report apr 16 2013joseleorcasita
 
Daily livestock report apr 15 2013
Daily livestock report apr 15 2013Daily livestock report apr 15 2013
Daily livestock report apr 15 2013joseleorcasita
 
Usda report april 2013
Usda report april 2013Usda report april 2013
Usda report april 2013joseleorcasita
 
Daily livestock report apr 12 2013
Daily livestock report apr 12 2013Daily livestock report apr 12 2013
Daily livestock report apr 12 2013joseleorcasita
 
Daily livestock report apr 11 2013
Daily livestock report apr 11 2013Daily livestock report apr 11 2013
Daily livestock report apr 11 2013joseleorcasita
 
Daily livestock report apr 10 2013
Daily livestock report apr 10 2013Daily livestock report apr 10 2013
Daily livestock report apr 10 2013joseleorcasita
 
Daily livestock report apr 08 2013
Daily livestock report apr 08 2013Daily livestock report apr 08 2013
Daily livestock report apr 08 2013joseleorcasita
 

Mais de joseleorcasita (20)

Bcr boletin 06092013
Bcr boletin 06092013Bcr boletin 06092013
Bcr boletin 06092013
 
Inac boletin 31082013
Inac boletin 31082013Inac boletin 31082013
Inac boletin 31082013
 
Boletim do leite 221
Boletim do leite 221Boletim do leite 221
Boletim do leite 221
 
Boletim do leite 220
Boletim do leite 220Boletim do leite 220
Boletim do leite 220
 
Boletim do leite 219
Boletim do leite 219Boletim do leite 219
Boletim do leite 219
 
Boletim do leite 218
Boletim do leite 218Boletim do leite 218
Boletim do leite 218
 
Boletim do leite 217
Boletim do leite 217Boletim do leite 217
Boletim do leite 217
 
Inac boletin semanal 24082013
Inac boletin semanal 24082013Inac boletin semanal 24082013
Inac boletin semanal 24082013
 
Bcr boletin informativo 23082013
Bcr boletin informativo 23082013Bcr boletin informativo 23082013
Bcr boletin informativo 23082013
 
Bcr informativo semanal 19042013
Bcr informativo semanal 19042013Bcr informativo semanal 19042013
Bcr informativo semanal 19042013
 
Inac boletin semanal 13042013
Inac boletin semanal 13042013Inac boletin semanal 13042013
Inac boletin semanal 13042013
 
Daily livestock report apr 19 2013
Daily livestock report apr 19 2013Daily livestock report apr 19 2013
Daily livestock report apr 19 2013
 
Daily livestock report apr 18 2013
Daily livestock report apr 18 2013Daily livestock report apr 18 2013
Daily livestock report apr 18 2013
 
Daily livestock report apr 16 2013
Daily livestock report apr 16 2013Daily livestock report apr 16 2013
Daily livestock report apr 16 2013
 
Daily livestock report apr 15 2013
Daily livestock report apr 15 2013Daily livestock report apr 15 2013
Daily livestock report apr 15 2013
 
Usda report april 2013
Usda report april 2013Usda report april 2013
Usda report april 2013
 
Daily livestock report apr 12 2013
Daily livestock report apr 12 2013Daily livestock report apr 12 2013
Daily livestock report apr 12 2013
 
Daily livestock report apr 11 2013
Daily livestock report apr 11 2013Daily livestock report apr 11 2013
Daily livestock report apr 11 2013
 
Daily livestock report apr 10 2013
Daily livestock report apr 10 2013Daily livestock report apr 10 2013
Daily livestock report apr 10 2013
 
Daily livestock report apr 08 2013
Daily livestock report apr 08 2013Daily livestock report apr 08 2013
Daily livestock report apr 08 2013
 

Daily livestock report mar 25 2013

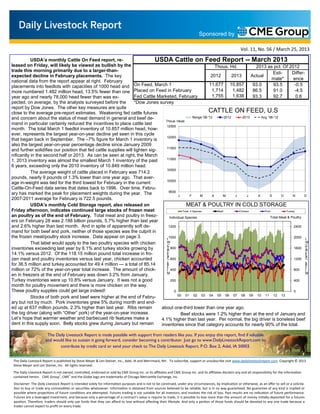
  • 1. Sponsored by Vol. 11, No. 56 / March 25, 2013  USDA’a monthly Cattle On Feed report, re- USDA Cattle on Feed Report -- March 2013 leased on Friday, will likely be viewed as bullish by the Thous. Hd. 2013 as pct. Of 2012 trade this morning primarily due to a larger-than- Esti- Differ- expected decline in February placements. The key 2012 2013 Actual mate* ence national data from the report appear at right. February placements into feedlots with capacities of 1000 head and On Feed, March 1 11,677 10,857 93.0 93.5 -0.5 more numbered 1.482 million head, 13.5% fewer than one Placed on Feed in February 1,714 1,482 86.5 91.0 -4.5 year ago and nearly 78,000 head fewer than was ex- Fed Cattle Marketed, February 1,755 1,638 93.3 92.7 0.6 pected, on average, by the analysts surveyed before the *Dow Jones survey report by Dow Jones. The other key measures are quite close to the average pre-report estimates. Weakening fed cattle futures CATTLE ON FEED, U.S and concern about the status of meat demand in general and beef de- Range '08-'12 2012 2013 Avg. '08-'12 Thous. Head mand in particular certainly reduced the incentives to place cattle last 12500 month. The total March 1 feedlot inventory of 10.857 million head, how- ever, represents the largest year-on-year decline yet seen in this cycle 12000 that began back in September. The –7% figure for March 1 inventory is also the largest year-on-year percentage decline since January 2009 11500 and further solidifies our position that fed cattle supplies will tighten sig- nificantly in the second half or 2013. As can be seen at right, the March 11000 1, 2013 inventory was almost the smallest March 1 inventory of the past 6 years, exceeding only the 2010 inventory of 10.849 million head. 10500 The average weight of cattle placed in February was 714.2 pounds, nearly 9 pounds of 1.3% lower than one year ago. That aver- 10000 age in-weight was tied for the third lowest for February in the current Cattle-On-Feed data series that dates back to 1996. Over time, Febru- 9500 ary has marked the peak for placement weights during the year. The J F M A M J J A S O N D 2007-2011 average for February is 722.5 pounds. USDA’s monthly Cold Storage report, also released on MEAT & POULTRY IN COLD STORAGE Friday afternoon, indicates continued large stocks of frozen meat Total, 4 Species Beef Chicken Pork Turkey an poultry as of the end of February. Total meat and poultry in freez- Individual Species Total Meat & Poultry ers on February 28 was 2.188 billion pounds, 5.7% higher than last year and 2.6% higher than last month. And in spite of apparently soft de- 1200 2400 mand for both beef and pork, neither of those species was the culprit in the frozen meat/poultry stock increase. Data appear on page 3. t 1000 . 2000 t . That label would apply to the two poultry species with chicken W W C C inventories exceeding last year by 6.1% and turkey stocks growing by T 800 R 1600 T R / / 14.1% versus 2012. Of the 118.15 million pound total increase in fro- c r c r a a zen meat and poultry inventories versus last year, chicken accounted C 600 , . 1200 C , . for 36.5 million and turkey accounted for 49.4 million — a total of 85.14 s s b b L L million or 72% of the year-on-year total increase. The amount of chick- . l i 400 800 . l i M M en in freezers at the end of February was down 3.2% from January. Turkey inventories were up 10.8% versus January. It was not a good 200 400 month for poultry movement and there is more chicken on the way. These poultry supplies could get large indeed! 0 0 00 01 02 03 04 05 06 07 08 09 10 11 12 13 Stocks of both pork and beef were higher at the end of Febru- ary but not by much. Pork inventories grew 5% during month and end- ed up at 637 million pounds, 2.3% higher than last year. Ribs remain about one-third lower than one year ago. the big driver (along with “Other” pork) of the year-on-year increase. Beef stocks were 1.2% higher than at the end of January and Let’s hope that warmer weather and barbecued rib features make a 4.1% higher than last year. Per normal, the big driver is boneless beef dent in this supply soon. Belly stocks grew during January but remain inventories since that category accounts for nearly 90% of the total. The Daily Livestock Report is made possible with support from readers like you. If you enjoy this report, find if valuable and would like to sustain it going forward, consider becoming a contributor. Just go to www.DailyLivestockReport.com to contribute by credit card or send your check to The Daily Livestock Report, P.O. Box 2, Adel, IA 50003. The Daily Livestock Report is published by Steve Meyer & Len Steiner, Inc., Adel, IA and Merrimack, NH.   To subscribe, support or unsubscribe visit www.dailylivestockreport.com. Copyright © 2013  Steve Meyer and Len Steiner, Inc.  All rights reserved.  The Daily Livestock Report is not owned, controlled, endorsed or sold by CME Group Inc. or its affiliates and CME Group Inc. and its affiliates disclaim any and all responsibility for the informa on  contained herein.   CME Group®, CME® and the Globe logo are trademarks of Chicago Mercan le Exchange, Inc.   Disclaimer: The Daily Livestock Report is intended solely for informa on purposes and is not to be construed, under any circumstances, by implica on or otherwise, as an offer to sell or a solicita‐ on to buy or trade any commodi es or securi es whatsoever. Informa on is obtained from sources believed to be reliable, but is in no way guaranteed. No guarantee of any kind is implied or  possible where projec ons of future condi ons are a empted. Futures trading is not suitable for all investors, and involves the risk of loss. Past results are no indica on of future performance.  Futures are a leveraged investment, and because only a percentage of a contract’s value is require to trade, it is possible to lose more than the amount of money ini ally deposited for a futures  posi on. Therefore, traders should only use funds that they can afford to lose without affec ng their lifestyle. And only a por on of those funds should be devoted to any one trade because a  trader cannot expect to profit on every trade.  
  • 2. Sponsored by Vol. 11, No. 56 / March 25, 2013  USDA Cold Storage Report March 22, 2013 Product Quantity in All Warehouses Current as pct. of: 2/28/12 1/31/13 2/28/13 2/28/12 1/31/13 Chicken -------------- Thous. Lbs. ---------------- Whole Chickens 13937 18,741 16,372 117.5 87.4 Hens, Mature Chickens 4051 3,474 1,505 37.2 43.3 Breasts & Breast Meat 122332 129,741 127,276 104.0 98.1 Drumsticks 15040 17,032 12,824 85.3 75.3 Leg Quarters 94769 116,367 109,227 115.3 93.9 Legs 9715 13,055 10,020 103.1 76.8 Thigh & Thigh Quarters 9620 8,836 7,673 79.8 86.8 Thigh Meat 20834 17,914 17,627 84.6 98.4 Wings 33732 59,737 62,788 186.1 105.1 Paws and Feet 27681 22,546 19,684 71.1 87.3 Other 247987 250,105 251,226 101.3 100.4 Total Chicken 599,698 657,548 636,222 106.1 96.8 Turkey Whole Turkeys 141,002 146,967 171,734 121.8 116.9 Toms (Whole) 59,607 68,418 83,145 139.5 121.5 Hens (Whole) 81,395 78,549 88,589 108.8 112.8 Breasts 59,759 63,914 66,800 111.8 104.5 Legs 21,533 20,930 19,683 91.4 94.0 Mech. Deboned Turkey 10,427 9,660 13,036 125.0 134.9 Other Turkey 36,041 33,232 30,451 84.5 91.6 Unclassified 80,815 85,315 97,229 120.3 114.0 Total Turkey 349,577 360,018 398,933 114.1 110.8 Ducks 2,222 1,444 1,482 66.7 102.6 Total Poultry 951,497 1,019,010 1,036,637 108.9 101.7 Frozen Pork Picnics, Bone-in 12,068 12,267 15,581 129.1 127.0 Hams, Total 110,238 108,450 110,506 100.2 101.9 Bone-in 55,591 50,539 53,462 96.2 105.8 Boneless 3/ 54,647 57,911 57,044 104.4 98.5 Bellies 61,577 36,425 42,667 69.3 117.1 Loins, Total 43,440 43,989 41,867 96.4 95.2 Bone-in 14,253 13,755 15,083 105.8 109.7 Boneless 4/ 29,187 30,234 26,784 91.8 88.6 Ribs 5/ 96,043 114,370 122,620 127.7 107.2 Butts 27,822 31,091 28,640 102.9 92.1 Trimmings 6/ 64,964 57,826 64,328 99.0 111.2 Other 7/ 94,597 109,891 111,654 118.0 101.6 Variety Meats 8/ 37,466 28,109 32,416 86.5 115.3 Unclassified 9/ 74,458 64,007 66,414 89.2 103.8 Total Pork 622,673 606,425 636,693 102.3 105.0 Frozen Beef Boneless 1/ 412,908 420,786 433,597 105.0 103.0 Beef Cuts 2/ 57,900 63,824 56,716 98.0 88.9 Total Beef 470,808 484,610 490,313 104.1 101.2 Other Meat Veal 4,363 5,012 4,858 111.3 96.9 Lamb & Mutton 20,851 18,768 19,841 95.2 105.7 Total Other Meat 25,214 23,780 24,699 98.0 103.9 Total Meat 1,118,695 1,114,815 1,151,705 103.0 103.3 Total Meat & Poultry 2,070,192 2,133,825 2,188,342 105.7 102.6
  • 3. Sponsored by Vol. 11, No. 56 / March 25, 2013  PRODUCTION AND PRICE SUMMARY Week Ending 3/23/2013 Current Pct. Pct. Pct. Item Units Week Last Week Change Last Year Change YTD Change Total Meat & Poultry Prod. Million lbs. 1693.7 1713.7 -1.17% 1683.6 0.60% 19,394 0.34% C FI Slaughter Thou. Head 601 606 -0.83% 603 -0.32% 7,041 -3.38% A FI Cow Slaughter Thou. Head 123.7 116.9 5.87% 124.6 -0.72% 1,228 -2.11% T Avg. Live Weight Lbs. 1315 1312 0.23% 1297 1.39% 1,324 1.34% T Avg. Dressed Weight Lbs. 796 798 -0.25% 787 1.14% 799 1.49% L Beef Production Million Lbs. 476.9 482.3 -1.12% 473.6 0.70% 5,577 -2.57% E Live Fed Steer $/cwt live wt. 124.77 126.66 -1.50% 126.59 -1.44% Dressed Steer $/cwt carcass 197.71 200.46 -1.37% 203.15 -2.68% & OKC Feeder Steer 700-800 Lbs. 139.10 136.65 1.80% 157.18 -11.50% Beef Cutout 600-750 Choice 193.57 196.75 -1.62% 189.63 2.08% B Hide/Offal $/cwt live wt. 14.25 13.96 2.08% 13.71 3.94% E Rib Choice 287.08 286.18 0.31% 282.41 1.65% E Round Choice 167.72 172.50 -2.77% 160.51 4.49% F Chuck Choice 168.91 173.71 -2.76% 151.63 11.40% Trimmings, 50% Fresh 88.09 88.05 0.05% 89.23 -1.28% Trimmings, 90% Fresh 219.41 219.19 0.10% 218.89 0.24% H FI Slaughter Thou. Head 2176 2203 -1.23% 2132 2.06% 25,476 -1.12% O FI Sow Slaughter Thou. Head 57.0 54.9 3.68% 54.8 3.98% 556 -0.19% G Avg. Dressed Weight Lbs. 208 207 0.48% 209 -0.48% 208 -0.68% S Pork Production Million Lbs. 451.7 457 -1.16% 445.4 1.41% 5,285 -1.69% Iowa-S. Minn. Direct Avg. 72.36 74.49 -2.86% 84.37 -14.23% & Natl. Base Carcass Price Weighted Avg. 75.74 76.42 -0.89% 84.82 -10.71% Natl. Net Carcass Price Weighted Avg. 78.17 78.83 -0.84% 87.29 -10.45% P Pork Cutout 200 Lbs 77.98 78.46 -0.61% 80.50 -3.13% O Hams Primal Cutout 56.50 58.30 -3.09% 61.34 -7.89% R Loins Primal Cutout 86.15 87.28 -1.29% 97.68 -11.80% K Trimmings, 72% Lean Fresh 53.00 53.61 -1.14% 59.29 -10.61% Bellies Primal Cutout 128.69 128.68 0.01% 102.27 25.83% C Young Chicken Slaughter* Million Head 151.26 153.39 -1.39% 153.06 -1.17% 1,663 1.10% H Avg. Weight Lbs., RTC 4.37 4.34 0.51% 4.28 2.09% 4.3 1.86% I Broiler Production Million Lbs., RTC 660.4 666.2 -0.88% 654.5 0.89% 7,371 4.34% C Eggs Set Million 200.2 199.4 0.42% 197.6 1.34% 2,179 1.48% K Chicks Placed Million Head 164.9 164.8 0.02% 163.0 1.14% 1,796 0.93% E 12-City Broiler Composite 106.68 107.78 -1.00% 91.82 16.20% N Georgia Dock Broiler 2.5-3 Lbs. 101.86 101.69 0.20% 92.34 10.30% Northeast Breast Skinlss/Bonelss 148.8 145.48 2.30% 134.51 10.60% Northeast Leg Quarters 66.85 66.59 3.00% 72.10 -6.90% T Young Turkey Slaughter* Million Head 4.15 4.31 -3.78% 4.45 -6.74% 46.4 0.03% U Avg. Weight Lbs. 25.24 25.08 0.64% 24.74 2.00% 25.1 -0.26% R Turkey Production Million Lbs. 104.7 108.2 -3.17% 110.1 -4.87% 1,161 -0.28% K Eastern Region Hen 8-16 Lbs. 95.50 95.50 0.00% 104.5 -8.60% F Corn, Omaha $ per Bushel 7.66 7.54 1.59% 6.50 17.94% E DDGS, Minnesota $ per ton 257.50 257.50 0.00% 201.50 27.79% E Wheat, Kansas City $ per Bushel 7.35 7.20 2.08% 6.68 10.03% D Soybeans, S. Iowa $ per Bushel 14.87 14.81 0.41% 13.57 9.50% SB Meal, 48% Central Illinois $ per Ton 435.90 437.00 -0.25% 366.10 19.10% * Chicken & turkey slaughter, production and prices are 1 week earlier than the date at the top of this table. Cow & sow slaughter are for 2 weeks earlier